[Preprint]. 2023 Aug 15:2023.08.13.553152.
doi: 10.1101/2023.08.13.553152.

Mechanical force regulates ligand binding and function of PD-1

Affiliations

Mechanical force regulates ligand binding and function of PD-1

Kaitao Li et al. bioRxiv. .

Update in

Abstract

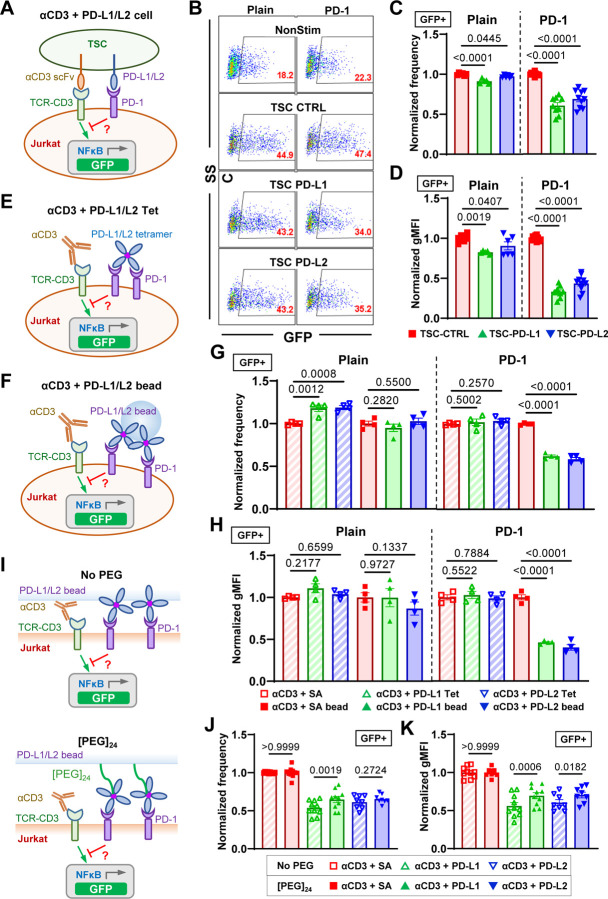
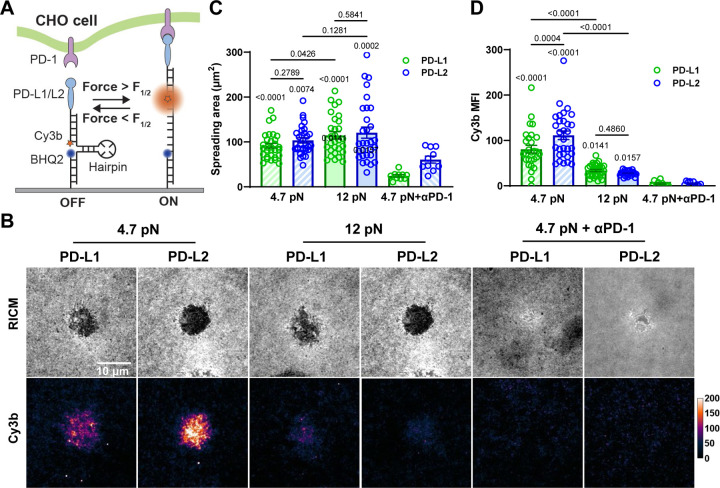
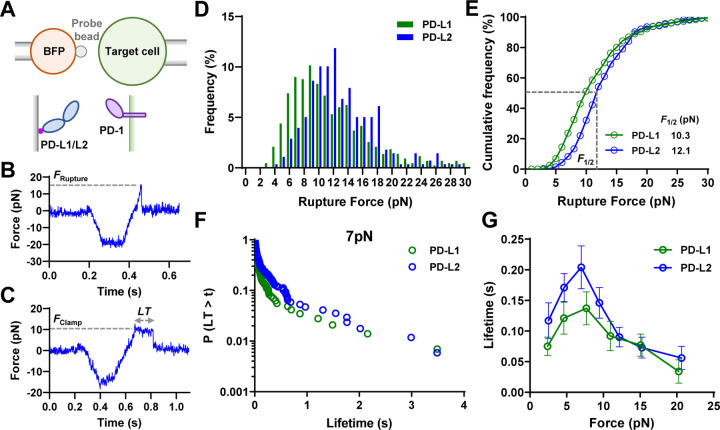
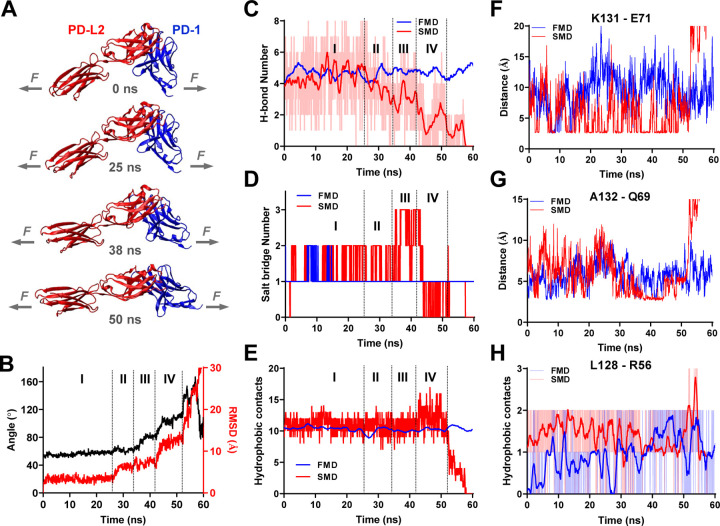
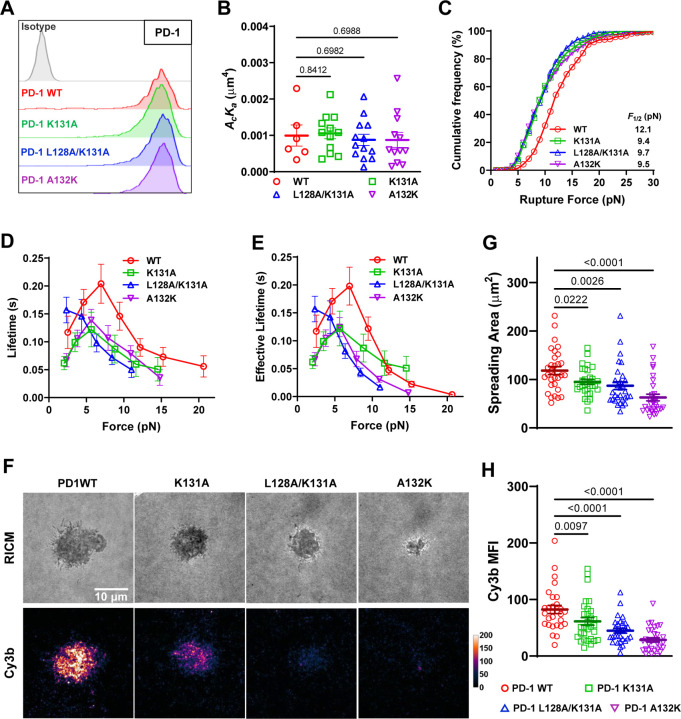
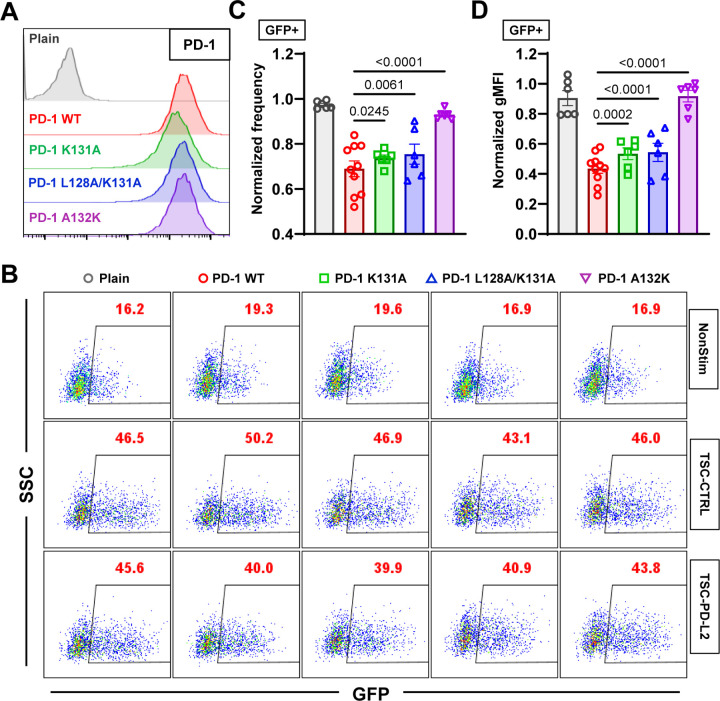
Immune checkpoint blockade targeting PD-1 shows great success in cancer therapy. However, the mechanism of how ligand binding initiates PD-1 signaling remains unclear. As prognosis markers of multiple cancers, soluble PD-L1 is found in patient sera and can bind PD-1, but fails to suppress T cell function. This and our previous observations that T cells exert endogenous forces on PD-1-PD-L2 bonds prompt the hypothesis that mechanical force might be critical to PD-1 triggering, which is missing in the soluble ligand case due to the lack of mechanical support afforded by surface-anchored ligand. Here we show that PD-1 function is eliminated or reduced when mechanical support on ligand is removed or dampened, respectively. Force spectroscopic analysis reveals that PD-1 forms catch bonds with both PD-Ligands <7 pN where force prolongs bond lifetime, but slip bonds >8 pN where force accelerates dissociation. Steered molecular dynamics finds PD-1-PD-L2 complex very sensitive to force due to the two molecules' "side-to-side" binding via β sheets. Pulling causes relative rotation and translation between the two molecules by stretching and aligning the complex along the force direction, yielding new atomic contacts not observed in the crystal structure. Compared to wild-type, PD-1 mutants targeting the force-induced new interactions maintain the same binding affinity but display lower rupture force, shorter bond lifetime, reduced tension, and most importantly, impaired capacity to suppress T cell activation. Our results uncover a mechanism for cells to probe the mechanical support of PD-1-PD-Ligand bonds using endogenous forces to regulate PD-1 triggering.


Figures

Fig. 1.
Fig. 1.
The inhibitory function of PD-1 requires PD-Ligands to bear mechanical support. (A) Schematics of stimulating NFκB::eGFP reporter Jurkat cells with T-cell stimulator cells (TSC) expressing a single-chain fragment variable (scFv) of anti-CD3 (clone OKT3) and PD-L1 or PD-L2. (B) Representative SSC vs GFP plots of reporter Jurkat cells 24 hr after stimulation with indicated conditions. (C-D) Quantification of GFP expression for conditions in B. n = 5 – 6 for plain pooled from 3 independent experiments or n = 9 – 10 for PD-1 reporter cells pooled from 5 independent experiments. (E-F) Schematics of stimulating NFκB::eGFP reporter Jurkat cells with soluble anti-CD3 and soluble (E) or bead-coated (F) PD-Ligands. (G-H) Quantification of GFP expression for conditions in E&F. n = 4 for all conditions pooled from two independent experiments. (I) Schematics of stimulating NFκB::eGFP reporter Jurkat cells with soluble anti-CD3 and PD-Ligands coated beads without or with [PEG]24 spacer arm. (J-K) Quantification of GFP expression for conditions in I. n = 10, 10, and 8 for SA, PD-L1, and PD-L2, respectively, pooled from 5 independent experiments. Normalized frequency (C, G, and J) and normalized geometric mean fluorescence intensity (gMFI) (D, H, and K) were calculated as (sample – averaged background)/(anti-CD3 control – averaged background). Numbers on graphs represent p values calculated from two-tailed student t-test.
Fig. 2.
Fig. 2.
DNA-based MTPs reveal active cellular forces applied to PD-1–PD-Ligand bonds. (A) Schematics of detecting cellular forces on PD-1–PD-Ligand bonds using DNA-based molecular tension probes (MTPs). Force above unfolding threshold of the hairpin separates Cy3B from the BHQ2 quencher enabling fluorescence. (B) Representative reflection interference contrast microscopy (RICM) and Cy3b fluorescence images of PD-1 expressing CHO cells 30 min after landing on glass surface functionalized with MTPs of indicated conditions. For PD-1 blockade, cells were pre-incubated with PD-1 blocking antibody clone 29F.1A12 before imaging. (C-D) Quantification of cell spreading area (C) and tension signal (D) for conditions in B. n = 30, 30, 30, 30, 10, and 10 pooled from 3 independent experiments. Numbers on graphs represent p values calculated from two-tailed student t-test comparing two groups as indicated or each group to corresponding PD-1 blockade control.
Fig. 3.
Fig. 3.
PD-1 forms catch bond with PD-L1 and PD-L2. (A) Schematics of force spectroscopic analysis of PD-1–PD-Ligand bonds using biomembrane force probe (BFP). CHO cells expressing PD-1 were analyzed against BFP bead coated with PD-L1 or PD-L2. Bead displacements were tracked with high spatiotemporal resolution and translated into force after multiplying by the spring constant of BFP. (B&C) Representative raw traces of rupture force (B) and bond lifetime (C) measurements. A target cell held by piezo-driven micropipette was brought into brief contact with a bead (approach and contact) to allow for bond formation. Upon separation the target cell either kept retracting to rupture the bond (B) or stopped and held at a predefined force level until bond dissociated spontaneously (C). (D&E) Force histograms (D) and cumulative frequencies (E) of rupture events of 433 PD-1–PD-L1 and 278 PD-1–PD-L2 bonds. F1/2 is defined as the force level at which 50% of the bonds are ruptured. p < 0.0001 comparing F1/2 of PD-1–PD-L1 and PD-1–PD-L2 using two-tailed Mann-Whitney test. (F&G) Survival frequencies at the 7 pN force bin (F) and mean ± sem bond lifetime vs force plots (G) of 497 PD-1–PD-L1 and 777 PD-1–PD-L2 bonds. p < 0.0001 comparing lifetime vs force distributions of PD-1–PD-L1 and PD-1–PD-L2 using two-tailed two-dimensional Kolmogorov-Smirnov test.
Fig. 4.
Fig. 4.
Molecular dynamics (MD) reveals force induced PD-1–PD-L2 conformational change and formation of new atomic-level contacts. (A) Snapshots of PD-1–PD-L2 complex undergoing conformational changes in response to force. (B) Changes in relative angle (black curve, left y-axis) and root mean square displacement (RMSD, red curve, right y-axis) between PD-1 and PD-L2 in response to force. (C-E) Comparison of total number of hydrogen bond (H-bond, C), salt bridge (D), and hydrophobic contacts (E) between PD-1 and PD-L2 during free MD (FMD) and force steered MD (SMD). (F-H) Comparison of dynamics of possible interactions between indicated residues of PD-1 and PD-L2 during FMD (blue) and SMD (red). Atomic-level contacts were defined by an interatomic distance of < 3.5 Å, which were more frequently observed in FMD than in FMD.
Fig. 5.
Fig. 5.
PD-1 mutants preventing force-induced atomic contacts impairs PD-1–PD-L2 mechanical stability. (A) Flow cytometry histograms comparing PD-1 staining of CHO cells expressing WT or indicated mutants of PD-1. (B) 2D effective affinity of PD-L2 binding to CHO cells expressing WT or indicated mutants of PD-1. n = 6, 12, 13, and 12 cell pairs for WT, K131A, L128A/K131A, and A132K, respectively. (C) Cumulative frequencies of rupture force events for PD-L2 binding to PD-1 WT (n = 278 events), K131A (n = 210 events), L128A/K131A (n = 345 events), and A132K (n = 270 events) bonds. p < 0.0001 comparing F1/2 of WT and each mutant using two-tailed Mann-Whitney test. (D) Mean ± sem bond lifetime vs force plots for single PD-L2 bonds with PD-1 WT (n = 785 events), K131A (n = 625 events), L128A/K131A (n = 759 events), and A132K (n = 780 events). p < 0.0001 comparing lifetime vs force distributions of WT and each mutant using two-tailed two-dimensional Kolmogorov-Smirnov test. (F) Representative RICM and Cy3b fluorescence images of CHO cells expressing PD-1 WT or indicated mutants 30 min after landing on glass surface functionalized with PD-L2-coupled MTP of 4.7 pN threshold force. (G-H) Quantification of cell spreading area (G) and tension signal (H) for conditions in F. n = 29, 30, 30, and 30 pooled from 3 independent experiments. Numbers on graphs represent p values calculated from two-tailed student t-test.
Fig. 6.
Fig. 6.
PD-1 mutants with impaired PD-1–PD-L2 mechanical stability demonstrate reduced inhibitory function. (A) Flow cytometry histograms comparing PD-1 staining of NFκB::eGFP reporter Jurkat cells expressing no, WT, or indicated mutants of PD-1. (B) Representative SSC vs GFP plots of reporter Jurkat cells 24 hr after stimulation with indicated conditions. (C-D) Quantification of GFP expression for conditions in B. Normalized frequency (C&G) and normalized geometric mean fluorescence intensity (gMFI) (D&H) were calculated as (sample – averaged background)/(anti-CD3 control – averaged background). n = 6 for plain, PD-1 K131A, L128K/K131A, and A132K pooled from 3 independent experiments or n = 10 for PD-1 reporter cells pooled from 5 independent experiments. Numbers on graphs represent p values calculated from two-tailed student t-test.

References

    1. Barber D. L. et al. Restoring function in exhausted CD8 T cells during chronic viral infection. Nature 439, 682–687 (2006). - PubMed
    1. Day C. L. et al. PD-1 expression on HIV-specific T cells is associated with T-cell exhaustion and disease progression. Nature 443, 350–354 (2006). - PubMed
    1. Jin H. T., Ahmed R. & Okazaki T. Role of PD-1 in regulating T-cell immunity. Current topics in microbiology and immunology 350, 17–37 (2011). - PubMed
    1. Ishida Y., Agata Y., Shibahara K. & Honjo T. Induced expression of PD-1, a novel member of the immunoglobulin gene superfamily, upon programmed cell death. The EMBO journal 11, 3887–3895 (1992). - PMC - PubMed
    1. Yokosuka T. et al. Programmed cell death 1 forms negative costimulatory microclusters that directly inhibit T cell receptor signaling by recruiting phosphatase SHP2. The Journal of experimental medicine 209, 1201–1217 (2012). - PMC - PubMed

Publication types