. 2023 Aug 2;26(9):107522.
doi: 10.1016/j.isci.2023.107522. eCollection 2023 Sep 15.

Deep learning for risk-based stratification of cognitively impaired individuals

Affiliations

Deep learning for risk-based stratification of cognitively impaired individuals

Michael F Romano et al. iScience. .

Abstract

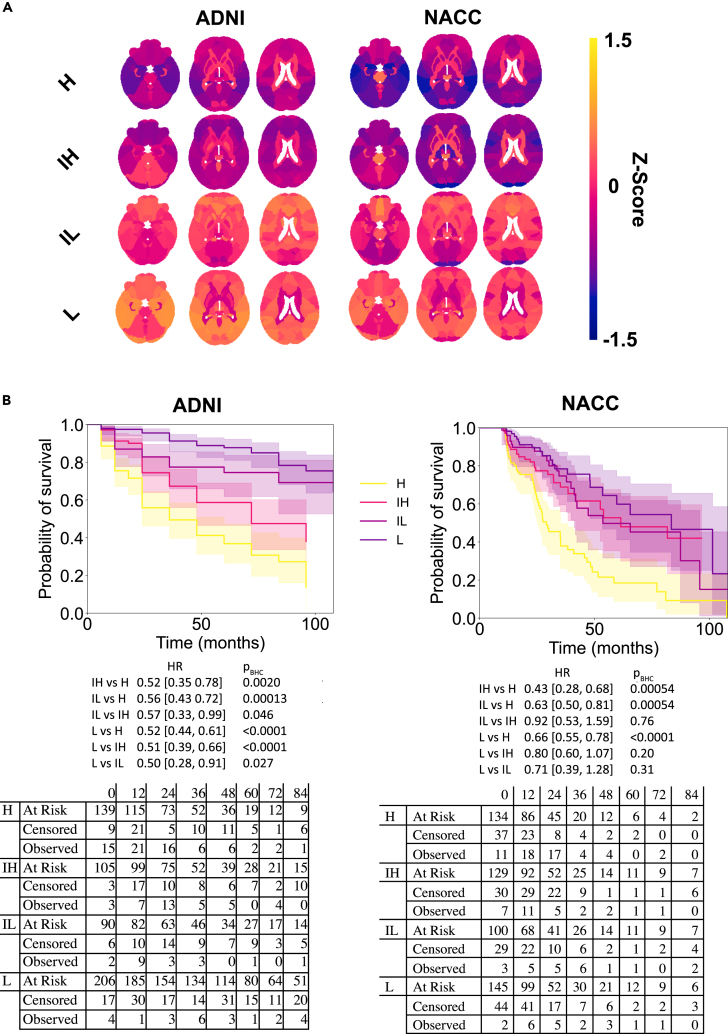
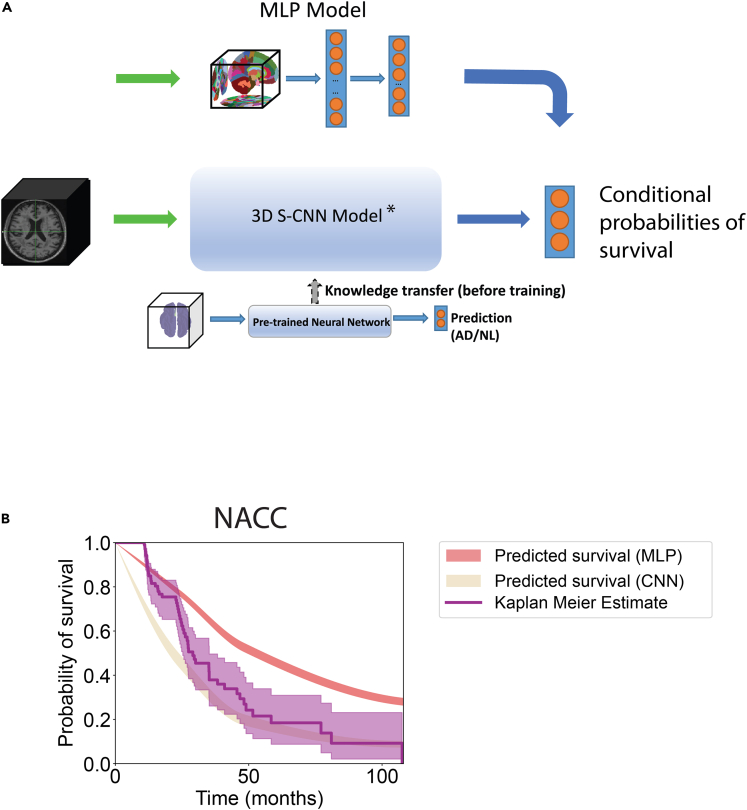
Quantifying the risk of progression to Alzheimer's disease (AD) could help identify persons who could benefit from early interventions. We used data from the Alzheimer's Disease Neuroimaging Initiative (ADNI, n = 544, discovery cohort) and the National Alzheimer's Coordinating Center (NACC, n = 508, validation cohort), subdividing individuals with mild cognitive impairment (MCI) into risk groups based on cerebrospinal fluid amyloid-β levels and identifying differential gray matter patterns. We then created models that fused neural networks with survival analysis, trained using non-parcellated T1-weighted brain MRIs from ADNI data, to predict the trajectories of MCI to AD conversion within the NACC cohort (integrated Brier score: 0.192 [discovery], and 0.108 [validation]). Using modern interpretability techniques, we verified that regions important for model prediction are classically associated with AD. We confirmed AD diagnosis labels using postmortem data. We conclude that our framework provides a strategy for risk-based stratification of individuals with MCI and for identifying regions key for disease prognosis.

Keywords: Health sciences; Illness behavior.


Conflict of interest statement

V.B.K. reports honoraria from invited scientific presentations not exceeding $5000/year. He also serves as a consultant to Davos Alzheimer’s Collaborative and AstraZeneca. R.A. is a scientific advisor to Signant Health and consultant to Biogen. The remaining authors declare no competing interests.

Figures

None
Graphical abstract
Figure 1
Figure 1
Study population Summary statistics of clinical and demographic parameters of persons from the Alzheimer’s Disease Neuroimaging Initiative (ADNI) and National Alzheimer's Coordinating Center (NACC) cohorts are shown. (A) Kaplan-Meier survival curves with 95% confidence intervals were computed for our two populations (ADNI: n = 544, 390 right-censored; NACC: n = 508, 378 right-censored). The number of persons at risk of progression, the number of persons censored, and the number of persons with “events”, or progression to AD, left-inclusive, are shown in the table to the left of the survival curves. The hazard ratio of the two curves is included. (B) The distribution of age (i) and Mini-Mental State Exam score (ii) for persons in the NACC and ADNI datasets are shown for persons in each progression category∗. (C) Concentration profiles of three different CSF biomarkers in the two cohorts, Aβ-42, total tau (t-tau), and phosphorylated tau (p-tau) are shown for persons in each progression category. Statistics were not computed for the NACC dataset due to the large amount of missing data. (D, E, and F) Distribution of sex and number of APOE e4 alleles of persons in each progression category, and the proportions of patients in each progression category are shown. (G) Pie charts summarizing the breakdown of race (left) and ethnicity (right) for each cohort. ∗Progression categories are—progression within 2 years, between 2 and 4 years, after 4 years, and censored or otherwise not progressed. See also Tables S1 and S2 for summary statistics for subplots 1A–1F.
Figure 2
Figure 2
Distribution of risk-based groups (A) Heatmaps of gray matter volumes (GMVs) Z-scored to the mean and standard deviations of each region in the complete ADNI dataset (n = 544) are illustrated for persons in each risk group. Warmer colors indicate larger Z-scored GMVs and cooler colors indicate smaller Z-scored GMVs. (B) Survival curves for persons in each of the risk groups in the ADNI and NACC dataset, compared at time points 24, 48, and 96 months, with their 95% confidence intervals. The numbers of patients at risk of progression, the numbers censored, and the number that have progressed, left-inclusive, are shown below the survival curves, in addition to pairwise hazard ratios and their 95% confidence intervals. Benjamini-Hochberg-corrected p-values are included next to their corresponding pairwise hazard ratios. Comprehensive, pairwise statistics are shown in Table S3. H – high-risk; IH – intermediate-high-risk; IL – intermediate-low-risk; L – low-risk.
Figure 3
Figure 3
Radiologist confirmation of atrophy grade differences between groups (A) Radiologist atrophy grades for each of 7 brain regions that were reviewed, averaged across both hemispheres and across 5 different radiologists. The grade of atrophy in each region is denoted on the y axis, where 3 corresponds to “severe” atrophy, 2 to “moderate” atrophy, 1 to “mild” atrophy, and 0 to no atrophy. Grades are divided by subjects within the H, IH, IL, and L risk groups on the x axis. (B) Mean Z-scored GMVs of parcellated brain regions within each lobe are plotted against the mean radiologist’s grade within each graded lobe, averaged across hemispheres, with a 95% bootstrapped confidence interval using 1000 repetitions. Spearman correlation coefficients between mean Z-scored GMVs and radiologist grades are included within each plot, along with their Benjamini-Hochberg-corrected p-values.
Figure 4
Figure 4
Schematics of the deep learning frameworks (A) Internal structure of a multilayer perceptron (MLP). Segmented GMVs were used as input to an MLP with two fully connected layers and used to predict the conditional probability of survival up to 24, 48, and 108 months. An S-CNN was also constructed to predict the same output. (B) An example comparison of empirical survival curves (Kaplan-Meier estimate with its 95% confidence interval) and predicted survival curves (interpolated in 1-month increments) using the conditional probabilities of survival from our MLP and S-CNN. Also, 95% confidence intervals around of the mean of predicted survival curves were computed via bootstrapping with 10,000 repetitions are shown. Here, “∗” indicates survival convolutional neural network, which can be seen in detail in Figure S1.
Figure 5
Figure 5
Cortical importance stratified by CSF-based risk groups (A) Differences between risk groups in absolute SHAP values averaged across all the time bins (24, 48, and 108 months), model predictions, and within each risk group for each voxel, computed for the external, NACC dataset. Shown in shades of blue are all voxels with a Z score of less than −2.0 and shown in shades of red are all voxels with a Z score of greater than 2.0. Z-scores were computed across all voxels for each subtracted brain. Values are overlayed on an exemplar subject’s pre-processed T1-weighted MRI. (B) Bar groups denoting the mean, absolute SHAP value for voxels in each cortical region, averaged for each participant in the NACC dataset. Error bars denote bootstrapped 95% confidence intervals. Here, n.s. = not significant; “∗” indicates p value < 0.05; “∗∗” indicates p value < 0.01; otherwise, all pairwise comparisons within each group p < 0.001.
Figure 6
Figure 6
Risk group-specific associations with postmortem pathology The proportion of persons who progressed to AD versus those who remained stable with MCI are shown with respect to postmortem AD pathology measures ADNC, CERAD, and Braak staging. Pairwise Fisher exact test with Benjamini-Hochberg correction were used to evaluate for statistical significance in differences in proportion of persons who progressed with respect to severity of AD pathology measures. Here “∗” indicates p value < 0.05, “∗∗” indicates p value < 0.01, and “∗∗∗” indicates p value < 0.001.

References

    1. 2020 Alzheimer's disease facts and figures. Alzheimer's Dementia. 2020;16:391–460. doi: 10.1002/alz.12068. - DOI - PubMed
    1. Schneider L.S., Mangialasche F., Andreasen N., Feldman H., Giacobini E., Jones R., Mantua V., Mecocci P., Pani L., Winblad B., Kivipelto M. Clinical trials and late-stage drug development for Alzheimer's disease: an appraisal from 1984 to 2014. J. Intern. Med. 2014;275:251–283. doi: 10.1111/joim.12191. - DOI - PMC - PubMed
    1. Robinson J.C. Why Is Aducanumab Priced at $56,000 per Patient? Lessons for Drug-Pricing Reform. N. Engl. J. Med. 2021;385:2017–2019. doi: 10.1056/nejmp2113679. - DOI - PubMed
    1. Mitchell A.J., Shiri-Feshki M. Rate of progression of mild cognitive impairment to dementia - meta-analysis of 41 robust inception cohort studies. Acta Psychiatr. Scand. 2009;119:252–265. doi: 10.1111/j.1600-0447.2008.01326.x. - DOI - PubMed
    1. Varatharajah Y., Ramanan V.K., Iyer R., Vemuri P., Alzheimer’s Disease Neuroimaging Initiative Predicting Short-term MCI-to-AD Progression Using Imaging, CSF, Genetic Factors, Cognitive Resilience, and Demographics. Sci. Rep. 2019;9:2235. doi: 10.1038/s41598-019-38793-3. - DOI - PMC - PubMed