. 2023 Aug 14:14:1202150.
doi: 10.3389/fimmu.2023.1202150. eCollection 2023.

Pan-cancer analysis of IFN-γ with possible immunotherapeutic significance: a verification of single-cell sequencing and bulk omics research

Affiliations

Pan-cancer analysis of IFN-γ with possible immunotherapeutic significance: a verification of single-cell sequencing and bulk omics research

Xiaoying Wei et al. Front Immunol. .

Abstract

Background: Interferon-gamma (IFN-γ), commonly referred to as type II interferon, is a crucial cytokine that coordinates the tumor immune process and has received considerable attention in tumor immunotherapy research. Previous studies have discussed the role and mechanisms associated with IFN-γ in specific tumors or diseases, but the relevant role of IFN-γ in pan-cancer remains uncertain.

Methods: TCGA and GTEx RNA expression data and clinical data were downloaded. Additionally, we analyzed the role of IFN-γ on tumors by using a bioinformatic approach, which included the analysis of the correlation between IFN-γ in different tumors and expression, prognosis, functional status, TMB, MSI, immune cell infiltration, and TIDE. We also developed a PPI network for topological analysis of the network, identifying hub genes as those having a degree greater than IFN-γ levels.

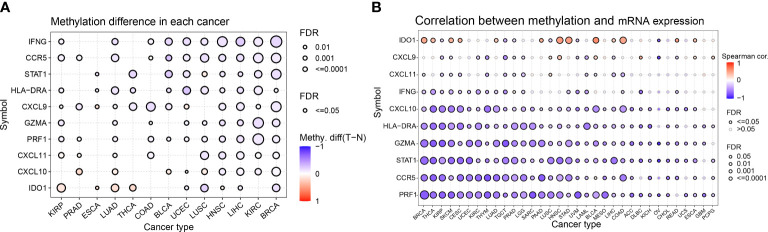
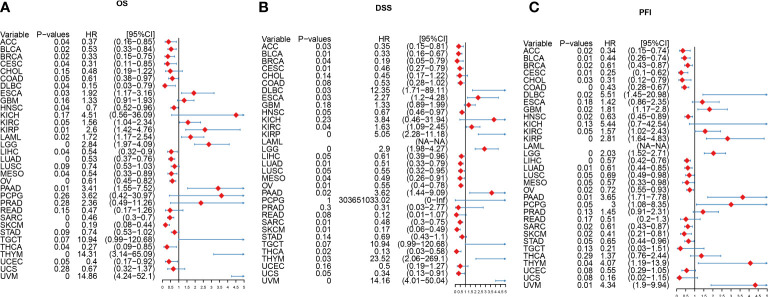
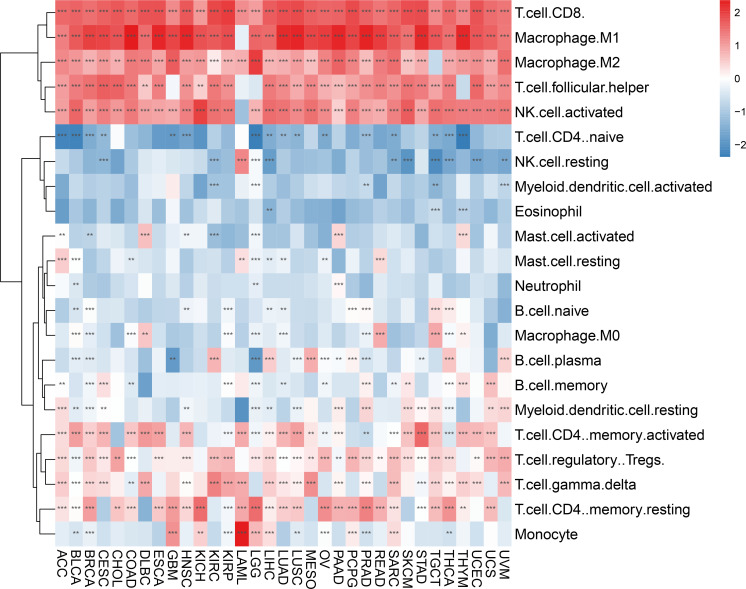
Result: IFN-γ was differentially expressed and predicted different survival statuses in a majority of tumor types in TCGA. Additionally, IFN-γ expression was strongly linked to factors like infiltration of T cells, immune checkpoints, immune-activating genes, immunosuppressive genes, chemokines, and chemokine receptors, as well as tumor purity, functional statuses, and prognostic value. Also, prognosis, CNV, and treatment response were all substantially correlated with IFN-γ-related gene expression. Particularly, the IFN-γ-related gene STAT1 exhibited the greatest percentage of SNVs and the largest percentage of SNPs in UCEC. Elevated expression levels of IFN-γ-related genes were found in a wide variety of tumor types, and this was shown to be positively linked to drug sensitivity for 20 different types of drugs.

Conclusion: IFN-γ is a good indicator of response to tumor immunotherapy and is likely to limit tumor progression, offering a novel approach for immunotherapy's future development.

Keywords: IFN-γ; immunotherapy; pan-cancer; single-cell transcriptome sequencing; tumor microenvironment.


Conflict of interest statement

The authors declare that the research was conducted in the absence of any commercial or financial relationships that could be construed as a potential conflict of interest.

Figures

Figure 1
Figure 1
Prognostic significance of differential IFN-γ-related genes (IFN-γ-RGs) in various cancers. (A) Expression analysis of IFN-γ-RGs in 33 different types of cancer. Red indicates high expression genes, blue indicates low expression genes. (B) Survival differences between high and low gene expression levels. Red indicates high hazard ratio (HR). The size of the circles represents the significance level, with larger circles indicating lower p-values.
Figure 2
Figure 2
Pie charts illustrating the copy number variation (CNV) distribution of IFN-γ-related genes (IFN-RGs) in 33 different cancers. (A) Each CNV pie chart shows the relative frequency of homozygous/heterozygous IFN-γ-RG combinations in each tumor type. Different colored sections represent different CNV types. (B) Association between CNV and mRNA expression. The size of the dots represents the statistical significance, with larger dots indicating higher significance. P-values have been adjusted by false discovery rate (FDR) correction. (C) Color shading represents the intensity of mutation frequency. The size of the numbers indicates how frequently the associated mutated genes occur in a given tumor sample. No number indicates no mutation of that gene anywhere, “0” indicates no mutation in the coding region of the gene. (D) SNV Oncoplot. The side and top bar plots show the number of variations among samples or genes.
Figure 3
Figure 3
Differential methylation analysis of IFN-γ-related genes in pan-cancer. (A) Differential methylation of IFN-RGs in 13 different cancers. Different colors represent different methylation levels, red dots indicate higher methylation levels in cancer, blue dots indicate lower methylation levels. (B) Association between methylation and mRNA gene expression. Different colored linkages represent different associations, red dots and blue dots represent positive and negative associations, respectively. P-values have been adjusted by FDR correction.
Figure 4
Figure 4
Differential expression of IFN-γ scores. (A) Association analysis between IFN-γ scores and IFN-γ-related gene expression. The hue of the colors represents the strength of the association, red dots and blue dots represent positive and negative associations, respectively. (B) Comparison of IFN-γ scores between 33 different types of tumors and normal tissues. *p < 0.05, ***p < 0.001, ****p < 0.0001, ns, no significance. P-values have been adjusted by FDR correction.
Figure 5
Figure 5
Forest plot of the results from univariate Cox regression analysis for IFN-γ. (A) Overall survival (OS). (B) Disease-specific survival (DSS). (C) Progression-free interval (PFI). P-values have been adjusted by FDR correction.
Figure 6
Figure 6
Construction of the protein-protein interaction (PPI) network. Red nodes represent IFN-γ-related genes, blue nodes represent other genes. The thickness of the lines indicates the strength of the evidence for the interaction.
Figure 7
Figure 7
Validation of STAT1 expression in breast malignant tumors and adjacent tissues using immunohistochemistry. (A) Example of STAT1 expression in breast malignant tumor detected by immunohistochemistry. (B) Statistical analysis of STAT1 expression using Student’s t-test to represent the mean values.
Figure 8
Figure 8
Associations between IFN-γ levels and 14 different functional states in various malignancies. Red and blue represent positive and negative associations, respectively. ** represents P<0.01, *** represents P<0.001.
Figure 9
Figure 9
Correlation between IFN-γ scores and tumor-infiltrating immune cells. There is a correlation between IFN-γ scores and tumor-infiltrating immune cells in 33 different tumors. Red and blue represent positive and negative correlations, respectively. **p < 0.01, ***p < 0.001.
Figure 10
Figure 10
Analysis of the correlation between IFN-γ scores and tumor purity. (A) Tumor microenvironment score analysis based on the correlation between interferon-gamma levels and immune cell infiltration. (B) Tumor immune score analysis based on the correlation between IFN-γ levels and tumor microenvironment scores. (C) Analysis of the relationship between IFN-γ and tumor stromal scores (all P<0.05).
Figure 11
Figure 11
Relationship between IFN-γ levels and immune-related genes. (A) Association between immune checkpoint status and IFN-γ levels in human malignancies. (B) Association between immune inhibitory genes and interferon-gamma scores in human cancers. (C) Association between IFN-γ scores and expression of immune activation genes in human tumors. (D) Association between chemical factors and IFN-γ levels in human malignancies. (E) Association between IFN-γ scores and expression of chemical factor receptors in human tumors. **p < 0.01, ***p < 0.001.
Figure 12
Figure 12
Immune therapy response indicators associated with IFN-γ in human malignancies. (A) Association between IFN-γ levels and tumor mutation burden in various cancers. (B) Association between microsatellite instability and interferon-gamma levels in cancers. (C) Association between IFN-γ scores and tumor immune dysfunction and exclusion scores. *p < 0.05, **p < 0.01, ***p < 0.001.
Figure 13
Figure 13
IFN-γ in the tumor microenvironment of KIRC. (A) t-distributed stochastic neighbor embedding (tSEN) plots showing 11 different cell types in KIRC samples. (B) tSEN plots of two KIRC samples. (C) IFN-γ scores of different cell types displayed on the tSEN plots. (D) Analysis of IFN-γ levels in different cell types in the tumor microenvironment of KIRC. The violin plots show the median of the IFN-γ scores. The letters at the top indicate whether there is a statistically significant difference between two cells. Different letters represent different levels of statistical significance.

Similar articles

Cited by

References

    1. Roy PS, Saikia BJ. Cancer and cure: A critical analysis. Indian J Cancer (2016) 53:441–2. doi: 10.4103/0019-509X.200658 - DOI - PubMed
    1. Lin JX, Leonard WJ. Fine-tuning cytokine signals. Annu Rev Immunol (2019) 37:295–324. doi: 10.1146/annurev-immunol-042718-041447 - DOI - PMC - PubMed
    1. Wang X, Lupardus P, Laporte SL, Garcia KC. Structural biology of shared cytokine receptors. Annu Rev Immunol (2009) 27:29–60. doi: 10.1146/annurev.immunol.24.021605.090616 - DOI - PMC - PubMed
    1. Propper DJ, Balkwill FR. Harnessing cytokines and chemokines for cancer therapy. Nat Rev Clin Oncol (2022) 19:237–53. doi: 10.1038/s41571-021-00588-9 - DOI - PubMed
    1. Broughton SE, Hercus TR, Lopez AF, Parker MW. Cytokine receptor activation at the cell surface. Curr Opin Struct Biol (2012) 22:350–9. doi: 10.1016/j.sbi.2012.03.015 - DOI - PubMed

Publication types