. 2023 Sep 15;133(7):542-558.
doi: 10.1161/CIRCRESAHA.123.322590. Epub 2023 Aug 30.

Proteomic Atlas of Atherosclerosis: The Contribution of Proteoglycans to Sex Differences, Plaque Phenotypes, and Outcomes

Affiliations

Proteomic Atlas of Atherosclerosis: The Contribution of Proteoglycans to Sex Differences, Plaque Phenotypes, and Outcomes

Konstantinos Theofilatos et al. Circ Res. .

Abstract

Background: Using proteomics, we aimed to reveal molecular types of human atherosclerotic lesions and study their associations with histology, imaging, and cardiovascular outcomes.

Methods: Two hundred nineteen carotid endarterectomy samples were procured from 120 patients. A sequential protein extraction protocol was employed in conjunction with multiplexed, discovery proteomics. To focus on extracellular proteins, parallel reaction monitoring was employed for targeted proteomics. Proteomic signatures were integrated with bulk, single-cell, and spatial RNA-sequencing data, and validated in 200 patients from the Athero-Express Biobank study.

Results: This extensive proteomics analysis identified plaque inflammation and calcification signatures, which were inversely correlated and validated using targeted proteomics. The inflammation signature was characterized by the presence of neutrophil-derived proteins, such as S100A8/9 (calprotectin) and myeloperoxidase, whereas the calcification signature included fetuin-A, osteopontin, and gamma-carboxylated proteins. The proteomics data also revealed sex differences in atherosclerosis, with large-aggregating proteoglycans versican and aggrecan being more abundant in females and exhibiting an inverse correlation with estradiol levels. The integration of RNA-sequencing data attributed the inflammation signature predominantly to neutrophils and macrophages, and the calcification and sex signatures to smooth muscle cells, except for certain plasma proteins that were not expressed but retained in plaques, such as fetuin-A. Dimensionality reduction and machine learning techniques were applied to identify 4 distinct plaque phenotypes based on proteomics data. A protein signature of 4 key proteins (calponin, protein C, serpin H1, and versican) predicted future cardiovascular mortality with an area under the curve of 75% and 67.5% in the discovery and validation cohort, respectively, surpassing the prognostic performance of imaging and histology.

Conclusions: Plaque proteomics redefined clinically relevant patient groups with distinct outcomes, identifying subgroups of male and female patients with elevated risk of future cardiovascular events.

Keywords: atherosclerosis; inflammation; machine learning; neutrophils; proteoglycans; proteomics; smooth muscle cells.


Conflict of interest statement

Disclosures S.W. van der Laan has received Roche funding for unrelated work. The other authors report no conflicts.

Figures

Figure 1.
Figure 1.
Proteomic signatures of the plaque core and periphery. A, Principal component analysis (PCA) visualization of the carotid plaque samples from both the core (red) and periphery (blue) of the plaque using the cellular proteome (sodium dodecyl sulfate [SDS] extract). B, Spatial RNA-sequencing (RNAseq): Three regional clusters (C1, C2, and C3) were revealed from spatial RNAseq of 2 carotid plaques. C1 and C2 corresponded to the protein changes identified in plaque periphery (blue) and core samples (red; Fisher exact test Q-value <0.05) and C3 corresponds to an intermediate position. There was agreement between proteomic and spatial RNA signatures (C1 vs C2) with Benjamini-Hochberg–corrected Q values for asymptomatic (asympt) cores vs C1: 1.98×10⁻⁵, asymptomatic core vs C3: 0.048, symptomatic (sympt) core vs C2: 8.84×10⁻⁴, periphery vs C1: 2.24×10⁻²⁶, core vs C2: 4.58×10⁻¹⁹. Linear color scale was used for Q values. C, Changes in the SDS extracts of the plaque cores according to cardiovascular risk factors, sex, symptoms, and calcification. Differential protein analysis was conducted using the Ebayes method of the limma package adjusted for age and sex. Scatterplots show the nominal P values. Blue boxes depict the number of proteins with nominal P<0.05 in each comparison (out of 1459 consistently quantified proteins in the SDS fraction). D, Pathway enrichment analysis of significantly dysregulated proteins (SDS: core vs periphery). The total quantified proteins were used as background in the enrichment analysis. Linear color scale was used for Q values. ECM indicates extracellular matrix. IGF indicates insulin-like growth factor.
Figure 2.
Figure 2.
Extracellular protein changes in calcified and symptomatic plaques. A and B, Volcano plots of significantly dysregulated proteins in the calcified (n=60) vs noncalcified (n=46) core plaque comparison for soluble (NaCl; A) and core (GuHCl; B) matrisome extracts with 283 and 286 consistently quantified extracellular proteins, respectively. Proteins significant in both calcified vs noncalcified and symptomatic vs asymptomatic comparisons are labeled in bold. C, Heatmap displays the log2 fold changes (FC) between calcified (n=11) and fibroatheroma (n=9) plaques and nominal P values from the RNA-sequencing data set GSE104140 for the corresponding transcripts of proteins significantly changing in both calcified vs noncalcified and symptomatic vs asymptomatic comparisons. D and E, Volcano plots of significantly dysregulated proteins in the symptomatic (n=36) vs asymptomatic (n=69) comparisons of the plaque cores for the soluble matrisome (NaCl; D) and the core (GuHCl; E) matrisome extracts with 283 and 286 consistently quantified extracellular proteins, respectively. F, Heatmap displays the log2 FC between unstable (n=4) and stable (n=4) carotid plaques and nominal P values from the RNAseq experiment GSE120521 for the corresponding transcripts of proteins significantly changing in both symptomatic vs asymptomatic and calcified vs noncalcified comparisons. Differential protein analysis was conducted using the Ebayes method of the limma package correcting for age, sex, and statins. Differential expression analysis for RNAseq data was performed without corrections. Proteins with 0.01≤P<0.05, 0.001≤P<0.01, and P<0.001 are highlighted in green, orange, and red colors, respectively. Nominal P values are displayed in volcano plots. P values with multiple testing correction are provided in Summary Results and Statistics of the TMT Proteomics Using the NaCl Extract and Summary Results and Statistics of the TMT Proteomics Using the GuHCl Extract in the Supplemental Material. Log2FC indicates base 2 logarithm of fold change. Protein and gene names are denoted with Uniprot IDs.
Figure 3.
Figure 3.
Validation by targeted proteomics. A, Forest plot depicting log2 fold changes (FC) and nominal P values of proteins validated by targeted proteomics in symptomatic (n=34) vs asymptomatic (n=64) core plaques. B, Spearman correlations of these proteins with the first principal component (PC) of cell clusters from our network analysis of intracellular proteins (Figure S5). C, Forest plot depicting log2 FC and nominal P values of proteins validated by targeted proteomics that were upregulated proteins in calcified (n=56) vs noncalcified (n=42) core plaques using targeted proteomics. D, Spearman correlations of these proteins with the first PC of cell clusters from our network analysis of intracellular proteins. Significant correlations are displayed with P<0.05 after Benjamini-Hochberg correction for multiple testing. CD14+ denotes CD14+ monocytes and cathepsin cluster. Differential protein analysis was conducted using the Ebayes method of the limma package correcting for age, sex, and statins. P values with multiple testing correction are provided in Summary Results and Statistics of the PRM Targeted Proteomics Analysis Using the GuHCl Extract in the Supplemental Material. BGH3 indicates transforming growth factor-beta-induced protein ig-h3; CATB, cathepsin B; CATD, cathepsin D; CD14, monocyte differentiation antigen CD14; CERU, ceruloplasmin; CO1A1, collagen alpha-1(I) chain; CO1A2, Collagen alpha-2(I) chain; CO3A1, Collagen alpha-1(III) chain; CO4A2, Collagen alpha-2(IV) chain; CO5A2, Collagen alpha-2(V) chain; COCA1, Collagen alpha-1(XII) chain; DEF1, neutrophil defensin 1; ECM1, extracellular matrix protein 1; FA9, coagulation factor IX; FA10, coagulation factor X; FETUA, fetuin-A; FINC, fibronectin; IBP5, insulin-like growth factor binding protein 5; LAMC1, Laminin subunit gamma-1; Log2FC, base 2 logarithm of fold change; MGP, matrix Gla protein; MΦ, monocytes/macrophages; Neutros, neutrophils; OSTP, osteopontin; PERM, myeloperoxidase; PRELP, prolargin; POSTN, periostin; SERPH, serpin H1; SMC, smooth muscle cell; TENA, tenascin; and TIMP1, metalloproteinase inhibitor 1.
Figure 4.
Figure 4.
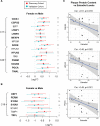
Sex differences and their associations with calcification and inflammation. Circular heatmap, showing the results of differential protein analysis for the soluble (NaCl; A) and core (GuHCl; B) matrisome extracts of plaque cores in 3 comparisons with 283 and 286 consistently quantified extracellular proteins, respectively (1) female (n=29) vs male (n=76) patients; (2) calcified (n=60) vs noncalcified (n=46) plaques and (3) symptomatic (n=69) vs asymptomatic (n=36) plaques. Differential protein analysis was conducted using the Ebayes method of the limma package correcting for age, sex, and statins (age and statins only for the sex comparison). The proteins are arranged in a circular graph based on the reconstructed matrisome and hierarchical clustering. Clusters enriched for dysregulated proteins in the sex comparison are marked with an asterisk (Fisher exact test, Benjamini-Hochberg–corrected for multiple testing P<0.05). P values with multiple testing corrections are provided in Summary Results and Statistics of the TMT Proteomics Using the NaCl Extract and Summary Results and Statistics of the TMT Proteomics Using the GuHCl Extract in the Supplemental Material. Protein names are denoted with Uniprot IDs.
Figure 5.
Figure 5.
Validation of sex-associated matrisome changes in the Athero-Express biobank. Forest plot depicting log2 fold changes (FC), 95% CIs, and P values (Benjamini-Hochberg [BH] corrected for multiple testing) for the comparison between plaque cores of male and female patients in the core matrisome extract (GuHCl). The discovery cohort had 32 female vs 88 male patients. The validation cohort had 49 female vs 151 male patients. A, Proteins from the sex-associated matrisome clusters C17 and C20 (see Figure 4). B, Proteins from the inflammation signature from cluster C19 (see Figure 4). Proteins that were significantly changing between female and male patients in both cohorts appear in bold. Differential protein analysis for both cohorts was conducted using the Ebayes method of the limma package correcting for age and statins. *0.01≤P<0.05, **0.001≤P<0.01, and ***P<0.001. C, Association of 3 sex-associated matrisome proteins with serum estradiol measurements in the Athero-Express Biobank study. COIA1 indicates collagen alpha-1(XVIII) chain; CSPG2, versican; DEF1, neutrophil defensin 1; HPLN1, hyaluronan and proteoglycan link protein 1; HPLN3, hyaluronan and proteoglycan link protein 3; IBP5, insulin-like growth factor binding protein 5; IBP7, insulin-like growth factor-binding protein 7; ITA8, Integrin alpha-8; Log2FC, base 2 logarithm of fold change; LTBP1, latent-transforming growth factor beta-binding protein 1; LTBP2, latent-transforming growth factor beta-binding protein 2; MFAP4, microfibril-associated glycoprotein 4; MFGM, lactadherin; PERM, myeloperoxidase; PGBM, basement membrane-specific heparan sulfate proteoglycan core protein; PGCA, aggrecan; SCUB3, signal peptide, CUB and EGF-like domain-containing protein 3; SODE, extracellular superoxide dismutase; S10A8, protein S100-A8; S10A9, protein S100-A9; S10AC, protein S100-A12; TIMP1, metalloproteinase inhibitor 1; and TRFL, lactotransferrin.
Figure 6.
Figure 6.
Integration with spatial and single-cell RNA-sequencing (scRNAseq). A, Spatial RNAseq: Feature heatmaps of expression levels using Loupe Browser. Selected genes included smooth muscle cell (SMC; ACTA [aortic smooth muscle actin]) and macrophage (CD14 [monocyte differentiation antigen CD14]) markers and significantly changing extracellular proteins in discovery proteomics, including CSPG2 (versican), CD44 (hyaluronan receptor), MGP (matrix Gla protein), CATB (cathepsin B), FA10 (coagulation factor X), and OSTP (osteopontin). The expression levels of each cell from 2 plaques are shown using a yellow-to-red color scale. B, ScRNAseq: Unifold Manifold Approximation (UMAP) feature plots for selected cell markers (ACTA, CD14) and matrisome proteins are shown in the integrated scRNAseq data sets. Relative expression levels of each gene were calculated for spatial and scRNAseq data by dividing the read count of each cell/position by the total reads for that cell/position, multiplying with the Seurat scale factor, and performing natural logarithmic transformation. EC indicates endothelial cells.
Figure 7.
Figure 7.
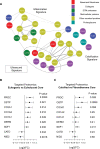
Ultrasound classification vs calcification and inflammation signatures. A, Part of the reconstructed matrisome network from the discovery cohort. Nodes include validated significant changes of extracellular proteins in symptomatic vs asymptomatic, calcified vs noncalcified, or echogenic vs echolucent comparisons. Nodes are colored based on the functional category of each protein. The line thickness is proportional to the conditional mutual information between the 2 proteins. Double lines represent experimentally verified protein-protein interactions. B, Forest plot depicting log2 fold changes (FC) with significant nominal P values in targeted proteomics (135 extracellular proteins in total) in the comparison of echogenic (n=43) vs echolucent (n=28) plaque cores. C, Forest plot depicting the log2 FC with nominal P values targeted proteomics (135 extracellular proteins in total) in the comparison of calcified (n=10) vs fibroatheroma (n=19) plaque cores based on the histological characterization of the validated ultrasound signature. Differential expression analysis was conducted using the Ebayes method of the limma package correcting for age, sex, and statins. CATD indicates cathepsin D; DERM, dermatopontin; ECM1, extracellular matrix protein 1; FETUA, fetuin-A; IBP5, insulin-like growth factor binding protein 5; Log2(FC), base 2 logarithm of fold change; OSTP, osteopontin; POSTN, periostin; SDF, stromal cell-derived factor; and SERPH, serpin H1.
Figure 8.
Figure 8.
Molecular plaque phenotypes and cardiovascular outcomes. A, Representation of the plaque cores using principal component analysis (PCA) and their clustering using KMEANS. Rectangles represent cases with a primary cardiovascular end point over a 9-year follow-up. B, Top-5 proteins upregulated in each cluster using one-versus-all clusters differential expression analysis with the Ebayes method of the limma package (P values corrected for multiple testing). C, Kaplan-Meier plot for the survival analysis of patients with the 4 distinct molecular plaque phenotypes based on the primary composite cardiovascular end point. D, Correlation of the proteomics clusters against demographics, imaging, and histological characteristics. Point-biserial correlation was used for binary features and Spearman correlation for continuous ones. Significant correlations are displayed with P<0.05 after BH correction for multiple testing. ACTA indicates aortic smooth muscle actin; CALD1, caldesmon; CD14, monocyte differentiation antigen CD14; CNN1, calponin-1; CSPG2, versican; C163A, scavenger receptor cysteine-rich type 1 protein M130 ; DEF1, neutrophil defensin 1; DERM, dermatopontin; FA10, coagulation factor X; FETUA, fetuin-A; IBP5, insulin-like growth factor binding protein 5; ITA2B, integrin alpha IIB; logFC, base 2 logarithm of fold change; MGP, matrix Gla protein; PERM, myeloperoxidase; POSTN, periostin; PTPRC, receptor-type tyrosine-protein phosphatase C; PROC, vitamin K-dependent protein C; SMC, smooth muscle cells; S10A8, protein S100-A8; S10A9, protein S100-A9; TAGLN, transgelin; and TIMP1, metalloproteinase inhibitor 1.

References

    1. Williams KJ, Tabas I. The response-to-retention hypothesis of early atherogenesis. Arterioscler Thromb Vasc Biol. 1995;15:551–561. doi: 10.1161/01.atv.15.5.551 - PMC - PubMed
    1. Holm Nielsen S, Jonasson L, Kalogeropoulos K, Karsdal MA, Reese-Petersen AL, auf dem Keller U, Genovese F, Nilsson J, Goncalves I. Exploring the role of extracellular matrix proteins to develop biomarkers of plaque vulnerability and outcome. J Inter Med. 2020;287:493–513. doi: 10.1111/JOIM.13034 - PubMed
    1. Naba A, Clauser KR, Ding H, Whittaker CA, Carr SA, Hynes RO. The extracellular matrix: tools and insights for the “omics” era. Matrix Biol. 2016;49:10–24. doi: 10.1016/j.matbio.2015.06.003 - PMC - PubMed
    1. Cai JM, Hatsukami TS, Ferguson MS, Small R, Polissar NL, Yuan C. Classification of human carotid atherosclerotic lesions with in vivo multicontrast magnetic resonance imaging. Circulation. 2002;106:1368–1373. doi: 10.1161/01.cir.0000028591.44554.f9 - PubMed
    1. Libby P, Ridker PM, Hansson GK. Progress and challenges in translating the biology of atherosclerosis. Nature. 2011;473:317–325. doi: 10.1038/nature10146 - PubMed

Publication types