. 2023 Jan-Dec:17:17534666231186726.
doi: 10.1177/17534666231186726.

The perfect storm: temporal analysis of air during the world's most deadly epidemic thunderstorm asthma (ETSA) event in Melbourne

Affiliations

The perfect storm: temporal analysis of air during the world's most deadly epidemic thunderstorm asthma (ETSA) event in Melbourne

Dwan Price et al. Ther Adv Respir Dis. 2023 Jan-Dec.

Abstract

Background: There have been 26 epidemic thunderstorm asthma (ETSA) events worldwide, with Melbourne at the epicentre of ETSA with 7 recorded events, and in 2016 experienced the deadliest ETSA event ever recorded. Health services and emergency departments were overwhelmed with thousands requiring medical care for acute asthma and 10 people died.

Objectives: This multidisciplinary study was conducted across various health and science departments with the aim of improving our collective understanding of the mechanism behind ETSA.

Design: This study involved time-resolved analysis of atmospheric sampling of the air for pollen and fungal spores, and intact and ruptured pollen compared with different weather parameters, pollution levels and clinical asthma presentations.

Methods: Time-resolved pollen and fungal spore data collected by Deakin AirWATCH Burwood, underwent 3-h analysis, to better reflect the 'before', 'during' and 'after' ETSA time points, on the days leading up to and following the Melbourne 2016 event. Linear correlations were conducted with atmospheric pollution data provided by the Environment Protection Authority (EPA) of Victoria, weather data sourced from Bureau of Meteorology (BOM) and clinical asthma presentation data from the Victorian Agency for Health Information (VAHI) of Department of Health.

Results: Counts of ruptured grass pollen grains increased 250% when the thunderstorm outflow reached Burwood. Increased PM10, high relative humidity, decreased temperature and low ozone concentrations observed in the storm outflow were correlated with increased levels of ruptured grass pollen. In particular, high ozone levels observed 6 h prior to this ETSA event may be a critical early indicator of impending ETSA event, since high ozone levels have been linked to increasing pollen allergen content and reducing pollen integrity, which may in turn contribute to enhanced pollen rupture.

Conclusion: The findings presented in this article highlight the importance of including ruptured pollen and time-resolved analysis to forecast ETSA events and thus save lives.

Keywords: allergic asthma; environmental health; epidemic thunderstorm asthma; grass pollen allergy; pollen rupture; public health; thunderstorm asthma.


Conflict of interest statement

The authors declared no potential conflicts of interest with respect to the research, authorship, and/or publication of this article.

Figures

Figure 1.
Figure 1.
Thunderstorm asthma. The proposed mechanism of pollen transport and rupturing during a thunderstorm asthma event. It is proposed that grass pollen grains are picked up and carried into the clouds where they rupture due to low temperature and high humidity, following high ozone levels (findings of this study), releasing highly allergenic micronic particles (1). Outflows dump these highly allergenic micronic particles at the ground level, which are concentrated further by our hypothesised vortex action as it travels towards the unsuspecting susceptible population (2).
Figure 2.
Figure 2.
Daily total grass and fungal spore concentrations for the days prior to and after the Melbourne 21 November 2016 ETSA event. Daily atmospheric pollen and fungal spores collected on an adhesive tape via a Burkard pollen and spore trap and identified via microscopy. Individual grass pollen grains (intact and ruptured) and fungal spores (yeasts or other) expressed as grains/spores per m3 of air. ETSA, epidemic thunderstorm asthma.
Figure 3.
Figure 3.
Time-resolved analysis of airborne pollen concentrations during a significant ETSA event: (a) Adhesive tape collected by the Deakin AirWATCH Burwood pollen monitoring site containing the atmospheric particles from 3 p.m. 20 November to 3 a.m. 22 November. Atmospheric pollen levels during this time period are depicted in (b) as 3-h time points, as well as averages over the entire 36-h (i.e. 12× 3-h) period. Time points flagged within the tape (i, ii, iii, iv) indicate the changes in atmospheric particles during the ETSA event. These time points are depicted in visual detail by representative light micrographs shown in Ci-iv. Specifically, image of particles trapped and collected by the Burkhard sampler at 4 p.m. AEDT on 21 November 2016 used to visualise intact grass pollen (A), Cladosporium (C) and smut (fungal) teliospores (S) (ci). Image of samples trapped and collected during the peak 6 p.m. AEDT in atmospheric particles correlating with the storm outflow. Ruptured grass pollen (double arrows ↑↑) and intact grass pollen grains (single arrow ↑) (cii). Microscope image of atmospheric particles and fungal spores collected just after 7 p.m. showing smut teliospores (S) among unidentifiable debris (ciii). Microscope image of air sample just after 8 p.m. Leptosphaeria ascospores (single arrow ↑), algal cells (green) and yeast-like conidia (double arrows ↑↑) (civ). ETSA, epidemic thunderstorm asthma.
Figure 4.
Figure 4.
Asthma presentation to emergency departments during the 21 November 2016 ETSA event. Time-resolved 3-h total asthma presentations and airborne pollen levels just prior (3–4 p.m.), during (6–9 p.m.) and after (9–12 a.m.) the thunderstorm (a). A time delay of 3-h was used for the asthma presentations, to coincide with the 3-h pollen data. Geographical location of hospitals (1: Royal Melbourne Hospital, 2: Austin Hospital, 3: Box Hill Hospital, 4: Maroondah Hospital, 5: Monash Medical Centre) and storm direction (b), and time-resolved 3-h total asthma presentations of 5 Melbourne hospitals during the 21 November ETSA event (c). Daily asthma presentations, by hospital for the 3 days prior and 6 days after the ETSA event (d). ETSA, epidemic thunderstorm asthma.
Figure 5.
Figure 5.
Time-resolved pollen and weather conditions. Time-resolved 3-h analysis of total intact grass pollen, ruptured grass pollen and other pollen alongside various weather conditions (mean ± SD), relative humidity in % (a), air temperature in °C (b), dew point in °C (c) and precipitation in mm (d).
Figure 6.
Figure 6.
Time-resolved pollen and environmental pollutants. Time-resolved 3-h analysis of total intact grass pollen, ruptured grass pollen and other pollen alongside various environmental conditions (mean ± SD), including Pm10 in μg/m3 (a), API (b), ozone in parts per billion (ppb) (c) and nitrogen dioxide (NO2) in ppb (d). API, Air Pollution Index.
Figure 7.
Figure 7.
Year on year comparison. For comparison, the day with the highest PM10 in November was selected for comparison to the 21 November 2016 ETSA event, to discount high PM10 as the sole contributor of asthma presentations to the emergency departments. Daily total PM10 (μg/m3), percent of ruptured or intact grass pollen, total asthma presentations as well as the presence of storm activity for the 21 November 2016 and comparative high PM10 days: 14 November 2017, 2 November 2018 and 21 November 2019. It should be noted that 232 asthma presentations on 21 November 2016 was only for that specific day. In addition, there were 449 hospital admissions in the 3 days following the 21 November ETSA event. ETSA, epidemic thunderstorm asthma.
Figure 8.
Figure 8.
Grass rupturing under specific weather conditions. Relationship between grass rupturing ratio (ruptured grass/total grass) and various weather parameters, including dew point (a), air temperature in °C (b), precipitation in mm (c), air pressure in Pa (d) and relative humidity % (e). Pearson’s (r) and significance (p) for each parameter shown, respectively.
Figure 9.
Figure 9.
Grass rupturing in the presence of environmental pollutants. Relationship between grass rupturing ratio (ruptured grass/total grass) and various environmental conditions, including PM10 in μg/m3 (a), API (b), ozone in ppb (c) and nitrogen dioxide in ppb (d). Pearson’s (r) and significance (p) for each parameter shown, respectively. API, Air Pollution Index.
Figure 10.
Figure 10.
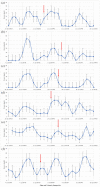
Time-resolved ozone levels in previous ETSA events in Melbourne. Time-resolved 3-h (mean ± SD) ozone levels (in ppb) for the hours prior to and after the previous six recorded ETSA events [3] on 11 November 1984 (a), 8 November 1987 (b), 29 November 1989 (c), 19 November 2003 (d), 25 November 2010 (e) and 8 November 2011 (f). Arrows indicate the reported arrival of the ETSA event with sudden increase in acute asthma presentations. ETSA, epidemic thunderstorm asthma.

References

    1. Thien F, Beggs PJ, Csutoros D, et al.. The Melbourne epidemic thunderstorm asthma event 2016: an investigation of environmental triggers, effect on health services, and patient risk factors. Lancet Planet Health 2018; 2: e255–e263. - PubMed
    1. Suphioglu C. Thunderstorm asthma due to grass pollen. Int Arch Allergy Immunol 1998; 116: 253–260. - PubMed
    1. Price D, Hughes KM, Thien F, et al.. Epidemic thunderstorm asthma: lessons learned from the storm down-under. J Aller Clin Immunol 2021; 9: 1510–1515. - PubMed
    1. Hew M, Lee J, Susanto NH, et al.. The 2016 Melbourne thunderstorm asthma epidemic: risk factors for severe attacks requiring hospital admission. Allergy 2019; 74: 122–130. - PubMed
    1. D’Amato G, Cecchi L, Liccardi G. Thunderstorm-related asthma: not only grass pollen and spores. J Allergy Clin Immunol 2008; 121: 537–538; author reply 538. - PubMed