. 2023 Sep 12;57(36):13463-13472.
doi: 10.1021/acs.est.3c02175. Epub 2023 Aug 30.

Hydrophilic Species Are the Most Biodegradable Components of Freshwater Dissolved Organic Matter

Affiliations

Hydrophilic Species Are the Most Biodegradable Components of Freshwater Dissolved Organic Matter

Charlotte Grasset et al. Environ Sci Technol. .

Abstract

Aquatic dissolved organic matter (DOM) is a crucial component of the global carbon cycle, and the extent to which DOM escapes mineralization is important for the transport of organic carbon from the continents to the ocean. DOM persistence strongly depends on its molecular properties, but little is known about which specific properties cause the continuum in reactivity among different dissolved molecules. We investigated how DOM fractions, separated according to their hydrophobicity, differ in biodegradability across three different inland water systems. We found a strong negative relationship between hydrophobicity and biodegradability, consistent for the three systems. The most hydrophilic fraction was poorly recovered by solid-phase extraction (SPE) (3-28% DOC recovery) and was thus selectively missed by mass spectrometry analysis during SPE. The change in DOM composition after incubation was very low according to SPE-ESI (electrospray ionization)-mass spectrometry (14% change, while replicates had 11% change), revealing that this method is sub-optimal to assess DOM biodegradability, regardless of fraction hydrophobicity. Our results demonstrate that SPE-ESI mass spectrometry does not detect the most hydrophilic and most biodegradable species. Hence, they question our current understanding of the relationships between DOM biodegradability and its molecular composition, which is built on the use of this method.

Keywords: biodegradability; dissolved organic matter; electrospray ionization; freshwater; mass spectrometry.


Conflict of interest statement

The authors declare no competing financial interest.

Figures
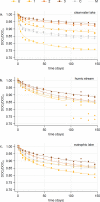
Figure 1
Figure 1
Measured (dots) fraction of remaining DOC (DOCt/DOC0, unitless) over time and reactivity continuum model (lines). U, 1, 2, and 3 are the DOM fractions of increasing hydrophobicity, U is the unretained and most hydrophilic fraction, and 3 is the most hydrophobic fraction. C is the recombination of U, 1, 2, and 3 in their original abundances. M is the theoretical remaining DOC of the recombined fractions, calculated assuming an additive effect.
Figure 2
Figure 2
Correlation between the hydrophobicity of the different fractions (U, 1, 2, and 3), assessed by the weighted average proportion of the strong mobile phase used on the C18 column (CH3CN) to elute the fraction, and the initial decay constant (log k0). The hydrophobicity of the fractions increases with the eluent concentration; the concentration of the eluent was set to 0 for the most hydrophilic fraction, which was not retained by the column. The Spearman correlation coefficient was r = −0.915 (p-value = 2.9 × 10⁻⁵).
Figure 3
Figure 3
Differences in DOM composition between the samples (U, 1, 2, 3, and C) of the three sites and before/after incubation, as assessed by high-resolution MS. PCoA plot of the different samples in the three sites before and after incubation (a) and correlations between the first (b) and second (c) PCoA axes and the abundance of the individual molecular formulae (n = 3695 for PCoA1 and n = 1772 for PCoA2). In (b,c) the color scale indicates the significant Spearman correlations (|r| > 0.334 for p-value < 0.01 and n = 59 samples), and each molecular formula is represented by one dot according to its H/C vs O/C ratio.
Figure 4
Figure 4
Percentage of DOC recovery after SPE efficiency in (%) for each sample “U” unretained and most hydrophilic fraction, 1–3 retained fractions of increasing hydrophobicity, and C all fractions recombined in their original abundances.

References

    1. Bastviken D.; Tranvik L. J.; Downing J. A.; Crill P. M.; Enrich-Prast A. Freshwater Methane Emissions Offset the Continental Carbon Sink. Science 2011, 331, 50.10.1126/science.1196808. - DOI - PubMed
    1. Raymond P. A.; Hartmann J.; Lauerwald R.; Sobek S.; McDonald C.; Hoover M.; Butman D.; Striegl R.; Mayorga E.; Humborg C.; Kortelainen P.; Durr H.; Meybeck M.; Ciais P.; Guth P. Global carbon dioxide emissions from inland waters. Nature 2013, 503, 355–359. 10.1038/nature12760. - DOI - PubMed
    1. Regnier P.; Resplandy L.; Najjar R. G.; Ciais P. The land-to-ocean loops of the global carbon cycle. Nature 2022, 603, 401–410. 10.1038/s41586-021-04339-9. - DOI - PubMed
    1. Cole J. J.; Prairie Y. T.; Caraco N. F.; McDowell W. H.; Tranvik L. J.; Striegl R. G.; Duarte C. M.; Kortelainen P.; Downing J. A.; Middelburg J. J.; Melack J. Plumbing the Global Carbon Cycle: Integrating Inland Waters into the Terrestrial Carbon Budget. Ecosystems 2007, 10, 172–185. 10.1007/s10021-006-9013-8. - DOI
    1. Sobek S.; Algesten G.; Bergström A.-K.; Jansson M.; Tranvik L. J. The catchment and climate regulation of pCO2 in boreal lakes. Global Change Biol. 2003, 9, 630–641. 10.1046/j.1365-2486.2003.00619.x. - DOI

Publication types