

Temporal and spatial distribution of polio vaccine coverage in Brazil between 1997 and 2021
- PMID: 37646734
- PMCID: PMC10470251
- DOI: 10.1590/1980-549720230037
Temporal and spatial distribution of polio vaccine coverage in Brazil between 1997 and 2021
Erratum in
-
ERRATUM.Rev Bras Epidemiol. 2023 Oct 27;26:e20230037erratum.1. doi: 10.1590/1980-549720230037erratum.1. Rev Bras Epidemiol. 2023. PMID: 37909631 Free PMC article.
Abstract
Objective: To analyze the temporal and spatial distribution of polio vaccine coverage in Brazilian states.
Methods: An ecological time series study was conducted using data from the National Immunization Program Information System. The analyzed period was from 1997 to 2021. Joinpoint software was used to calculate the annual percentage change and average annual percentage change through regressions. QGIS 3.10.7 software was used to construct thematic maps. GeoDa 1.20.0.10 software was used to estimate spatial autocorrelation using the Global Moran's Index and Local Moran's Index.
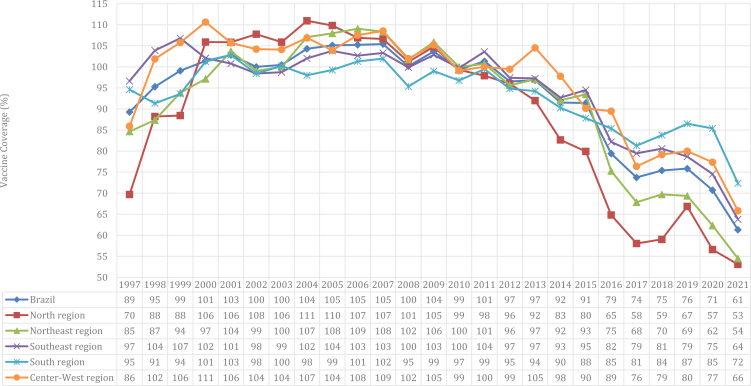
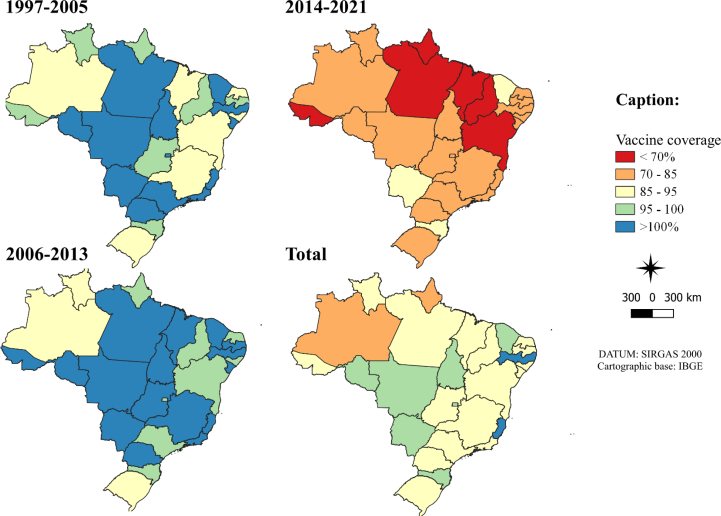
Results: National vaccine coverage in 1997 was 89.27%, decreasing to 61.32% in 2021. The trend analysis indicated an average annual decrease of 1.5% in polio vaccine coverage in Brazil. Across the country, 17 states showed a statistically significant reduction in the average annual percentage change rate. The highest average reduction rates in vaccine coverage among Brazilian states were observed in Amapá (-3.7%; 95%CI -6.0; -1.4) and Pernambuco (-3.3%; 95%CI -4.0; -2.5). In the spatial analysis, in Moran Global, a positive autocorrelation was identified in the years 2012 to 2021 (p<0.02), with an index value of 0.361, which means that geographically close areas tended to have similar levels of vaccination coverage.
Conclusion: There was significant heterogeneity in coverage among states and a strong decrease trend in vaccination rates, which could facilitate the circulation of the poliovirus and pose a threat to the susceptible population.
Objetivo:: Analisar a distribuição temporal e espacial da cobertura da vacina contra poliomielite nos estados brasileiros.
Métodos:: Estudo ecológico de séries temporais, cuja fonte de dados foi o Sistema de Informação do Programa Nacional de Imunizações. O período analisado foi de 1997 a 2021. Utilizou-se o software Joinpoint para calcular a variação percentual anual e variação percentual anual média por meio de regressões. Para construção de mapas temáticos foi utilizado o software QGis 3.10.7. Para estimar a autocorrelação espacial com o Índice de Moran Global e Índice de Moran Local foi utilizado o software GeoDa 1.20.0.10.
Resultados:: A cobertura vacinal nacional em 1997 foi de 89,27%, passando para 61,32% em 2021. A análise de tendência apontou o decréscimo médio de 1,5% ao ano na cobertura da vacina contra poliomielite no Brasil. Em todo o país, 17 estados apresentaram redução estatisticamente significativa na taxa de variação percentual anual média. As maiores taxas médias de redução da cobertura vacinal entre os estados brasileiros foram observadas no Amapá (−3,7%; IC95% −6,0; −1,4) e em Pernambuco (−3,3%; IC95% −4,0; −2,5). Na análise espacial, no Moran Global, foi identificada autocorrelação positiva nos anos de 2012 a 2021 (p<0,02), com valor de índice de 0,361, o que significa que as áreas geograficamente próximas tenderam a ter níveis semelhantes de cobertura vacinal.
Conclusão:: Evidenciou-se expressiva heterogeneidade na cobertura entre os estados e forte tendência de queda dos índices, o que pode propiciar a circulação do poliovírus e colocar sob ameaça a população susceptível.
Conflict of interest statement
Figures
Similar articles
-
Temporal and spatial distribution trends of polio vaccine coverage in less than one-year old children in Brazil, 2011-2021.BMC Public Health. 2023 Jul 14;23(1):1359. doi: 10.1186/s12889-023-16192-8. BMC Public Health. 2023. PMID: 37452296 Free PMC article.
-
Vaccination coverage of triple viral and poliomyelitis in Brazil, 2011-2021: temporal trend and spatial dependency.Rev Bras Epidemiol. 2023 Oct 20;26:e230047. doi: 10.1590/1980-549720230047. eCollection 2023. Rev Bras Epidemiol. 2023. PMID: 37878834 Free PMC article.
-
Pentavalent and poliomyelitis vaccines: a review of the vaccination coverage in Brazilian children in the last 10 years.Arch Virol. 2024 Jan 4;169(1):17. doi: 10.1007/s00705-023-05939-8. Arch Virol. 2024. PMID: 38177876 Review.
-
Spatial analysis of vaccine coverage on the first year of life in the northeast of Brazil.BMC Public Health. 2022 Jun 16;22(1):1204. doi: 10.1186/s12889-022-13589-9. BMC Public Health. 2022. PMID: 35710366 Free PMC article.
-
Poliovirus vaccines. Progress toward global poliomyelitis eradication and changing routine immunization recommendations in the United States.Pediatr Clin North Am. 2000 Apr;47(2):287-308. doi: 10.1016/s0031-3955(05)70208-x. Pediatr Clin North Am. 2000. PMID: 10761505 Review.
Cited by
-
The global impact of non-alcoholic fatty liver disease (including cirrhosis) in the elderly from 1990 to 2021 and future projections of disease burden.PLoS One. 2025 Jun 25;20(6):e0325961. doi: 10.1371/journal.pone.0325961. eCollection 2025. PLoS One. 2025. PMID: 40560868 Free PMC article.
-
Parental vaccine hesitancy in Brazil: results from a household survey.Cad Saude Publica. 2025 Jul 21;41(7):e00195724. doi: 10.1590/0102-311XEN195724. eCollection 2025. Cad Saude Publica. 2025. PMID: 40699098 Free PMC article.
-
HIV prevalence among persons deprived of liberty in Brazil, 2017-2023: a time series analysis.Epidemiol Serv Saude. 2025 Jun 20;34:e20240493. doi: 10.1590/S2237-96222025v34e20240493.en. eCollection 2025. Epidemiol Serv Saude. 2025. PMID: 40561296 Free PMC article.
-
Vaccination coverage, barriers and vaccine hesitancy in children up to 24 months old: a population survey in a state capital in the Western Amazon.Epidemiol Serv Saude. 2024 Nov 1;33(spe2):e20231295. doi: 10.1590/S2237-96222024v33e20231295.especial2.en. eCollection 2024. Epidemiol Serv Saude. 2024. PMID: 39504080 Free PMC article.
-
Vaccination coverage and delay in vaccination of infants born in 2017 and 2018 in municipalities in the Southern region of Brazil: National Vaccination Coverage Survey 2020.Epidemiol Serv Saude. 2024 Oct 21;33(spe2):e20231206. doi: 10.1590/S2237-96222024v33e20231206.especial2.en. eCollection 2024. Epidemiol Serv Saude. 2024. PMID: 39442144 Free PMC article.
References
-
- World Health Organization Polio vaccines: WHO position paper – June 2022. Weekly Epidemiological Record. 2022;97(25):277–300.
-
- Franco MAE, Alves ACR, Gouvêa JCZ, Carvalho CCF, Miranda F, Filho, Lima AMS, et al. Causas da queda progressiva das taxas de vacinação da poliomielite no Brasil. Braz J Hea Rev. 2020;3(6):18476–18486. doi: 10.34119/bjhrv3n6-241. - DOI
-
- Risi JB., Junior . Poliomielite no Brasil: do reconhecimento da doença ao fim da transmissão. 1a ed. Rio de Janeiro: Editora Fiocruz; 2019.
-
- World Health Organization . The Polio endgame strategy 2019-2023: eradication, integration, containment and certification [Internet] 2019. [[cited on Nov 9, 2022]]. Available at: https://polioeradication.org/who-we-are/polio-endgame-strategy-2019-2023/
MeSH terms
LinkOut - more resources
Full Text Sources
Medical
