

Digital live imaging of intraoperative electrocochleography during cochlear implantation: the first 50 patients
- PMID: 37646794
- PMCID: PMC10858150
- DOI: 10.1007/s00405-023-08197-1
Digital live imaging of intraoperative electrocochleography during cochlear implantation: the first 50 patients
Abstract
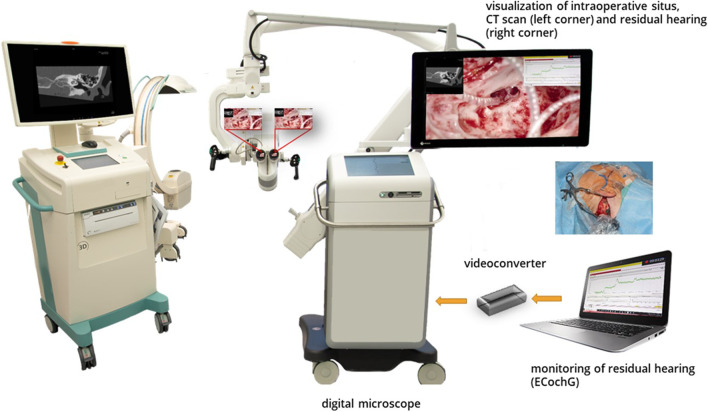
Introduction: Real-time visualization of intraoperative electrocochleography (ECochG) potentials via a digital microscope during cochlear implantation can provide direct feedback during electrode insertion. The aim of this prospective, randomized study of 50 patients was to obtain long-term data with a focus on residual hearing preservation and speech understanding.
Material and methods: Cochlear implantations were performed in 50 patients (26 female, 24 male) with residual hearing using a digital microscope. Patients were randomized into two groups. Intraoperative ECochG potentials were either displayed directly in the surgeon's field of view (picture-in-picture display, PiP) or not directly in the field of view (without picture-in-picture display, without PiP). Residual hearing preservation and speech comprehension were recorded within a 1-year follow-up period, compared between groups (PiP versus without PiP) and to a control group of 26 patients implanted without ECochG.
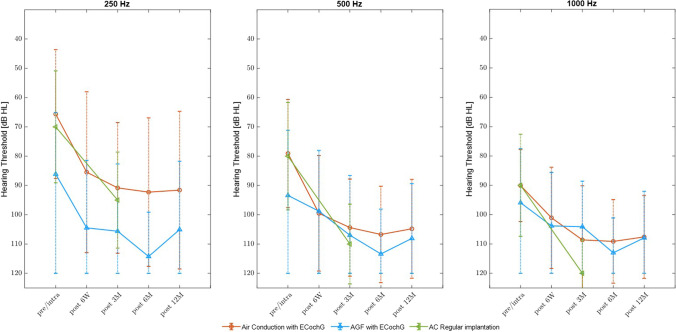
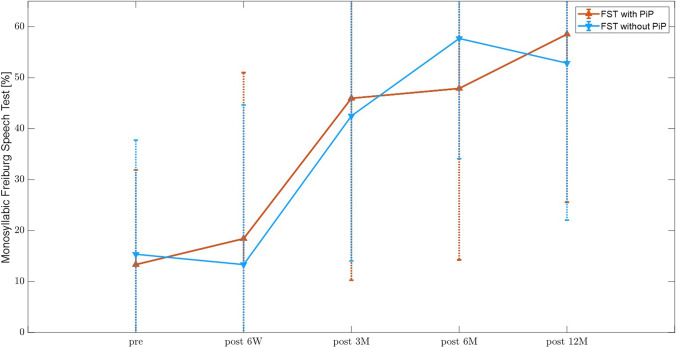
Results: Mean insertion time was significantly longer in the picture-in-picture group (p = 0.025). Residual hearing preservation after 6 weeks at 250 Hz was significantly better in the picture-in-picture group (p = 0.017). After one year, 76% of patients showed residual hearing in the picture-in-picture group (62% without picture-in-picture technique, p = n.s.). Use of the picture-in-picture technique resulted in better long-term pure tone residual hearing preservation at 250, 500, and 1000 Hz. Speech intelligibility improved by 46% in the picture-in-picture group (38% without picture-in-picture).
Discussion: This study is the first to describe long-term results in a large cohort of cochlear implant patients in whom digital visualization of intraoperative ECochG was used. Our results show that visualization of intraoperative ECochG has a positive effect on residual hearing preservation.
Keywords: Cochlear implantation; Digital microscopic imaging; Hearing preservation; Intraoperative electrocochleography.
© 2023. The Author(s).
Conflict of interest statement
This research was funded through a grant provided by Cochlear Research & Development Ltd under reference number IIR-2324.
Figures


Similar articles
-
Two different methods to digitally visualize continuous electrocochleography potentials during cochlear implantation: a first description of feasibility.Eur Arch Otorhinolaryngol. 2024 Jun;281(6):2913-2920. doi: 10.1007/s00405-023-08400-3. Epub 2024 Jan 3. Eur Arch Otorhinolaryngol. 2024. PMID: 38170210 Free PMC article.
-
Digital Live Imaging of Intraoperative Electrocochleography - First Description of Feasibility and Hearing Preservation During Cochlear Implantation.Otol Neurotol. 2021 Oct 1;42(9):1342-1346. doi: 10.1097/MAO.0000000000003256. Otol Neurotol. 2021. PMID: 34369444
-
Intraoperative Intracochlear Electrocochleography and Residual Hearing Preservation Outcomes When Using Two Types of Slim Electrode Arrays in Cochlear Implantation.Otol Neurotol. 2019 Jun;40(5S Suppl 1):S29-S37. doi: 10.1097/MAO.0000000000002212. Otol Neurotol. 2019. PMID: 31225820 Clinical Trial.
-
Bridging the gap: A systematic review of intraoperative electrocochleography during cochlear implantation and preservation of residual hearing.PLoS One. 2025 May 13;20(5):e0323493. doi: 10.1371/journal.pone.0323493. eCollection 2025. PLoS One. 2025. PMID: 40359384 Free PMC article.
-
[Application of extra- and intracochlear electrocochleography during and after cochlear implantation].HNO. 2025 Jan;73(1):14-21. doi: 10.1007/s00106-024-01481-4. Epub 2024 May 18. HNO. 2025. PMID: 38761228 Free PMC article. Review. German.
Cited by
-
Two different methods to digitally visualize continuous electrocochleography potentials during cochlear implantation: a first description of feasibility.Eur Arch Otorhinolaryngol. 2024 Jun;281(6):2913-2920. doi: 10.1007/s00405-023-08400-3. Epub 2024 Jan 3. Eur Arch Otorhinolaryngol. 2024. PMID: 38170210 Free PMC article.
References
-
- Buchsenschutz K, Arnolds J, Bagus H, et al. Surgical risk profile and audiological outcome in the elderly after cochlea-implantation. Laryngorhinootologie. 2015;94(10):670–675. - PubMed
Publication types
MeSH terms
Grants and funding
LinkOut - more resources
Full Text Sources
Medical
Miscellaneous
