. 2023 Aug 30;19(8):e1011359.
doi: 10.1371/journal.pcbi.1011359. eCollection 2023 Aug.

Steady-state approximations for Hodgkin-Huxley cell models: Reduction of order for uterine smooth muscle cell model

Affiliations

Steady-state approximations for Hodgkin-Huxley cell models: Reduction of order for uterine smooth muscle cell model

Shawn A Means et al. PLoS Comput Biol. .

Abstract

Multi-scale mathematical bioelectrical models of organs such as the uterus, stomach or heart present challenges both for accuracy and computational tractability. These multi-scale models are typically founded on models of biological cells derived from the classic Hodkgin-Huxley (HH) formalism. Ion channel behaviour is tracked with dynamical variables representing activation or inactivation of currents that relax to steady-state dependencies on cellular membrane voltage. Timescales for relaxation may be orders of magnitude faster than companion ion channel variables or phenomena of physiological interest for the entire cell (such as bursting sequences of action potentials) or the entire organ (such as electromechanical coordination). Exploiting these time scales with steady-state approximations for relatively fast-acting systems is a well-known but often overlooked approach as evidenced by recent published models. We thus investigate feasibility of an extensive reduction of order for an HH-type cell model with steady-state approximations to the full dynamical activation and inactivation ion channel variables. Our effort utilises a published comprehensive uterine smooth muscle cell model that encompasses 19 ordinary differential equations and 105 formulations overall. The numerous ion channel submodels in the published model exhibit relaxation times ranging from order 10-1 to 105 milliseconds. Substitution of the faster dynamic variables with steady-state formulations demonstrates both an accurate reproduction of the full model and substantial improvements in time-to-solve, for test cases performed. Our demonstration here of an effective and relatively straightforward reduction method underlines the particular importance of considering time scales for model simplification before embarking on large-scale computations or parameter sweeps. As a preliminary complement to more intensive reduction of order methods such as parameter sensitivity and bifurcation analysis, this approach can rapidly and accurately improve computational tractability for challenging multi-scale organ modelling efforts.


Conflict of interest statement

The authors have declared that no competing interests exist.

Figures
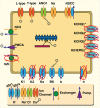
Fig 1
Fig 1. Schematic of Full Tong uSMC Model (FTM).
All ion channel, exchanger and pump mechanisms of the 2011 model are presented, with the later added mechanisms of the 2014 version designated as shown. Note, only Ca2+ion concentrations dynamically vary in the Tong models; Na+, K+ and Cl are held fixed throughout. Ca2+concentrations modulate channel behaviour for the Cl (ANO1) and the K+ (BK) as well as the contractile force generating submodel illustrated in the centre. Mechanisms excluded from our final Reduced Tong Model (RTM) are noted with red crossouts.
Fig 2
Fig 2. Relaxation time scales ion channel submodels.
Panel (A). Suite of τ values as given for the RTM family of ion channels and the corresponding activation and inactivation variables. Note extraordinary range on logarithmic scale over six orders of magnitude from 10−1 milliseconds for the BK-channel xb variable (teal trace) to as high as 100 seconds for the K+ channel variable r1 (dashed black trace). Each variation over Vm are computed from the functional dependencies as given in the FTM, and selected channels in the RTM version appear here as described in text. The rough threshold for consideration of steady-state approximation partitioning the suite of these variables is at 10 ms (open circles), that is also sensitive to the range of Vm encountered during simulation. Panel (B). Corresponding suite of τ values for the FTM but excluded mechanisms from the final RTM. Note extraordinary range of time scales but shifted up around two orders of magnitude compared with the RTM suite.
Fig 3
Fig 3. K+ current inactivation.
(Panel A) Disabling Ka current. FTM result with identical test protocol to the SSP reproduced by the CellML implementation (blue trace). Both [Ca2+]i and Vm (upper and lower Panes, respectively; note varying time scales) display similarity to FTM with Ka disabled and no modifications otherwise (black trace). Altered conductances for K1 and INa of 0.598 and 0.07 nS/pF, respectively, along with increased fraction of free (unbuffered) Ca2+ by 2.5% (β = 0.0154) presents improved qualitative fit to FTM (red trace, dotted). (Panel B) Disabling K2, Ka and h utilising the SSP as in Panel A. Disabling only K2 (black trace), exhibits significant rise in [Ca2+]i (upper pane), and truncated APs settling into elevated plateau Vm (lower pane) compared to FTM result (blue trace). Disabling K2, Ka and h shows similar behaviour (red trace). Alterations to K1 and INa of 0.655 and 0.05125 nS/pF, respectively, with β = 0.0146 improve qualitative fit to FTM (pilot-RTM, orange dotted). Experimental trace adapted from Tong, 2011 Fig 12A originally via Okabe, et al. [18] (inset, Panel B) showing pilot-RTM reproduces observed Vm peaks above 0 mV over 1 second. ‘Pilot-RTM’ here refers to interim reduced model; see text for more.
Fig 4
Fig 4. Steady-state approximation comparisons with full ODE solutions for IV curves and Vm results from FTM simulations; BK (Panel A) and T-type (Panel B) channels.
Full ODE solutions displayed with black traces (labeled ‘FTM’) and hybrid SS-ODE or full SS solutions with dotted and/or coloured traces as noted. For currents of channels, numerically-solved ODEs and SS approximation computations for each channel performed over a range of Vm for t ∈ [0, T] with T = 10 or 100 ms as noted, and corresponding currents, Ix, shown, with conductances, g¯x all set to 1 (Panels A, B, upper panes). Resulting Ix for each channel scaled by maximum current computed with ODE solutions: outward for BK and inward for T-type. SSP simulated Vm presented for both full ODE and SS variables of the FTM (Panels a, b, lower inset panes) with ΔVm for each result as shown. (Panel a) BK channel variables xα, xβ computed either with ODE solver (black trace) or SS approximation for current (scaled Ibk, upper pane) and relative difference in current (ΔIbk, upper pane inset) for comparison. Note legend traces apply to both panes: blue trace for both xα and xβ approximated with SS, and red and cyan dotted for each SS-approximated variable in solo. Lower pane presents ΔVm for SSP results (Vm shown in inset) with combinations of full ODE (FTM, black trace) and SS-approximations as annotated. (Panel b) CaT channel variables b and g. Icat (scaled) in upper pane over scanned Vm range with T = 10 ms and T = 100 ms (inset) for full ODE (black trace, FTM) and SS-approximation for both b and g (blue dotted) or each variable SS-approximated in solo as noted (red, cyan). Legend traces apply to both panes. Lower pane: ΔVm for SSP simulation with CaT channel either full ODE (FTM, black trace) or combinations of SS-approximations as noted; corresponding Vm results for SSP of each ODE-SS configuration displayed in inset. See SSP description for numerical details.
Fig 5
Fig 5. Steady-state approximation comparisons with ODE solutions for IV curves and Vm results from FTM simulations; L-type (Panel A) and Na+ (Panel B) channels.
Full ODE solutions displayed with black traces (labeled ‘FTM’) and hybrid SS-ODE or full SS solutions with dotted/coloured traces as noted. Presented plots similar as for BK and T-type, with upper panes displaying currents (scaled to maximum inbound) solved out to T = 10 or 100 ms (inset), and lower panes Vm or ΔVm as labeled. (Panel A) CaL channel, d activation and f1, f2 inactivation variables. ICaL shown (upper pane) for full ODE (black trace, FTM) and SS approximated variables as noted (blue-, red- and cyan-dotted). SS approximations for only f2 not performed. Vm presented (lower pane) and not ΔVm due to obvious deviations; note same trace legend as upper pane (black FTM and coloured SS combinations). SSP simulations with varied conductances (inset) for two SS approximations and improved Vm fit to FTM: d and f1 both SS (cyan trace) with gCaL reduced; only d approximated with SS (red trace) with gCaL reduced as well as gNa and gK1 both increased (see text for details). (Panel B). Na+ channel, m and h activation/inactivation variables. Upper pane presents currents for full ODE, hybrid SS and full SS solutions out to T = 10 and 100 ms (inset), and lower pane result for SSP showing ΔVm (relative) and Vm (inset) with same ODE and SS combinations as noted in upper legend: full ODE (black trace), both m and h activation/inactivation variables SS (blue dotted) and m or h SS (red and cyan dotted, respectively). See SSP description for numerical details.
Fig 6
Fig 6. SSP RTM reproduction and comparison with FTM.
(Panel A) Complete RTM (red dotted) with all modifications detailed in text presented in comparison with FTM (blue trace), showing [Ca2+]i (upper pane), Vm (middle pane) and computed Force (lower pane) as dependent on [Ca2+]i (see text). (Panel B) Relative difference for results presented in Panel A. Note semilog scales for all. Key RTM parameters include: gCaL = 0.6, gNa = 0.0895, gK1 = 0.7 pA/pF and β = 0.0169.
Fig 7
Fig 7. RTM: Variation of Iapp.
Comparison results from Tong, 2011 Fig 11A, Fig 11B and Fig 11C and Tong, 2014 Fig 8D. Stimulus strength varied as noted aimed at reproducing experimental results (insets, Panels A-C) as given in Tong, 2011 Fig 11, or extended bursting (Panel D). Each Iapp applied up to t = 10 s starting at t = 1 s, except Panel D out to t = 50 s. Additional simulation with elevated extracellular initial condition K+ at 10 mM for comparison and no applied stimulus (blue dotted, Panel B). Conductances for key currents: gCaL = 0.6, gNa = 0.0895, gK1 = 0.7 pA/pF (identical to SSP values, Panels A-C), with gK1 = 0.75 for Panel D. Experimental traces (insets) adapted from Tong, et al. 2011 Fig 11.

Similar articles

Cited by

References

    1. Margara F, Wang ZJ, Levrero-Florencio F, Santiago A, Vázquez M, Bueno-Orovio A, et al.. In-silico human electro-mechanical ventricular modelling and simulation for drug-induced pro-arrhythmia and inotropic risk assessment. Progress in Biophysics and Molecular Biology. 2021;159:58–74. doi: 10.1016/j.pbiomolbio.2020.06.007 - DOI - PMC - PubMed
    1. Du P, O’Grady G, Cheng LK. A theoretical analysis of anatomical and functional intestinal slow wave re-entry. Journal of Theoretical Biology. 2017;425:72–79. doi: 10.1016/j.jtbi.2017.04.021 - DOI - PubMed
    1. Yochum M, Laforêt J, Marque C. Multi-scale and multi-physics model of the uterine smooth muscle with mechanotransduction. Computers in Biology and Medicine. 2018;93:17–30. doi: 10.1016/j.compbiomed.2017.12.001 - DOI - PubMed
    1. Fall CP, Marland ES, Wanger JM, Tyson JJ, editors. Computational Cell Biology. 1st ed. Interdisciplinary Applied Mathematics. Springer; New York; 2002.
    1. Fitzhugh R. Thresholds and plateaus in the Hodgkin-Huxley nerve equations. J Gen Physiol. 1960;43(5):867–896. doi: 10.1085/jgp.43.5.867 - DOI - PMC - PubMed

Publication types