. 2023 Oct 1;211(7):1082-1098.
doi: 10.4049/jimmunol.2300201.

Immunosequencing and Profiling of T Cells at the Maternal-Fetal Interface of Women with Preterm Labor and Chronic Chorioamnionitis

Affiliations

Immunosequencing and Profiling of T Cells at the Maternal-Fetal Interface of Women with Preterm Labor and Chronic Chorioamnionitis

Derek Miller et al. J Immunol. .

Abstract

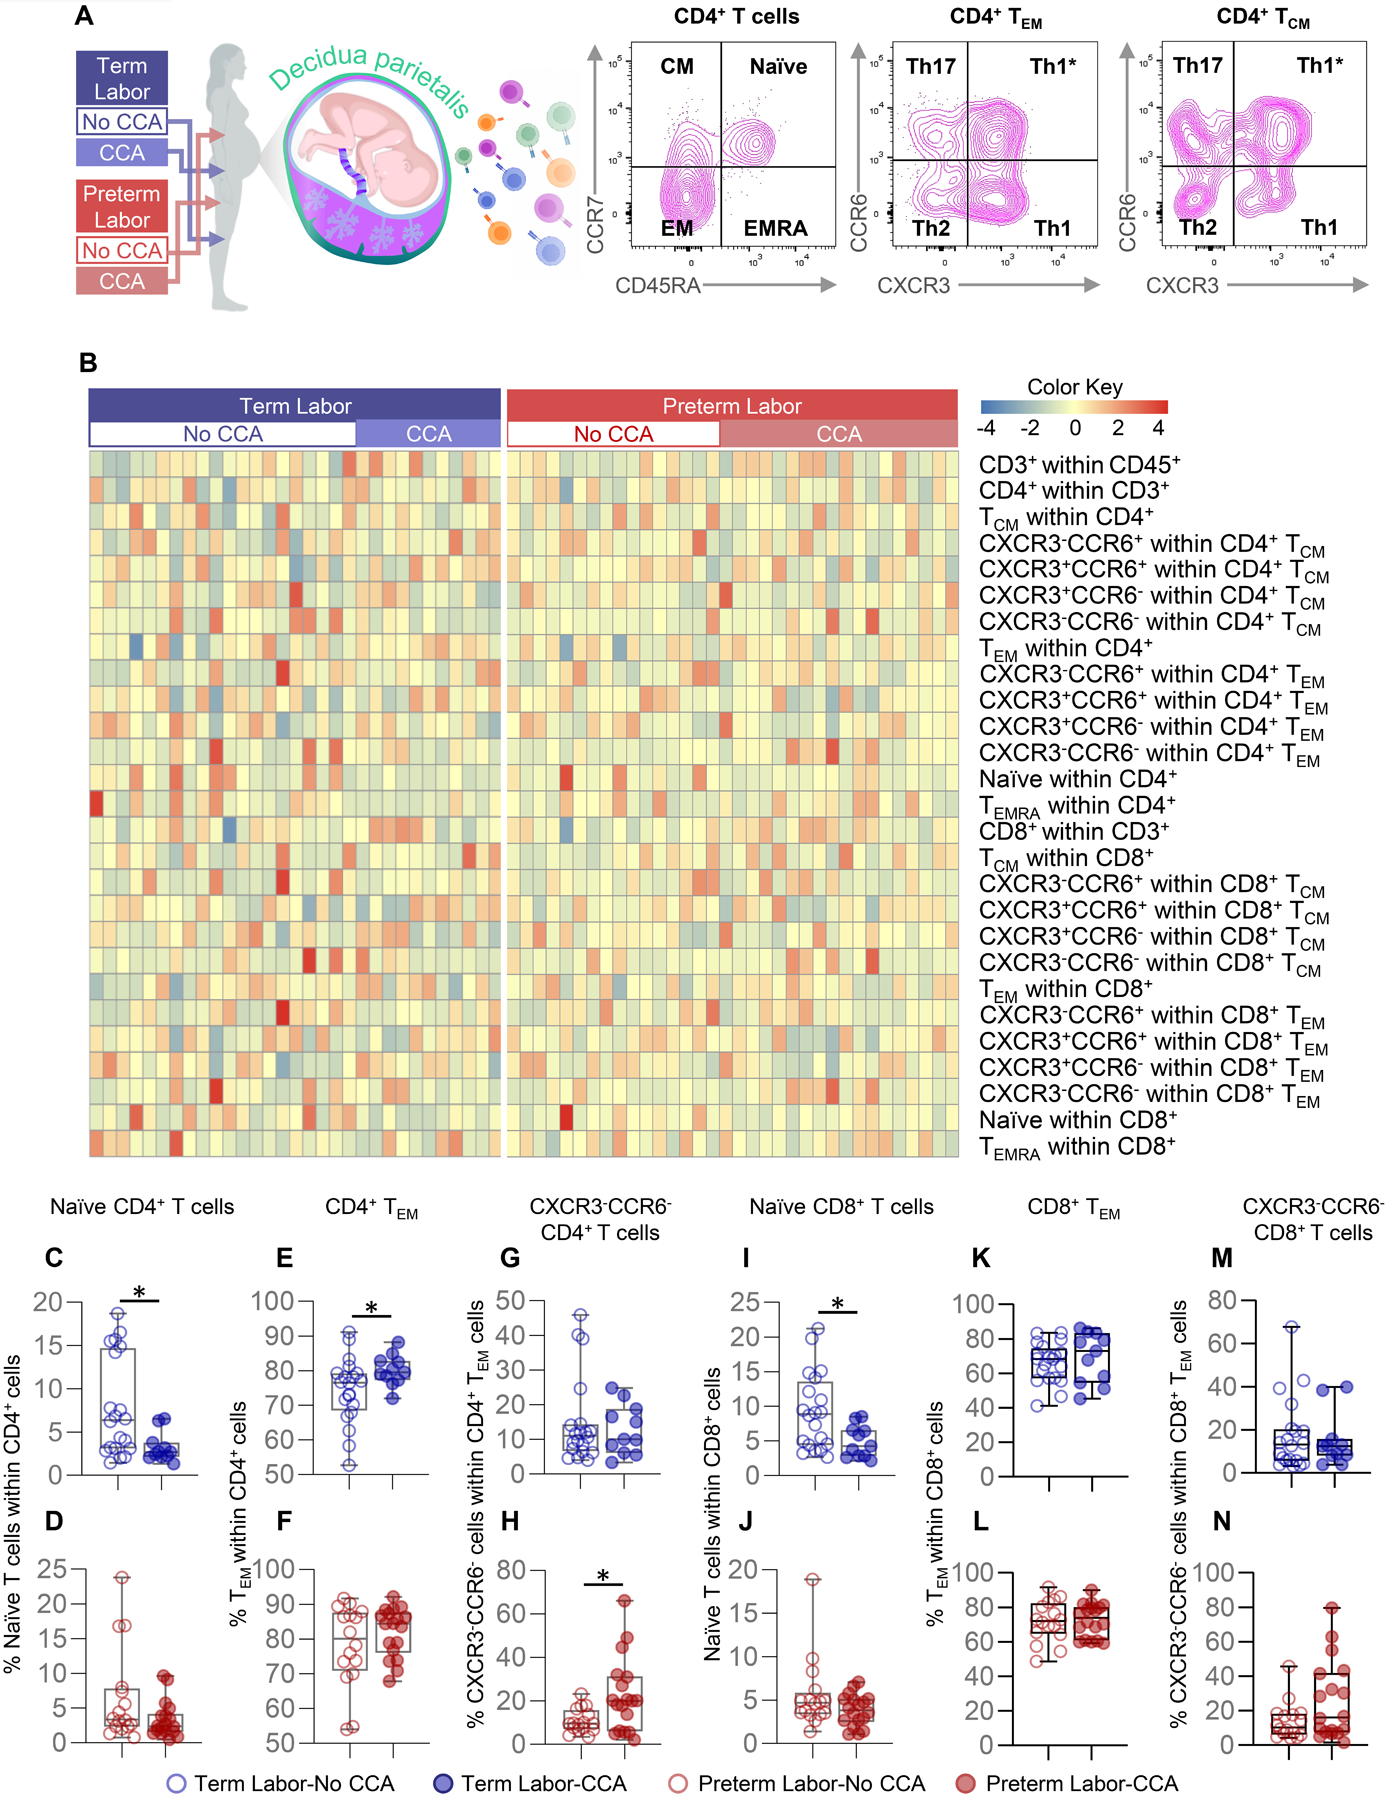
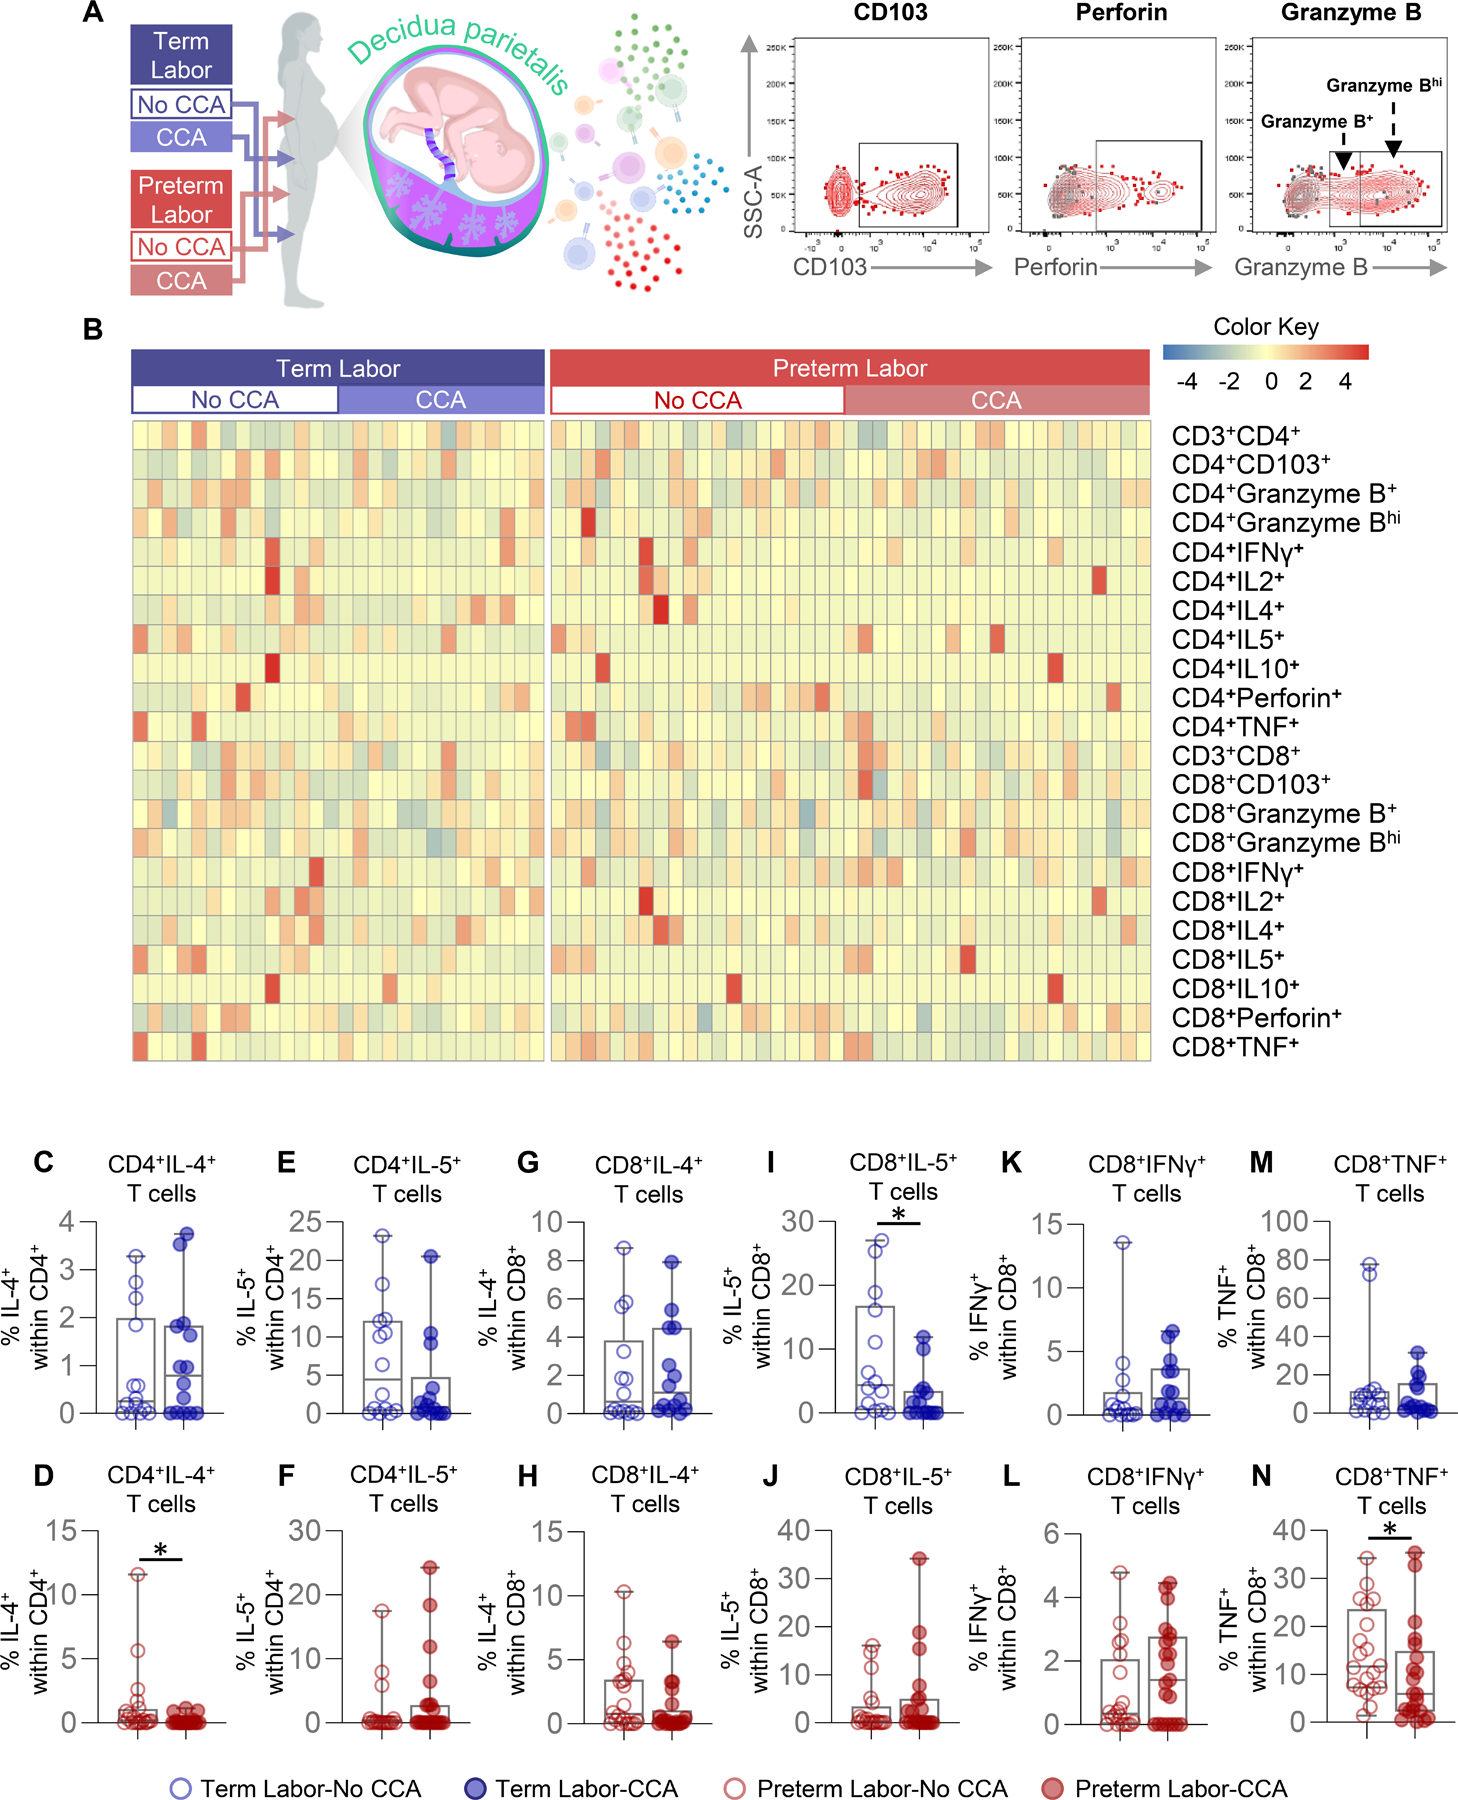
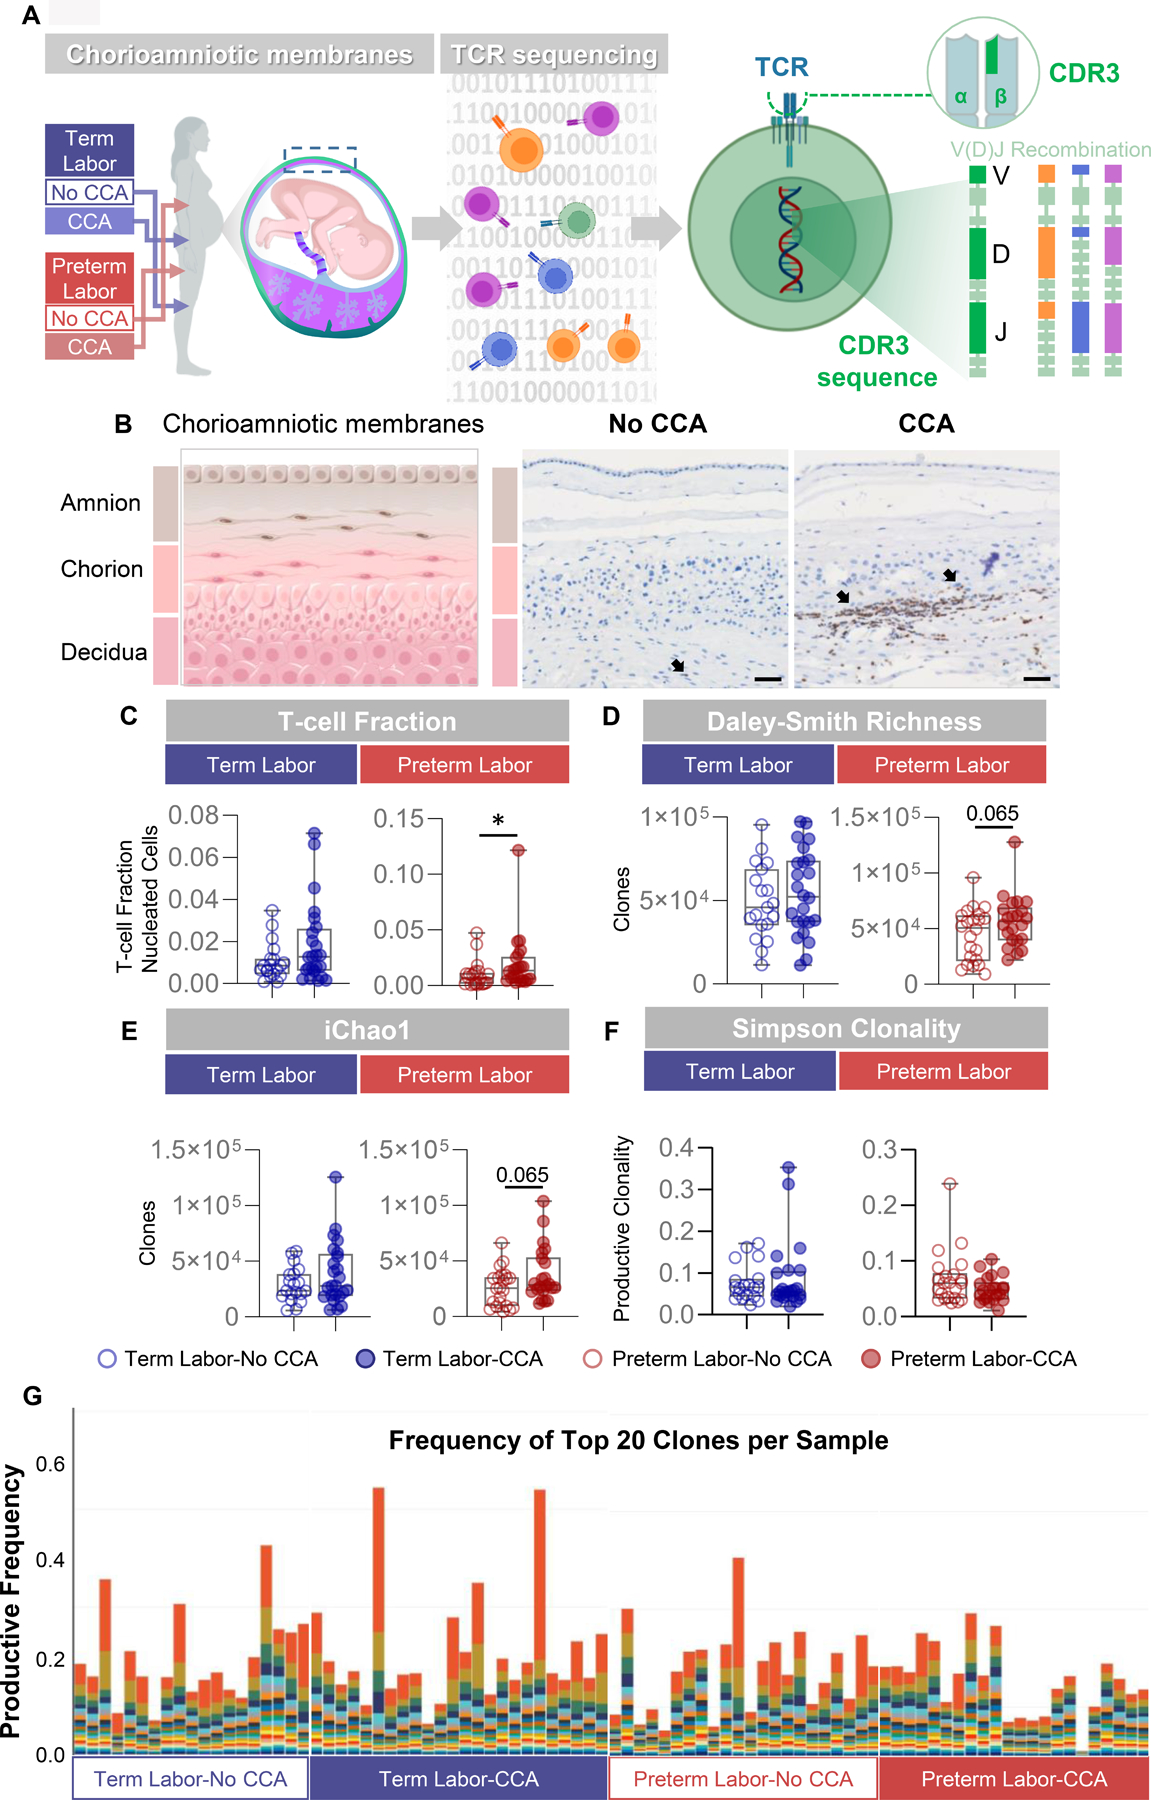
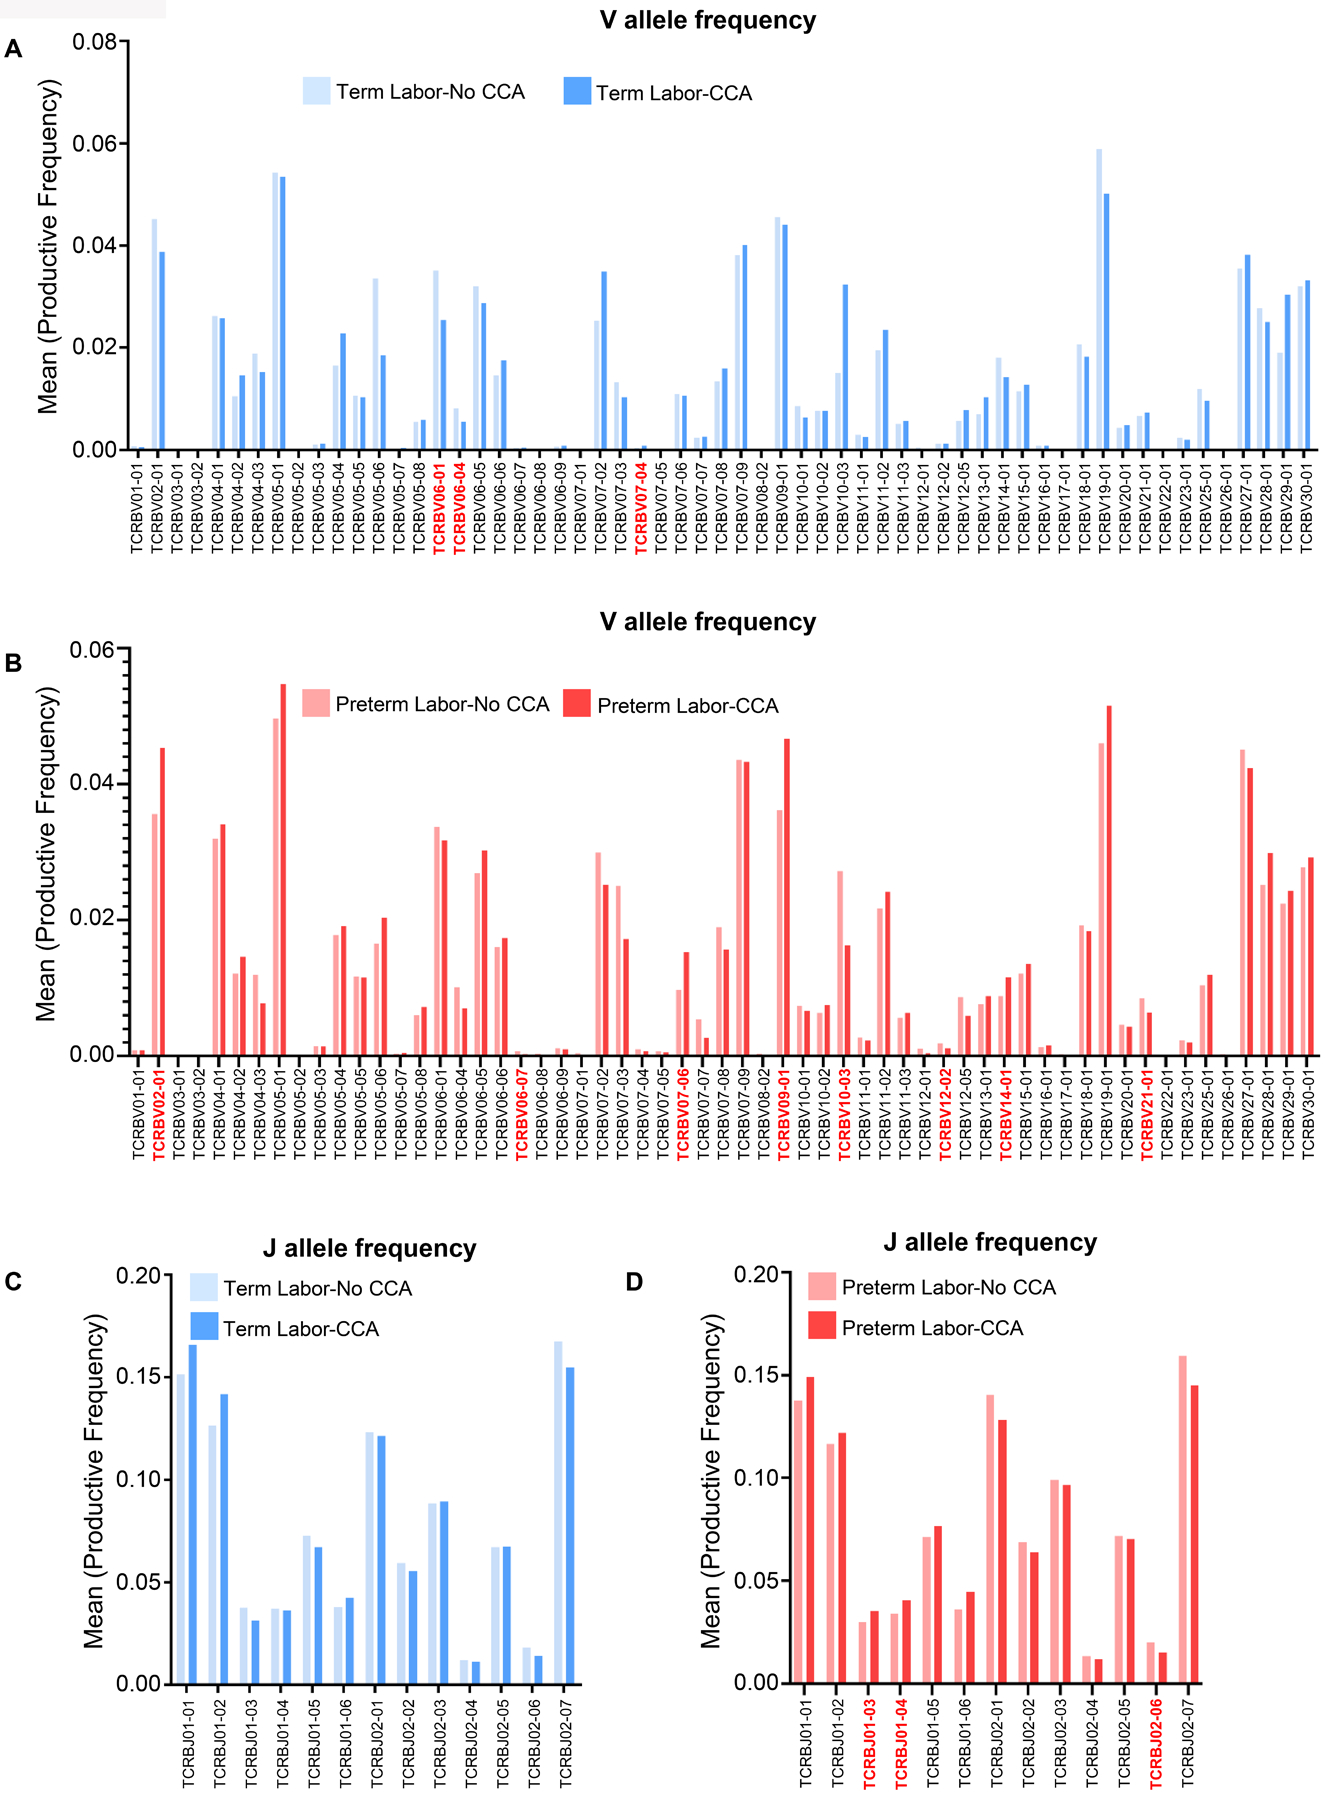
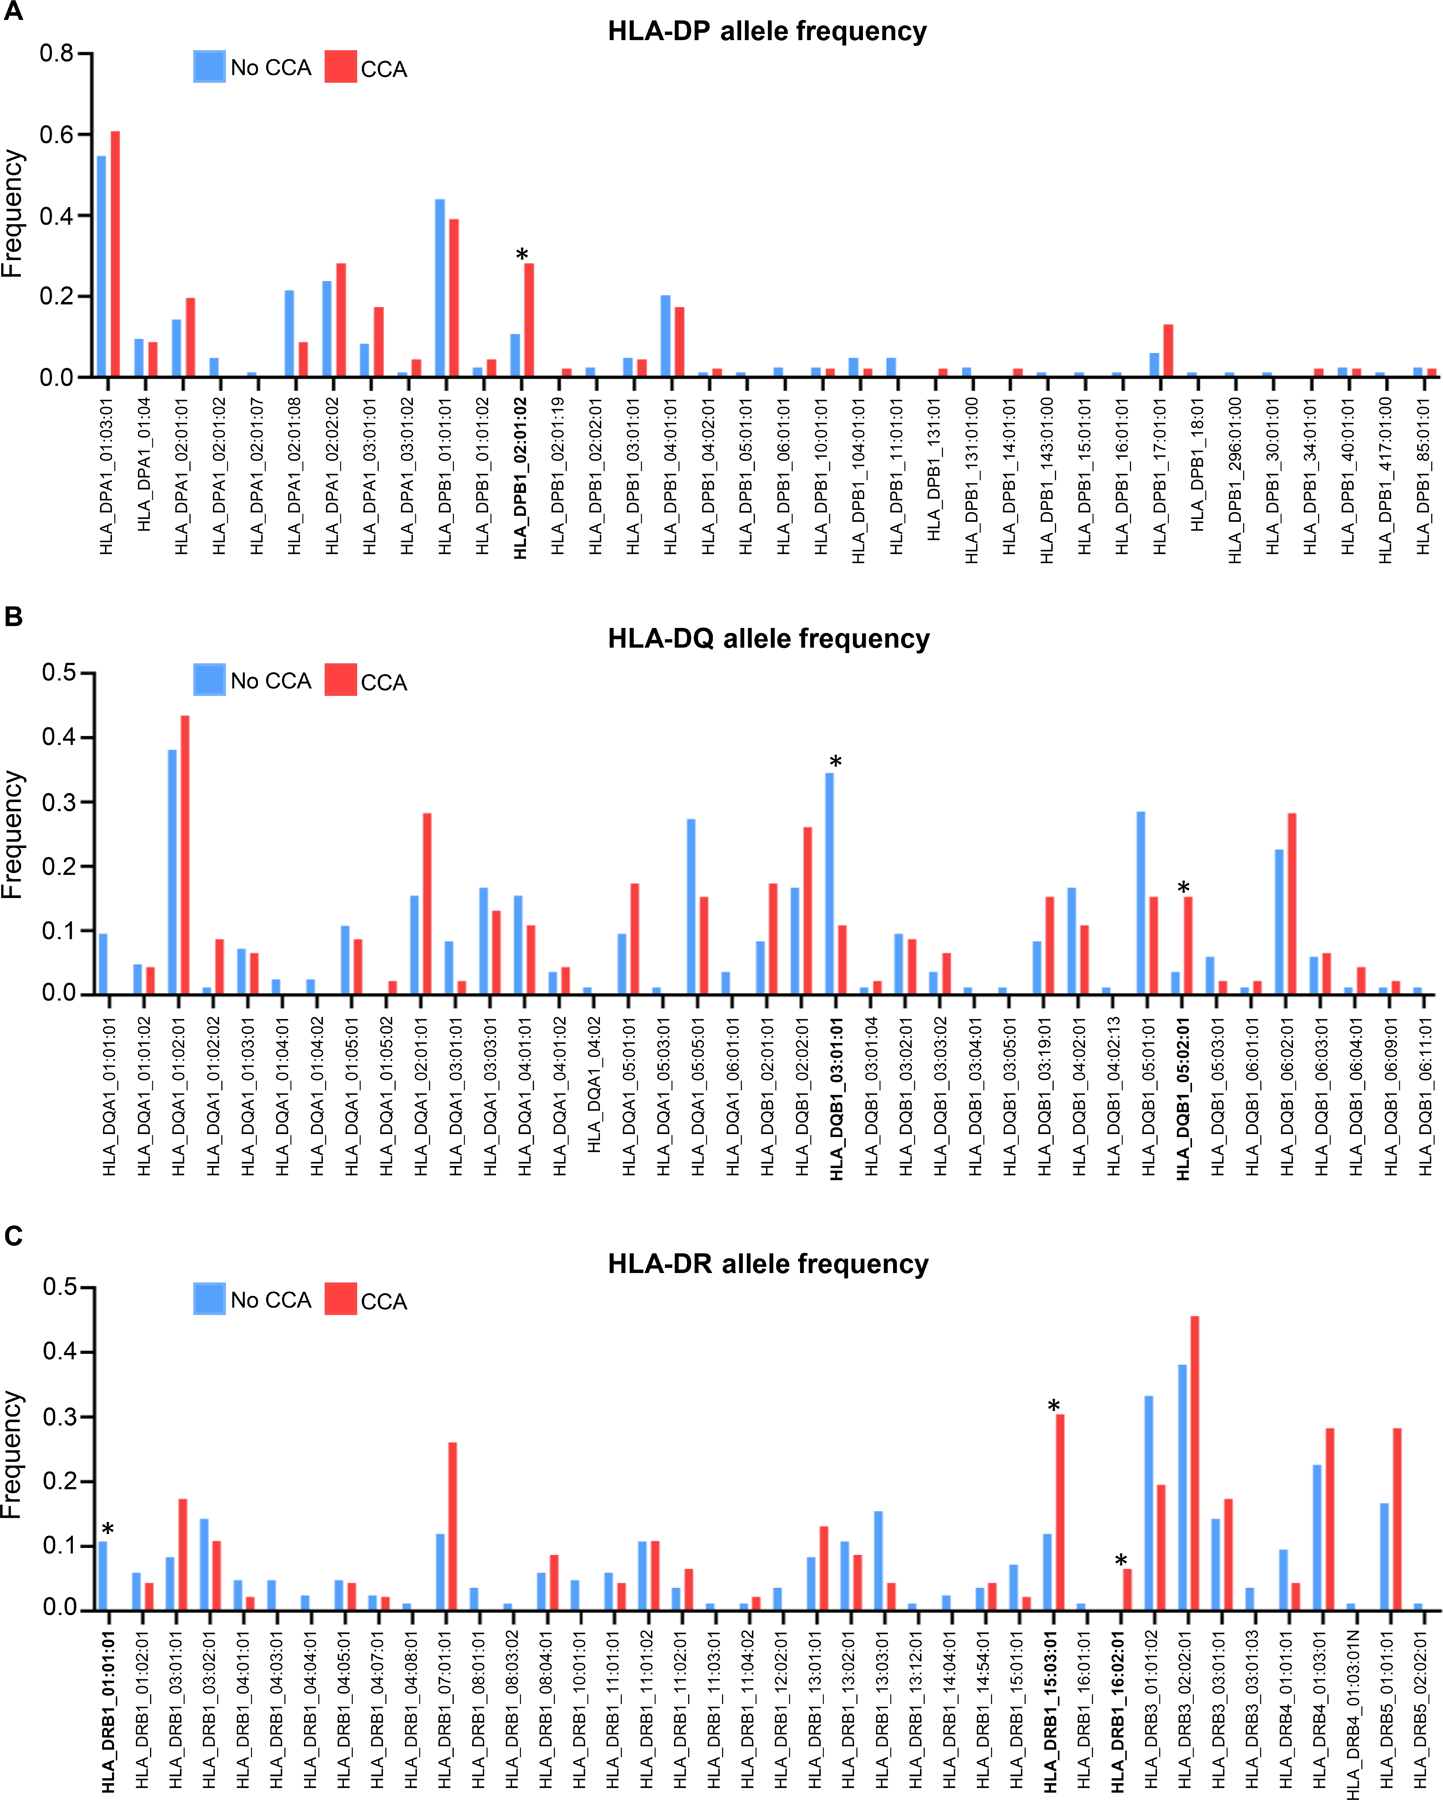
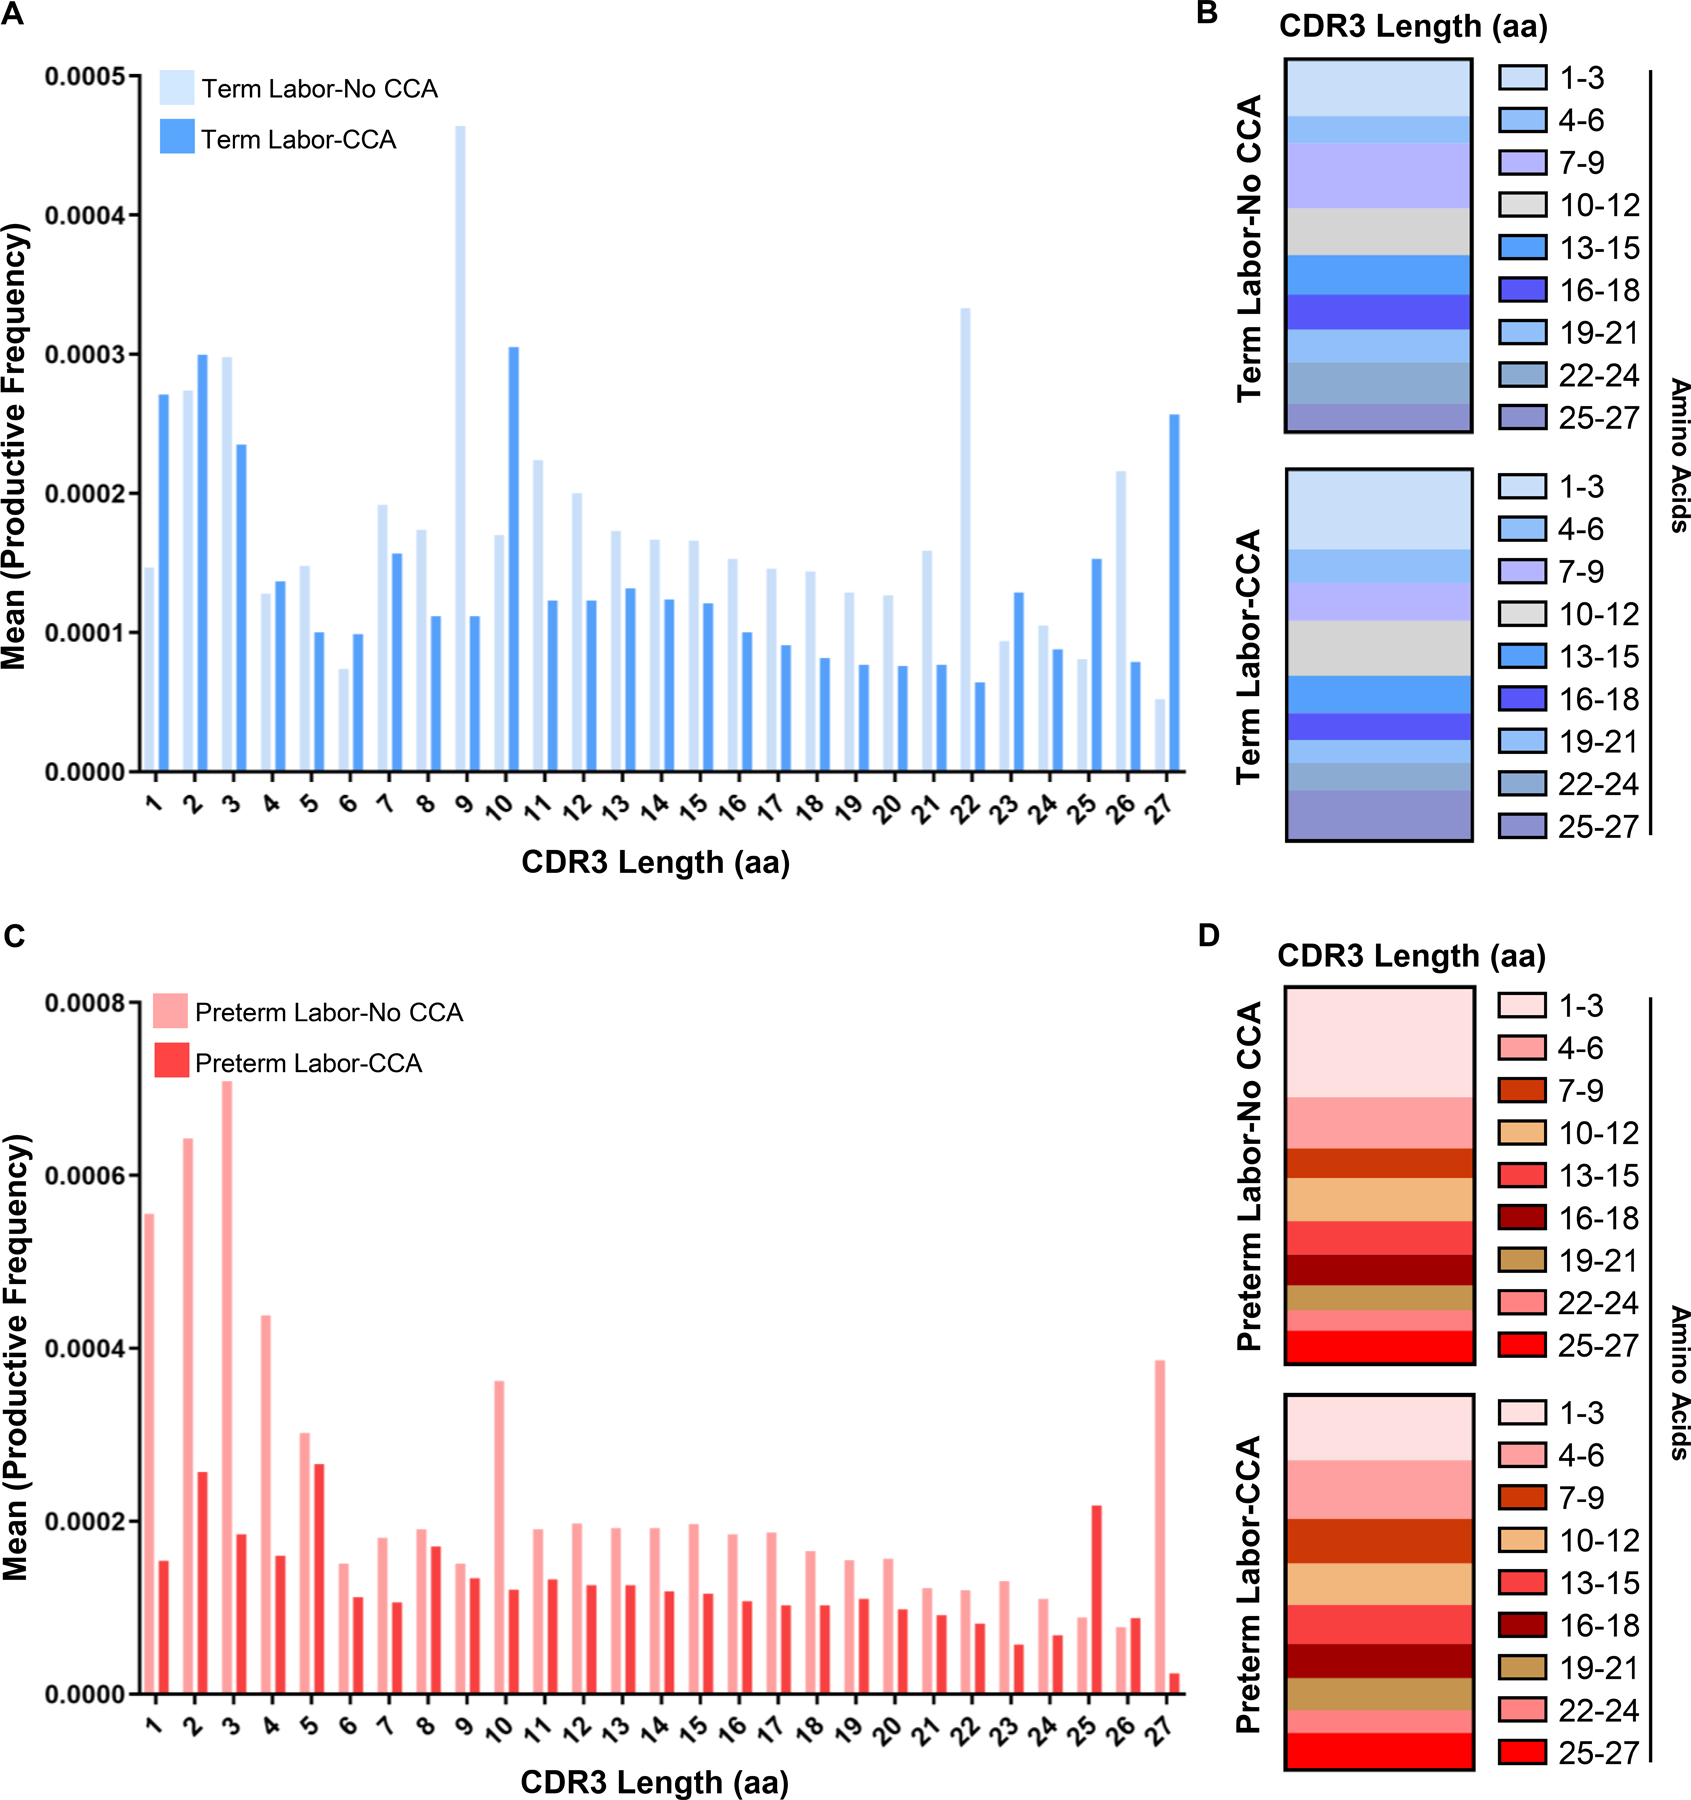
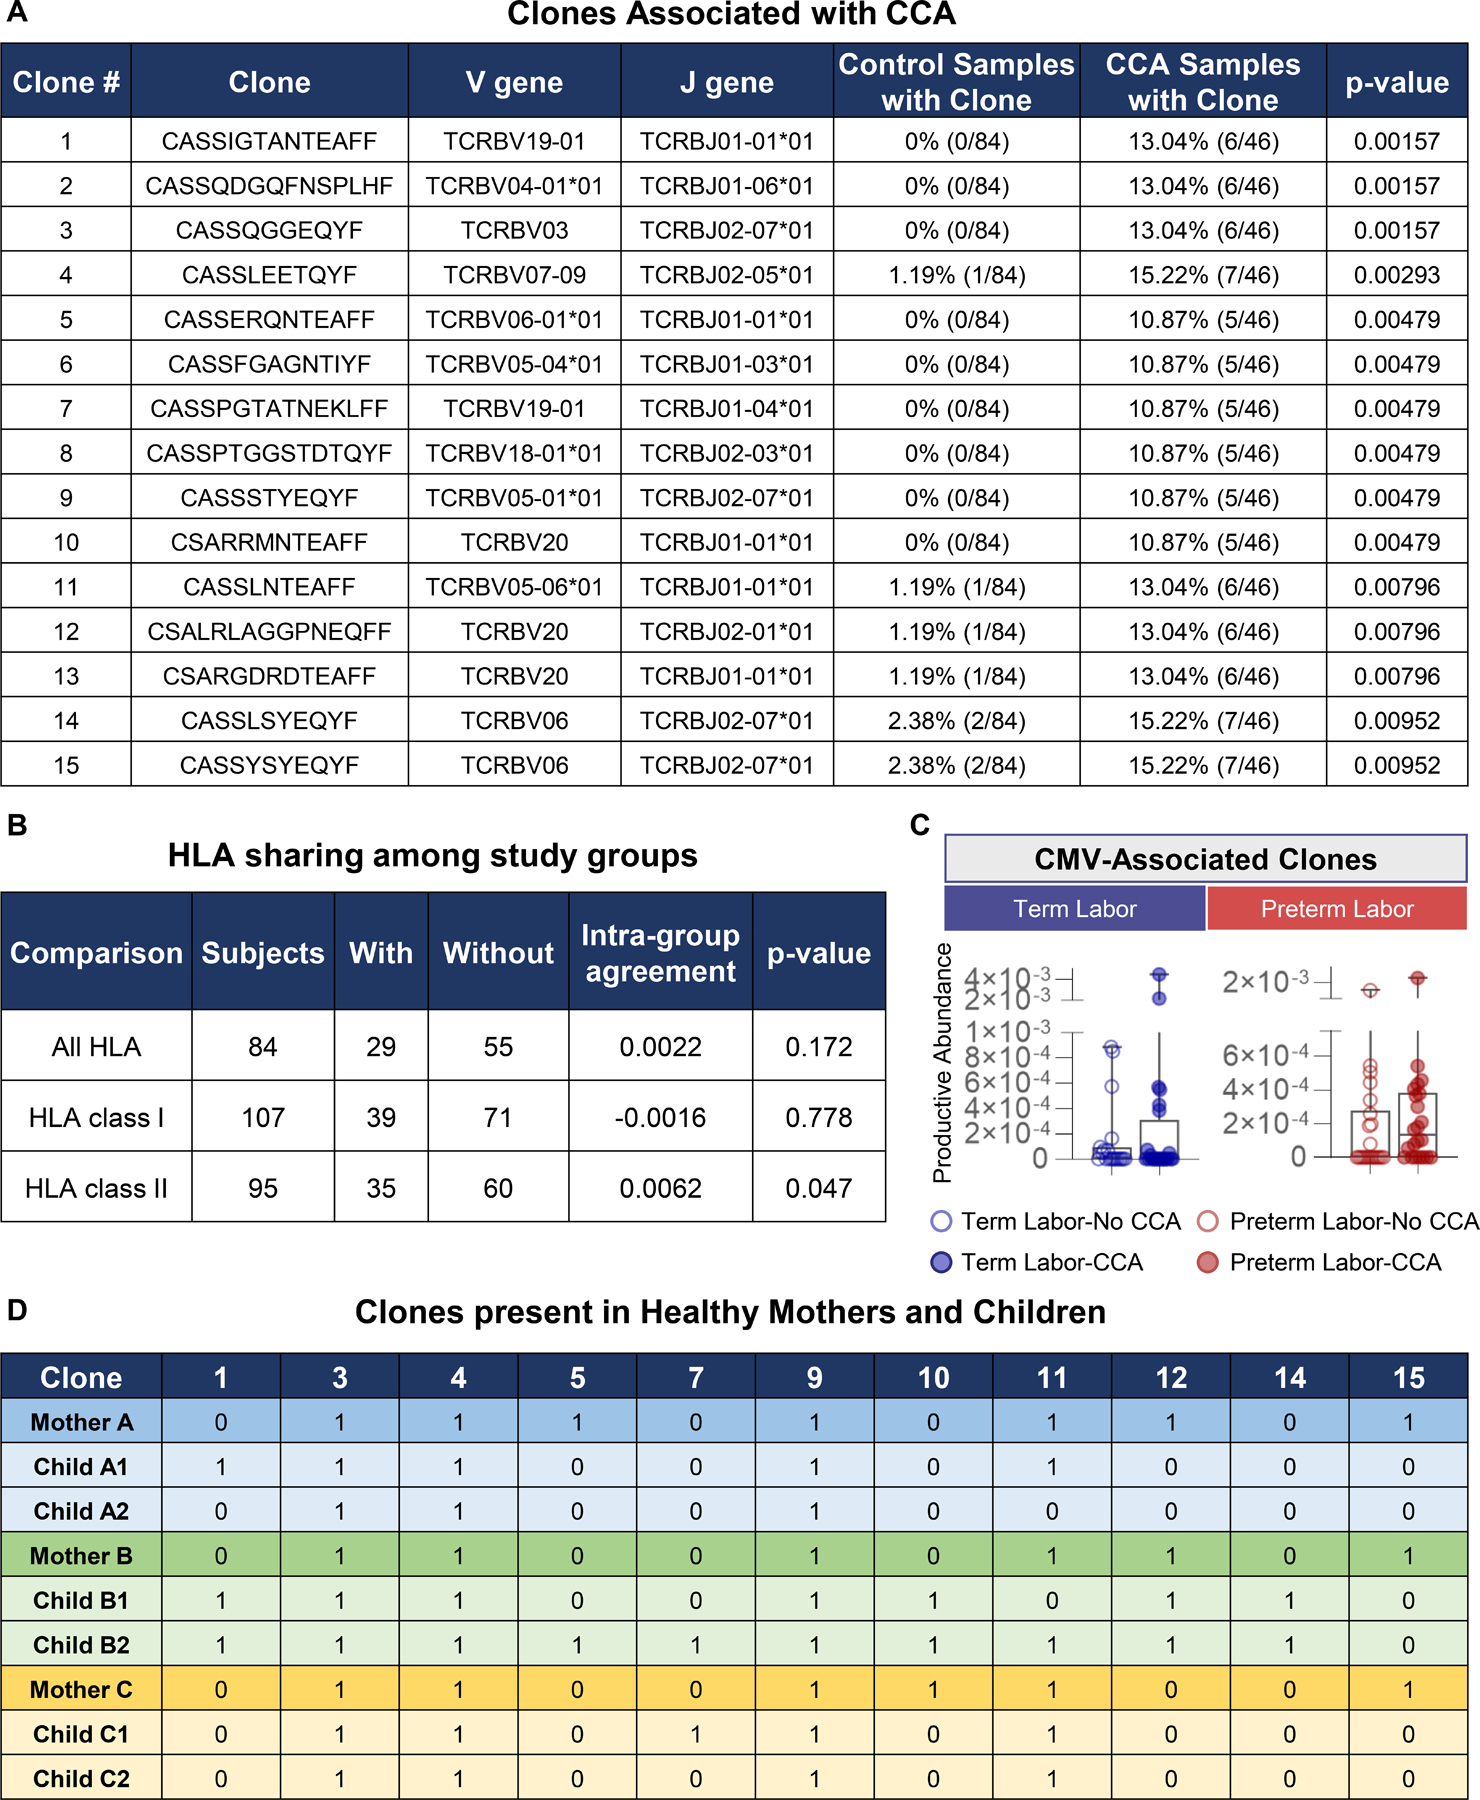
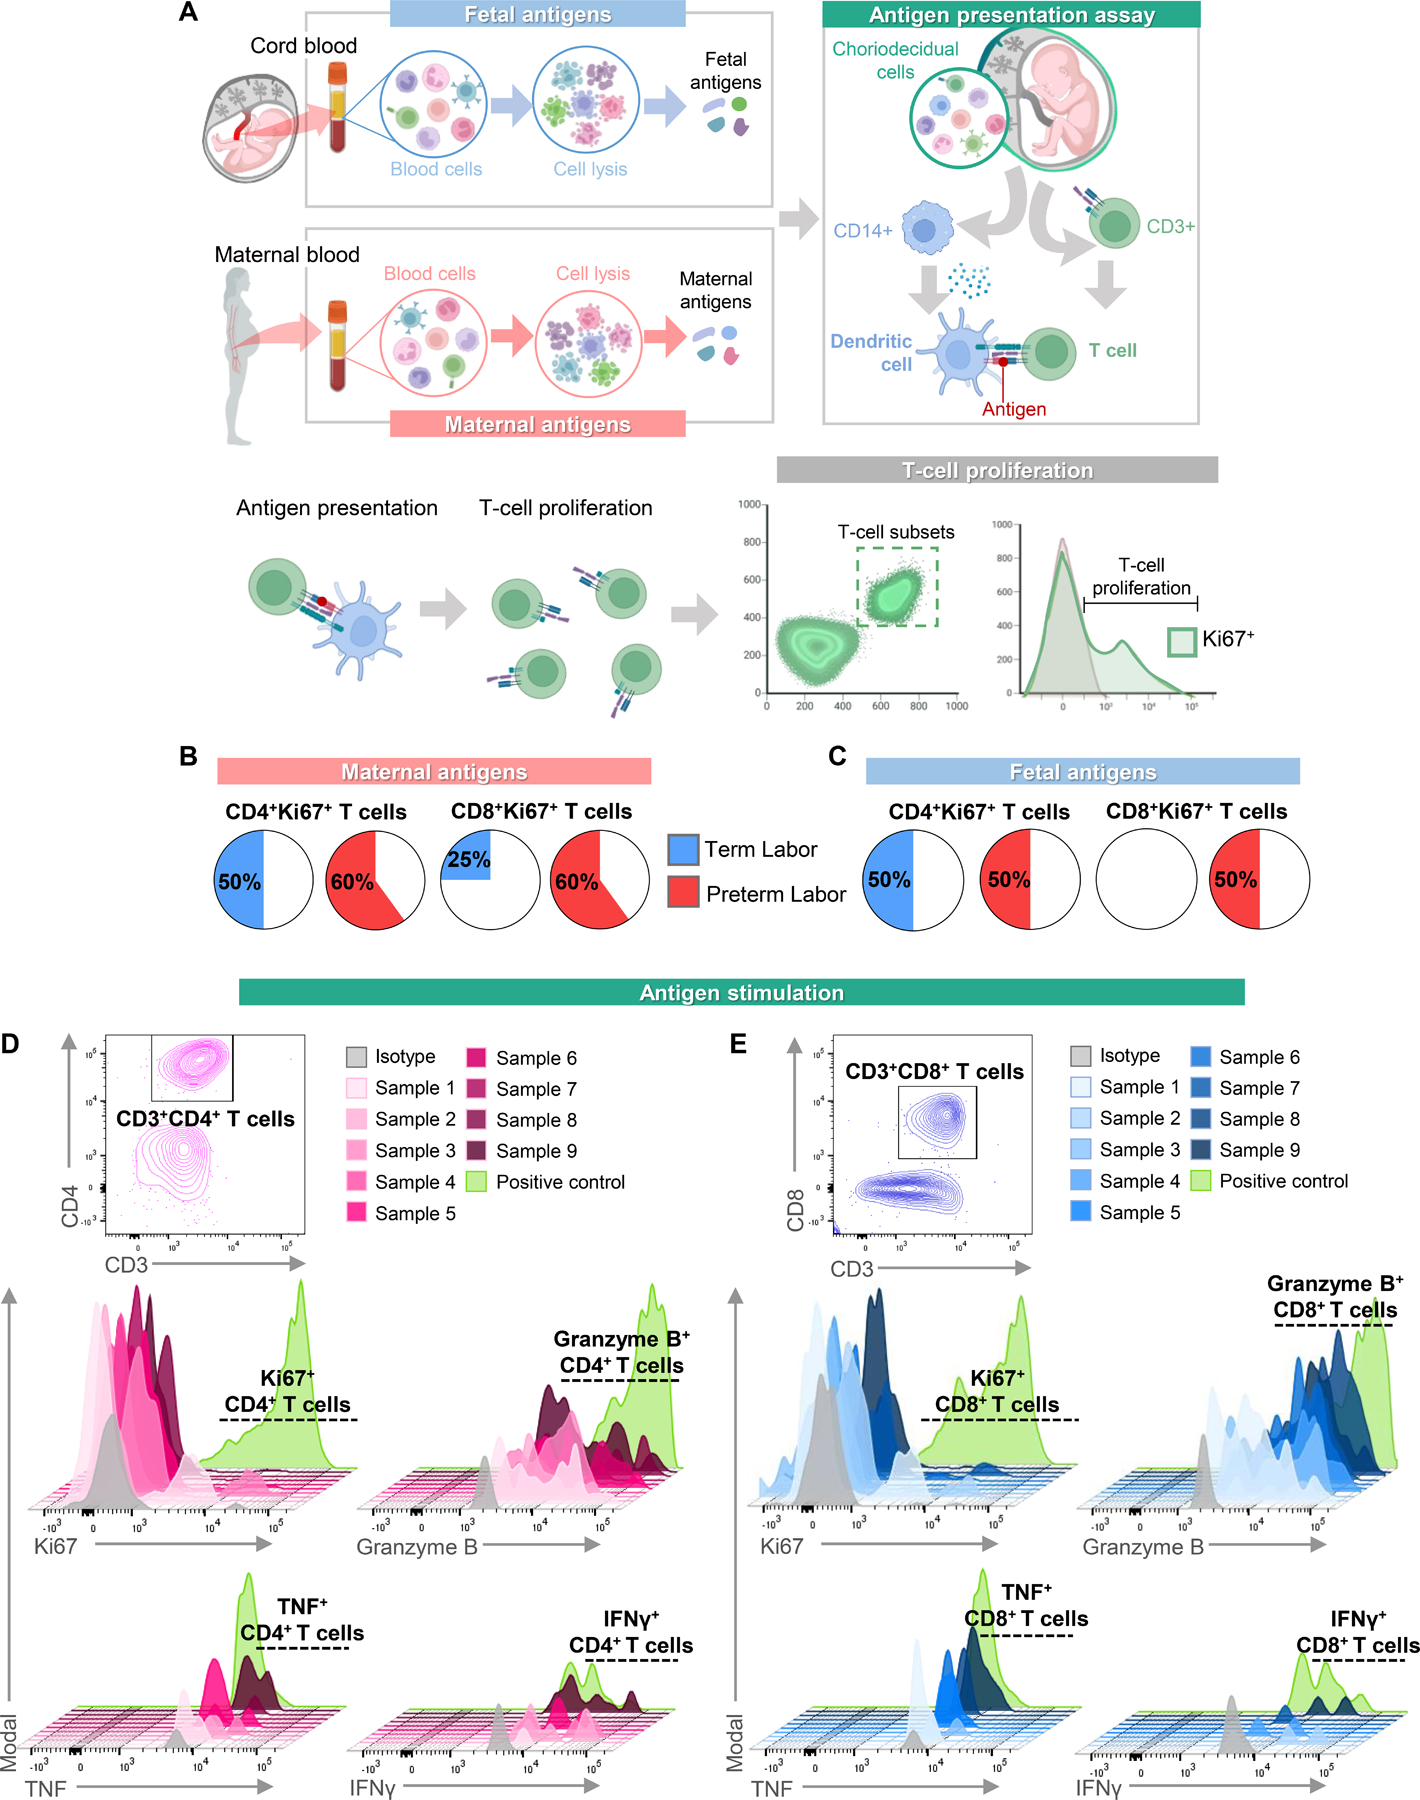
T cells are implicated in the pathophysiology of preterm labor and birth, the leading cause of neonatal morbidity and mortality worldwide. Specifically, maternal decidual T cells infiltrate the chorioamniotic membranes in chronic chorioamnionitis (CCA), a placental lesion considered to reflect maternal anti-fetal rejection, leading to preterm labor and birth. However, the phenotype and TCR repertoire of decidual T cells in women with preterm labor and CCA have not been investigated. In this study, we used phenotyping, TCR sequencing, and functional assays to elucidate the molecular characteristics and Ag specificity of T cells infiltrating the chorioamniotic membranes in women with CCA who underwent term or preterm labor. Phenotyping indicated distinct enrichment of human decidual effector memory T cell subsets in cases of preterm labor with CCA without altered regulatory T cell proportions. TCR sequencing revealed that the T cell repertoire of CCA is characterized by increased TCR richness and decreased clonal expansion in women with preterm labor. We identified 15 clones associated with CCA and compared these against established TCR databases, reporting that infiltrating T cells may possess specificity for maternal and fetal Ags, but not common viral Ags. Functional assays demonstrated that choriodecidual T cells can respond to maternal and fetal Ags. Collectively, our findings provide, to our knowledge, novel insight into the complex processes underlying chronic placental inflammation and further support a role for effector T cells in the mechanisms of disease for preterm labor and birth. Moreover, this work further strengthens the contribution of adaptive immunity to the syndromic nature of preterm labor and birth.


Conflict of interest statement

DISCLOSURE

The authors have no financial conflicts of interest.

Figures

Figure 1.
Figure 1.. Chronic chorioamnionitis shapes decidual T-cell phenotypes and immune mediator expression during preterm and term labor.
(A) Chorioamniotic membrane samples, including the decidua parietalis, were collected from women who underwent spontaneous term or preterm labor with or without chronic chorioamnionitis (CCA) (n = 11 – 20 per group) and phenotyping of decidual memory T-cell subsets was performed. Representative gating strategy shows the identification of CD4+ naïve, central memory (TCM), effector memory (TEM), and terminally differentiated effector memory (TEMRA) T cells. CCR6 and CXCR3 were used to classify TEM and TCM as Th1 (CXCR3+CCR6), Th2 (CXCR3CCR6), Th17 (CXCR3CCR6+), and non-conventional Th1 (Th1*) (CXCR3+CCR6+). Parent gates and representative CD8+ memory T-cell populations are shown in Supplementary Figure 1. (B) Heatmap representation showing the z-scores for proportions of memory T-cell subsets among the study groups. Red indicates increased abundance and blue indicates decreased abundance. Proportions of decidual (C&D) CD4+ naïve T cells, (E&F) CD4+ TEM, (G&H) CXCR3CCR6 CD4+ TEM cells, (I&J) CD8+ naïve T cells, (K&L) CD8+ TEM, and (M&N) CXCR3CCR6 CD8+TEM cells in the chorioamniotic membranes of women with Term Labor-No CCA (open blue circles), Term Labor-CCA (filled blue circles), Preterm Labor-No CCA (open red circles), or Preterm Labor-CCA (filled red circles). Data are shown as box-and-whisker plots where midlines indicate medians, boxes indicate interquartile ranges, and whiskers indicate minimum/maximum values. P-values were determined by using Mann-Whitney U-tests. *p < 0.05.
Figure 2.
Figure 2.. Immune mediator expression by decidual T cells in the chorioamniotic membranes with chronic chorioamnionitis.
(A) Chorioamniotic membrane samples, including the decidua parietalis, were collected from women who underwent spontaneous term or preterm labor with or without chronic chorioamnionitis (CCA) (n = 14 – 21 per group) and phenotyping of mediator expression by decidual T cells was performed. Representative gating strategy shows the expression of CD103, perforin, and granzyme B by T cells. Parent gates and representative gating of IFNγ, TNF, IL-2, IL-4, IL-5, and IL-10 are shown in Supplementary Figure 1. (B) Heatmap representation showing the z-scores for proportions of T-cell subsets among the study groups. Red indicates increased abundance and blue indicates decreased abundance. Proportions of decidual (C&D) CD4+IL-4+ T cells, (E&F) CD4+IL-5+ T cells, (G&H) CD8+IL-4+ T cells, (I&J) CD8+IL-5+ T cells, (K&L) CD8+IFNγ+ T cells, and (M&N) CD8+TNF+ T cells in the chorioamniotic membranes of women with Term Labor-No CCA (open blue circles), Term Labor-CCA (filled blue circles), Preterm Labor-No CCA (open red circles), or Preterm Labor-CCA (filled red circles). Data are shown as box-and-whisker plots where midlines indicate medians, boxes indicate interquartile ranges, and whiskers indicate minimum/maximum values. P-values were determined by using Mann-Whitney U-tests. *p < 0.05.
Figure 3.
Figure 3.. Chronic chorioamnionitis is characterized by an increased number of T-cell clones with low clonal expansion in women with preterm labor.
(A) Chorioamniotic membrane samples were collected from women who underwent spontaneous term or preterm labor with or without chronic chorioamnionitis (CCA) (n = 19 – 24 per group) and genomic DNA was isolated for sequencing of the CDR3 region of TCRB. (B) Representative immunohistochemistry images illustrate the increased abundance of T cells in the chorioamniotic membranes in cases of CCA (black arrows). Images taken at 200X magnification. Scale bars (bottom right of each image) represent 50 µm. (C) Fraction of T cells among all nucleated cells determined by TCR sequencing. (D) Daley-Smith richness representing the upper bound of unique TCR sequences per sample. (E) iChao1 representing the lower bound of unique TCR sequences per sample. (F) Simpson clonality representing the dominance of individual TCR sequences per sample. (G) Productive frequency of the top 20 clones in each sample across all study groups. Data are shown as box-and-whisker plots where midlines indicate medians, boxes indicate interquartile ranges, and whiskers indicate minimum/maximum values. Open blue circles = Term Labor-No CCA, filled blue circles = Term Labor-CCA, open red circles = Preterm Labor-No CCA, filled red circles = Preterm Labor-CCA. P-values were determined by using Mann-Whitney U-tests. *p < 0.05.
Figure 4.
Figure 4.. Chronic chorioamnionitis drives the infiltration of T cells with a stereotypical V and J gene usage profile in women with preterm labor.
(A) Mean frequency for each of 59 V alleles in T cells from women who underwent term labor with or without chronic chorioamnionitis (CCA) (n = 19 – 24 each). (B) Mean frequency for each of 59 V alleles in T cells from women who underwent preterm labor with or without CCA (n = 22 each). (C) Mean frequency for each of 13 J alleles in T cells from women who underwent term labor with or without CCA. (D) Mean frequency for each of 13 J alleles in T cells from women who underwent preterm labor with or without CCA. Red bolded text indicates those contrasts that were statistically significant prior to correction for multiple comparisons. Light blue = Term Labor-No CCA, dark blue = Term Labor-CCA, pink = Preterm Labor-No CCA, red = Preterm Labor-CCA.
Figure 5.
Figure 5.. HLA class II allele frequency does not drastically differ in women with chronic chorioamnionitis and preterm labor.
Frequency of (A) HLA-DP alleles, (B) HLA-DQ alleles, and (C) HLA-DR alleles in women who delivered with or without chronic chorioamnionitis (CCA) (n = 41 – 46 per group). Blue = No CCA, red = CCA. P-values were determined by using Fisher’s exact test adjusted for multiple comparisons. *p < 0.05.
Figure 6.
Figure 6.. CDR3 length distribution in T cells from women with preterm labor is distinct from those with term deliveries.
Frequency was determined for CDR3 sequences of amino acid (aa) lengths ranging from 1 – 27 aa. (A) Frequency of CDR3 aa lengths in the chorioamniotic membranes of women with term labor without (Term Labor-No CCA, light blue) or with (Term Labor-CCA, dark blue) chronic chorioamnionitis (CCA) (n = 19 – 24 per group). (B) Stacked bar chart showing the relative frequencies of CDR3 lengths in ranges of 1 – 3, 4 – 6, 7 – 9, 10 – 12, 13 – 15, 16 – 18, 19 – 21, 22 – 24, and 25 – 27 aa in Term Labor-No CCA and Term Labor-CCA. (C) Frequency of CDR3 aa lengths in the chorioamniotic membranes of women with preterm labor without (Preterm Labor-No CCA, pink) or with (Preterm Labor-CCA, red) CCA (n = 22 per group). (D) Stacked bar chart showing the relative frequencies of CDR3 lengths in ranges of 1 – 3, 4 – 6, 7 – 9, 10 – 12, 13 – 15, 16 – 18, 19 – 21, 22 – 24, and 25 – 27 aa in Preterm Labor-No CCA and Preterm Labor-CCA.
Figure 7.
Figure 7.. Chronic chorioamnionitis drive the expansion of T cells against specific antigens, some of which may be derived from the mother or offspring.
(A) Amino acid sequences, V and J alleles, and frequency among samples without chronic chorioamnionitis (CCA) or with CCA for 15 TCR clones. Identification of clones associated with CCA was performed using the Fisher’s exact test. (B) Comparison of HLA sharing among samples without and with CCA. The effect of HLA sharing on clone associations was determined using the Multiple Response Permutation Procedures test. (C) Number of TCR clones associated with CMV among samples from women with term labor without (Term Labor-No CCA) or with (Term Labor-CCA) CCA (n = 19 – 24 per group) and from women with preterm labor without (Preterm Labor-No CCA) or with (Preterm Labor-CCA) CCA (n = 22 per group). Data are shown as box-and-whisker plots where midlines indicate medians, boxes indicate interquartile ranges, and whiskers indicate minimum/maximum values. (D) Table illustrating the identification of CCA-associated clones in the TCR repertoires of healthy mothers and their offspring derived from (Putintseva et al. 2013).
Figure 8.
Figure 8.. Choriodecidual T cells from women with preterm or term labor respond to maternal and fetal antigens.
(A) Experimental design showing the collection of matched maternal peripheral blood and umbilical cord blood from women with term (n = 4) or preterm (n = 5) labor to generate maternal or fetal antigens, respectively. Choriodecidual CD14+ cells, derived from the chorioamniotic membranes of the same women from whom maternal blood and cord blood were obtained, underwent in vitro differentiation into dendritic cells (DCs). Subsequently, these DCs were loaded with either maternal or fetal antigens. The antigen-loaded DCs were then co-cultured with choriodecidual T cells isolated from the same women, and T-cell phenotyping was performed to assess markers of proliferation and activation. (B) Proportions of term labor (blue) or preterm labor (red) cases with increased CD4+Ki67+ T cells or increased CD8+Ki67+ T cells in response to maternal antigens. (C) Proportions of term labor (blue) or preterm labor (red) cases with increased CD4+Ki67+ T cells or increased CD8+Ki67+ T cells in response to fetal antigens. Representative flow cytometry gates/histograms showing the expression of proliferation (Ki67) and activation (granzyme B, TNF, IFNγ) markers by (D) CD4+ T cells and (E) CD8+ T cells in response to maternal antigen stimulation. Frontmost histogram peaks shown in dark grey correspond to isotype control, and rearmost histogram peaks shown in light grey correspond to the positive control.

Similar articles

Cited by

References

    1. Aluvihare VR, Kallikourdis M, and Betz AG. 2004. Regulatory T cells mediate maternal tolerance to the fetus. Nat Immunol 5: 266–271. - PubMed
    1. Zenclussen AC, Gerlof K, Zenclussen ML, Sollwedel A, Bertoja AZ, Ritter T, Kotsch K, Leber J, and Volk HD. 2005. Abnormal T-cell reactivity against paternal antigens in spontaneous abortion: adoptive transfer of pregnancy-induced CD4+CD25+ T regulatory cells prevents fetal rejection in a murine abortion model. Am J Pathol 166: 811–822. - PMC - PubMed
    1. Mold JE, Michaelsson J, Burt TD, Muench MO, Beckerman KP, Busch MP, Lee TH, Nixon DF, and McCune JM. 2008. Maternal alloantigens promote the development of tolerogenic fetal regulatory T cells in utero. Science 322: 1562–1565. - PMC - PubMed
    1. Robertson SA, Guerin LR, Moldenhauer LM, and Hayball JD. 2009. Activating T regulatory cells for tolerance in early pregnancy - the contribution of seminal fluid. J Reprod Immunol 83: 109–116. - PubMed
    1. Shima T, Sasaki Y, Itoh M, Nakashima A, Ishii N, Sugamura K, and Saito S. 2010. Regulatory T cells are necessary for implantation and maintenance of early pregnancy but not late pregnancy in allogeneic mice. J Reprod Immunol 85: 121–129. - PubMed

Publication types

Substances

LinkOut - more resources