. 2023 Sep;9(35):eadi4029.
doi: 10.1126/sciadv.adi4029. Epub 2023 Aug 30.

Leaf metabolic traits reveal hidden dimensions of plant form and function

Affiliations

Leaf metabolic traits reveal hidden dimensions of plant form and function

Tom W N Walker et al. Sci Adv. 2023 Sep.

Abstract

The metabolome is the biochemical basis of plant form and function, but we know little about its macroecological variation across the plant kingdom. Here, we used the plant functional trait concept to interpret leaf metabolome variation among 457 tropical and 339 temperate plant species. Distilling metabolite chemistry into five metabolic functional traits reveals that plants vary on two major axes of leaf metabolic specialization-a leaf chemical defense spectrum and an expression of leaf longevity. Axes are similar for tropical and temperate species, with many trait combinations being viable. However, metabolic traits vary orthogonally to life-history strategies described by widely used functional traits. The metabolome thus expands the functional trait concept by providing additional axes of metabolic specialization for examining plant form and function.


Figures
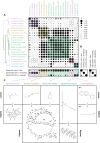
Fig. 1.
Fig. 1.. Variation in leaf metabolite chemistry can be captured by five chemical properties.
(A) Coefficients for Pearson correlations among 21 chemical properties (table S1) of identified annotated metabolites detected in tropical and temperate datasets (N = 4292). Properties are ordered on the basis of correlation similarity (hierarchical clustering; Ward), with colors separating distinct clusters of properties (maximal silhouette width: K = 5). The bottom panel shows correlations between chemical properties and scores from the first three axes of a PCA performed on a subset of five properties, as well as (B) between subset PC scores and either scores from a PCA performed on all 21 properties (left) or metabolite positions on the first three axes of ChemGPS-NP (31) space (right panel). Circle sizes indicate coefficient strengths, while fills discriminate between positive (black) and negative (white) correlations. (C) Chemical properties selected to represent each cluster, alongside chemical graphs of metabolites with the lowest and highest values for each trait.
Fig. 2.
Fig. 2.. Variation among and within eight metabolite families is described by five chemical properties.
Biplots of PC1 scores and (A) PC2 scores or (B) PC3 scores from a PCA describing variation in five selected chemical properties (C hybridization, H-bond acceptors, molecular weight, polarity, and aromatic atoms) among all annotated leaf metabolites detected in 862 plant species (N = 4292; line ends: metabolites; centroids: means). The PCA is functionally equivalent to a PCA containing all 21 chemical properties (see main text), with axes separating leaf metabolites based on size (PC1), aromaticity (PC2), and a-polarity (PC3; see Fig. 1A, bottom). Colors separate metabolite families as indicated by marginal boxplot fills/labels [center: median; box: 25 to 75% quantiles; whiskers: 1.5 × IQR (interquartile range); points: outliers beyond whiskers].
Fig. 3.
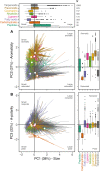
Fig. 3.. Metabolic traits describe two axes of leaf metabolic specialization among plant species.
Biplots of PC1 and PC2 scores for PCAs describing variation in five metabolic functional traits (arrows) between (A) tropical (brown; N = 457) and (B) temperate (blue; N = 339) plant species. Axes separate species based on the mean aromaticity versus polarity (inverse X log P) and carbon bond saturation (PC1) and mean size/complexity (PC2) of all annotated leaf metabolites present (Materials and Methods).
Fig. 4.
Fig. 4.. Metabolic and classical traits describe unique dimensions of plant form and function.
Correlation coefficients for pairwise Pearson correlations among metabolic (Fig. 3) and classical functional traits (fig. S1) in (A) tropical (N = 457) and (B) temperate (N = 339) species. Traits are ordered on the basis of correlation similarity (hierarchical clustering; Ward), with colors separating distinct clusters (maximal silhouette width: K = 6) and horizontal lines between matrices showing correspondence between tropical and temperate traits. Bottom panel shows correlations between traits and scores from the first four axes of a PCA of the same traits (tropical: 66%; temperate: 67%; LES, leaf economics spectrum). Circle sizes indicate coefficient strengths, while fills discriminate between positive (black) and negative (white) correlations.

References

    1. Wang S., Alseekh S., Fernie A. R., Luo J., The structure and function of major plant metabolite modifications. Mol. Plant 12, 899–919 (2019). - PubMed
    1. Faccio G., Plant complexity and cosmetic innovation. iScience 23, 101358 (2020). - PMC - PubMed
    1. Klee H. J., Tieman D. M., The genetics of fruit flavour preferences. Nat. Rev. Genet. 19, 347–356 (2018). - PubMed
    1. Schmidt B. M., Ribnicky D. M., Lipsky P. E., Raskin I., Revisiting the ancient concept of botanical therapeutics. Nat. Chem. Biol. 3, 360–366 (2007). - PubMed
    1. Sardans J., Gargallo-Garriga A., Urban O., Klem K., Walker T. W. N., Holub P., Janssens I. A., Peñuelas J., Ecometabolomics for a better understanding of plant responses and acclimation to abiotic factors linked to global change. Metabolites 10, 239 (2020). - PMC - PubMed