. 2023 Nov 1;72(11):1707-1718.
doi: 10.2337/db23-0365.

Cell-Type Composition Affects Adipose Gene Expression Associations With Cardiometabolic Traits

Affiliations

Cell-Type Composition Affects Adipose Gene Expression Associations With Cardiometabolic Traits

Sarah M Brotman et al. Diabetes. .

Abstract

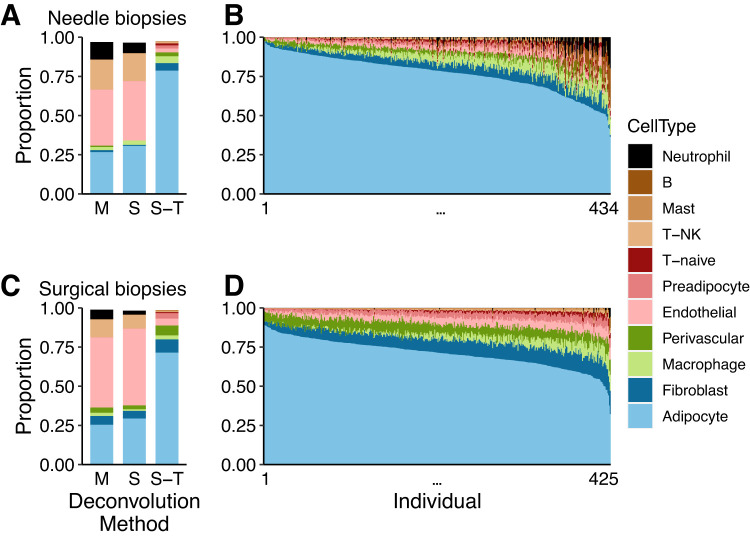
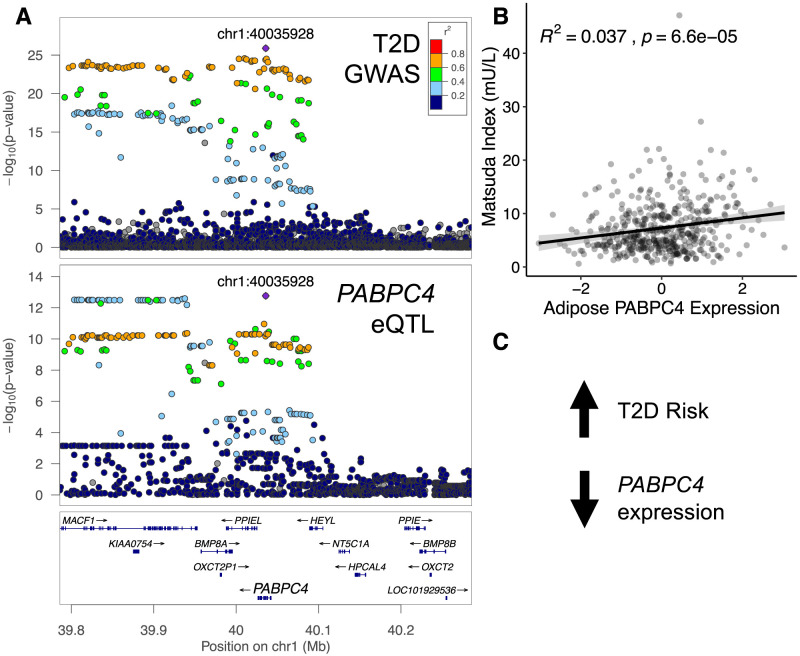
Understanding differences in adipose gene expression between individuals with different levels of clinical traits may reveal the genes and mechanisms leading to cardiometabolic diseases. However, adipose is a heterogeneous tissue. To account for cell-type heterogeneity, we estimated cell-type proportions in 859 subcutaneous adipose tissue samples with bulk RNA sequencing (RNA-seq) using a reference single-nuclear RNA-seq data set. Cell-type proportions were associated with cardiometabolic traits; for example, higher macrophage and adipocyte proportions were associated with higher and lower BMI, respectively. We evaluated cell-type proportions and BMI as covariates in tests of association between >25,000 gene expression levels and 22 cardiometabolic traits. For >95% of genes, the optimal, or best-fit, models included BMI as a covariate, and for 79% of associations, the optimal models also included cell type. After adjusting for the optimal covariates, we identified 2,664 significant associations (P ≤ 2e-6) for 1,252 genes and 14 traits. Among genes proposed to affect cardiometabolic traits based on colocalized genome-wide association study and adipose expression quantitative trait locus signals, 25 showed a corresponding association between trait and gene expression levels. Overall, these results suggest the importance of modeling cell-type proportion when identifying gene expression associations with cardiometabolic traits.


Conflict of interest statement

Duality of Interest. No potential conflicts of interest relevant to this article were reported.

Figures

None
Graphical abstract
Figure 1
Figure 1
Cell-type deconvolution of needle and surgical biopsy specimens. A: Median cell-type proportion estimates for 434 needle biopsy samples using three deconvolution strategies. M, MuSiC; S, SCDC; S-T, SCDC tree-based. Each color represents a different cell type listed in the legend. B: Cell-type proportion estimates using the SCDC tree-based deconvolution method for each sample in the needle biopsy data set. C: Median cell-type proportion estimates across 425 surgical biopsy samples using three deconvolution strategies as in A. D: Cell-type proportion estimates using the SCDC tree-based deconvolution method for each sample in the surgical biopsy data set.
Figure 2
Figure 2
Associations between cardiometabolic traits and cell-type proportions. A: Heat map of effect sizes for the associations between inverse normalized cardiometabolic traits and scaled cell-type proportions for the surgical biopsy specimens (n = 425). Each box is a β-value shown in Supplementary Table 7, with the positive effects in blue and the negative effects in red. The intensity of the color increases with increasing β-value. The boxes with an asterisk have a P-value ≤ 0.05. CHOL, cholesterol; CRP, C-reactive protein; DBP, diastolic blood pressure; FFMASS, fat-free mass; GFR, glomerular filtration rate; HIP, hip circumference; IL1RA, interleukin-1 receptor antagonist; SBP, systolic blood pressure; TG, triglyceride. B: Scatter plot of the association between BMI (y-axis) and cell-type proportion (x-axis). Each dot is an individual sample (n = 425). The top plot shows BMI vs. adipocyte proportion, and the bottom plot shows BMI vs. macrophage proportion. The linear regression lines are shown in solid color and SE CIs are shown in gray.
Figure 3
Figure 3
Optimal models for trait-gene associations based on AIC. Bars indicate the number of times each of four linear models was considered the best fit based on the lowest AIC value: adjusting for technical covariates only (light blue); adjusting for technical covariates, endothelial cells, macrophages, perivascular cells, and B cells (pink); adjusting for technical covariates and BMI (blue); adjusting for technical covariates, BMI, and the four cell types (red). Trait-gene associations were only counted if they were significant in at least one model (P ≤ 2e-6), and each trait-gene association was counted only once.
Figure 4
Figure 4
Significant trait-gene associations by trait. On the left, heat maps show the number of genes with a significant association (P ≤ 2e−6) for each cardiometabolic trait based on a linear model adjusting for BMI and cell-type proportions. The columns represent each data set: needle biopsy specimens (N), surgical biopsy specimens (S), and meta-analysis (Meta). Higher color intensity corresponds to a larger number of associations, and only traits with at least 25 significant associations are shown. Boxes to the right show the six traits with the largest number of significant associations, in columns corresponding to the direction of effect, with the numbers of genes shown in parentheses. The 10 genes with the strongest effects (βs) are listed, and genes associated with more than one trait are shown in bold. For the left columns, higher gene expression corresponds to higher trait values (positive β). For the right columns, higher gene expression corresponds to lower trait value (negative β). FFMASS, fat-free mass; TG, triglyceride.
Figure 5
Figure 5
GWAS-eQTL colocalization supported by trait-gene association at PABPC4. A: LocusZoom plots for a T2D GWAS signal (top; Mahajan et al. 2018 [49]) colocalized with the PABPC4 eQTL signal in adipose tissue (bottom; Raulerson et al. 2019 [25]). The colors represent the pairwise linkage disequilibrium (LD) with the lead GWAS variant (purple diamond); red indicates high LD (r2 > 0.8) and blue indicates low LD (r2 < 0.2). B: Scatter plot of inverse normal transformed PABPC4 expression and Matsuda index (mU/L) in the surgical biopsy samples (n = 422; 3 individuals without Matsuda index values were excluded). The linear regression line is shown in black and the SE CI is shown in gray. C: The directions of effect. Variants associated with higher risk of T2D (GWAS) are associated with lower adipose PABPC4 expression level (eQTL), and higher PABPC4 expression is associated with lower Matsuda index (shown in B).

References

    1. Abraham TM, Pedley A, Massaro JM, Hoffmann U, Fox CS.. Association between visceral and subcutaneous adipose depots and incident cardiovascular disease risk factors. Circulation 2015;132:1639–1647 - PMC - PubMed
    1. Balakumar P, Maung-U K, Jagadeesh G.. Prevalence and prevention of cardiovascular disease and diabetes mellitus. Pharmacol Res 2016;113:600–609 - PubMed
    1. Lynes MD, Tseng YH.. Deciphering adipose tissue heterogeneity. Ann N Y Acad Sci 2018;1411:5–20 - PMC - PubMed
    1. Lenz M, Arts ICW, Peeters RLM, de Kok TM, Ertaylan G.. Adipose tissue in health and disease through the lens of its building blocks. Sci Rep 2020;10:10433. - PMC - PubMed
    1. Esteve Ràfols M. Adipose tissue: cell heterogeneity and functional diversity. Endocrinol Nutr 2014;61:100–112 - PubMed

Publication types