. 2023 Nov 28;7(22):6859-6872.
doi: 10.1182/bloodadvances.2023010139.

HAPLN1 matrikine: a bone marrow homing factor linked to poor outcomes in patients with MM

Affiliations

HAPLN1 matrikine: a bone marrow homing factor linked to poor outcomes in patients with MM

Hae Yeun Chang et al. Blood Adv. .

Abstract

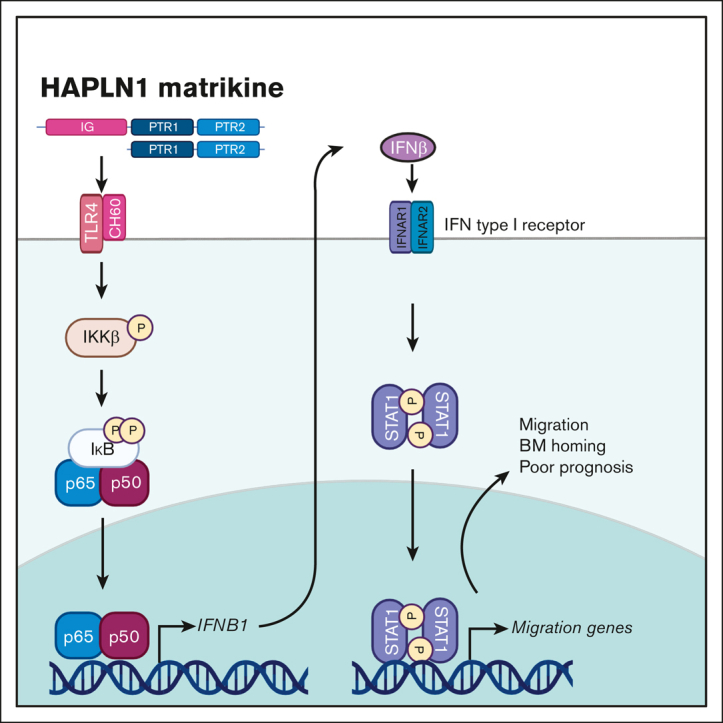
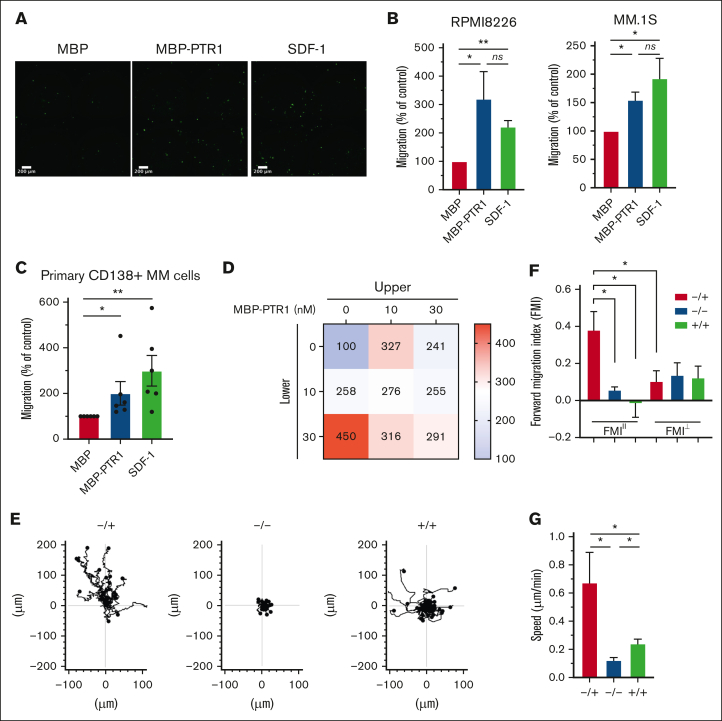
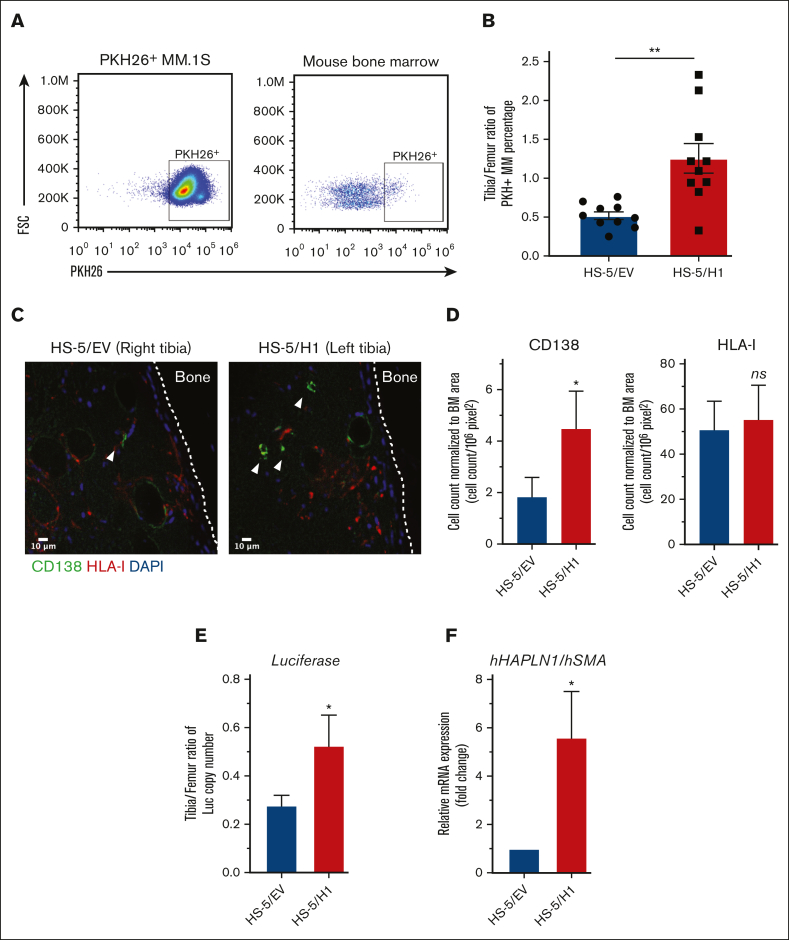
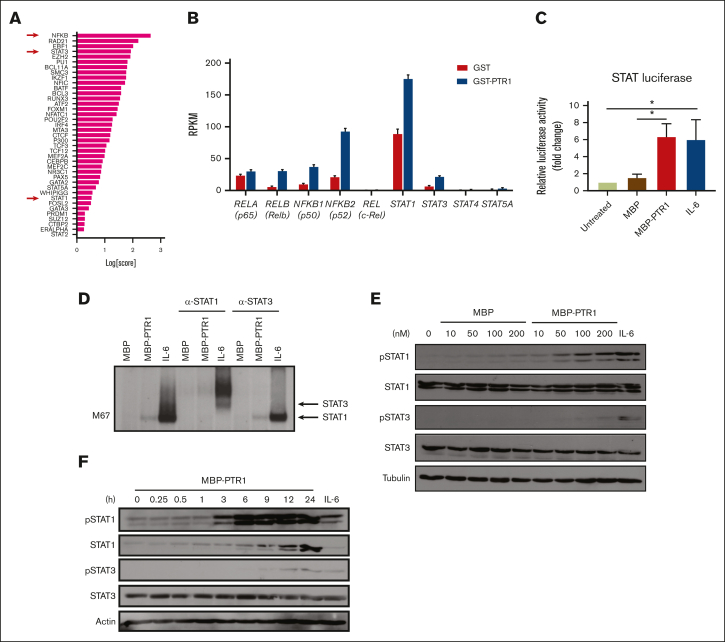
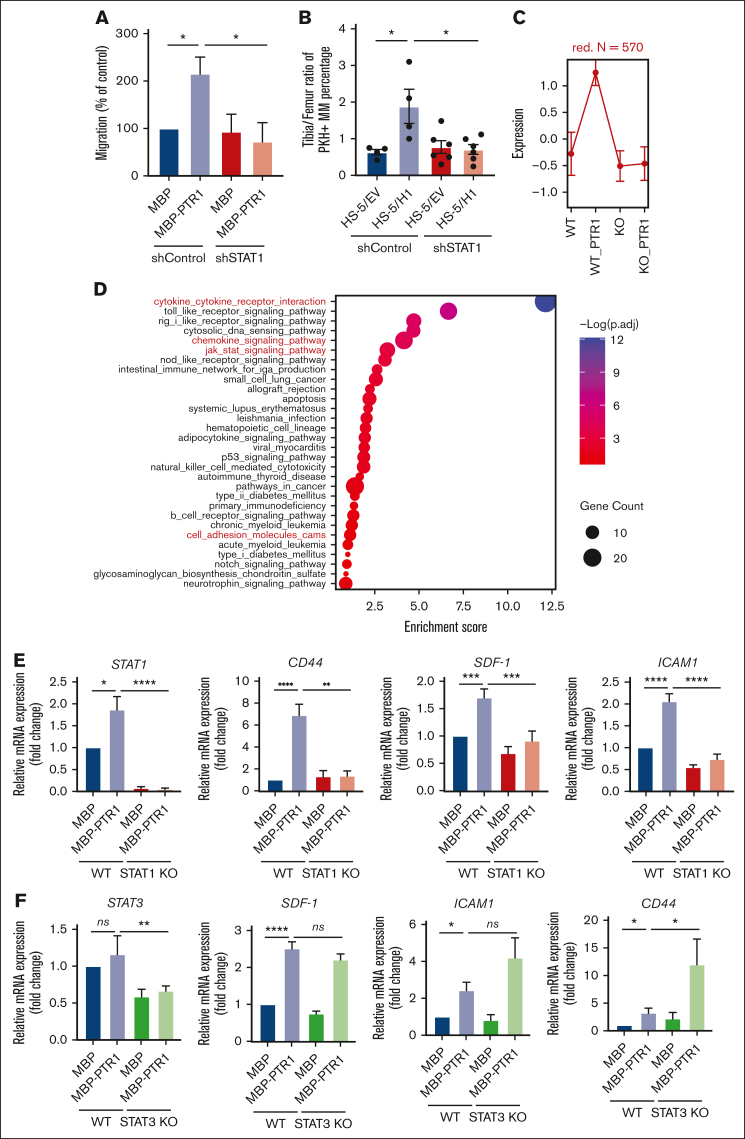
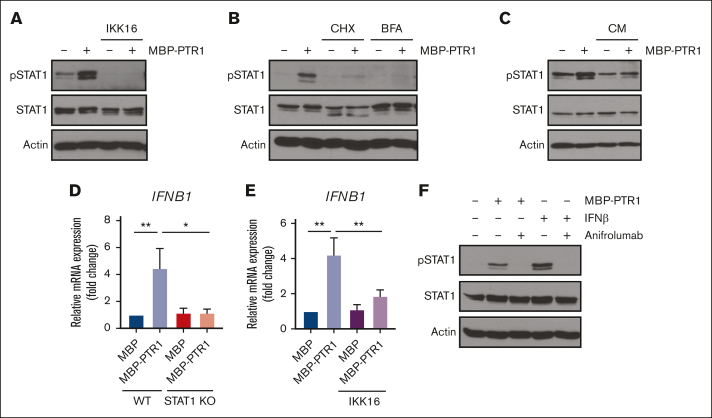
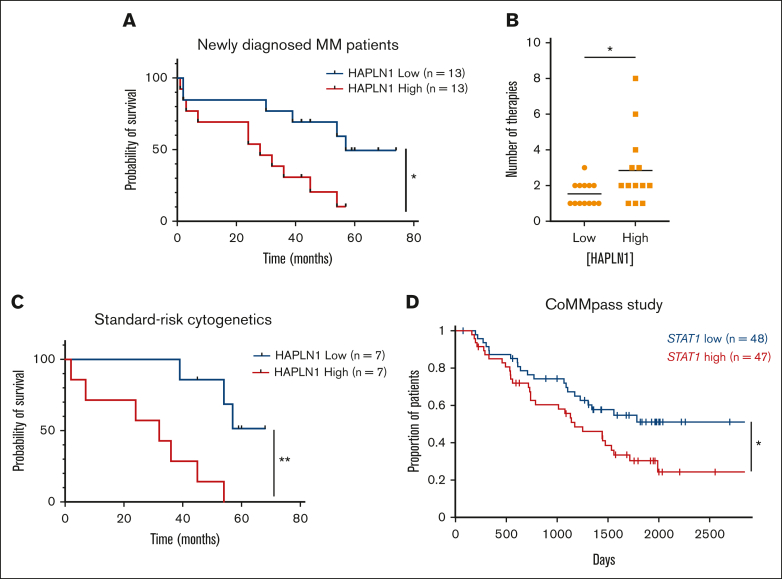
The bone marrow (BM) microenvironment is critical for dissemination, growth, and survival of multiple myeloma (MM) cells. Homing of myeloma cells to the BM niche is a crucial step in MM dissemination, but the mechanisms involved are incompletely understood. In particular, any role of matrikines, neofunctional peptides derived from extracellular matrix proteins, remains unknown. Here, we report that a matrikine derived from hyaluronan and proteoglycan link protein 1 (HAPLN1) induces MM cell adhesion to the BM stromal components, such as fibronectin, endothelial cells, and stromal cells and, furthermore, induces their chemotactic and chemokinetic migration. In a mouse xenograft model, we show that MM cells preferentially home to HAPLN1 matrikine-conditioned BM. The transcription factor STAT1 is activated by HAPLN1 matrikine and is necessary to induce MM cell adhesion, migration, migration-related genes, and BM homing. STAT1 activation is mediated by interferon beta (IFN-β), which is induced by NF-κB after stimulation by HAPLN1 matrikine. Finally, we also provide evidence that higher levels of HAPLN1 in BM samples correlate with poorer progression-free survival of patients with newly diagnosed MM. These data reveal that a matrikine present in the BM microenvironment acts as a chemoattractant, plays an important role in BM homing of MM cells via NF-κB-IFN-β-STAT1 signaling, and may help identify patients with poor outcomes. This study also provides a mechanistic rationale for targeting HAPLN1 matrikine in MM therapy.


Conflict of interest statement

Conflict-of-interest disclosure: The authors declare no competing financial interests.

Figures

None
Graphical abstract
Figure 1.
Figure 1.
HAPLN1-PTR1 induces chemotactic and chemokinetic migration in MM cells. (A) Microscopic images of RPMI8226 cells on transwell membranes that had migrated from the upper chamber to the lower chamber containing MBP or MBP-PTR1 at 100 nM or SDF-1 at 30 nM after 16 hours. (B) Graphs depicting percentage migration of RPMI8226 and MM.1S MM cells treated as in panel A with MBP control being set as 100%. (C) Graphs depicting percentage migration of CD138+ primary MM cells isolated from 6 patients in response to MBP, MBP-PTR1, or SDF-1 with MBP control being set as 100%. (D) Migration of RPMI8226 cells in response to indicated MBP-PTR1 concentrations in the upper and lower chambers were quantified with the control (0 nM) set at 100%. (E) Individual cell track trajectories of 3 groups in time-lapse μ-slide migration assay using RPMI8226 cells recorded for 16 hours are shown: positive gradient (−/+; 30 nM MBP/MBP-PTR1), negative control (−/−; 30 nM MBP/MBP), and no gradient (+/+; 30 nM MBP-PTR1/MBP-PTR1). The y-axis is parallel to the chemotactic gradient in which cell trajectory going up along the y-axis is the migration toward the MBP-PTR1 in the positive-gradient group. (F) Graphs showing the comparison of averaged FMIII and FMI for each group from panel E. (G) Graph showing the comparison of the cell speed from panel E. All experiments were independently repeated 3 times for panel D and 4 times for panels B,E-G. Data are expressed as means ± standard error of the mean (SEM). ∗P < .05; ∗∗P < .01; ns, not significant.
Figure 2.
Figure 2.
HAPLN1 matrikine induces MM cell BM homing in vivo. (A) Representative flow plots and gating strategy of PKH26+ MM.1S cells after cell culture (left) or from BM of mouse. (B) The percentage of PKH26+ MM cells in the tibia and femur of mice was obtained by flow cytometry, as in panel A, and the tibia/femur ratio of PKH26+ MM percentage was plotted. (C) Immunohistochemistry (IHC) images of tibia sections stained for MM cells (CD138, green color), HS-5 cells (HLA-I, red color) or nuclei (4′,6-diamidino-2-phenylindole [DAPI], blue color). The white dotted line indicates the outline of the cortical bone. The white arrowhead indicates CD138+ MM cells. (D) MM or HS-5 cells were counted in the imaged sections; their numbers were then normalized to the BM area from 2 to 4 sections of each tibia, averaged, and repeated for 5 mice. (E) Fifty ng of total genomic DNA collected from BM of individual mouse tibia and femur (n = 5) was used to quantify the luciferase copy number using quantitative polymerase chain reaction (qPCR) and luciferase gene standard, and the total copy number per tibia was calculated. The tibia-to-femur ratio of the luciferase copy number was plotted. (F) Total RNA was collected from above mouse tibia (n = 5) and human HAPLN1 mRNA was quantified using quantitative reverse transcription (qRT)-PCR and normalized to human SMA, and then fold changes were plotted using HS-5/EV–injected tibia set as 1. Data are expressed as means ± SEM. ∗P < .05; ∗∗P < .01; FSC, forward scatter.
Figure 3.
Figure 3.
HAPLN1 matrikine activates STAT1 in MM cells. (A) The graph depicts Mining Algorithm for GenetIc Controllers–identified enrichment scores of transcription factors and cofactors in response to PTR1 treatment in RPMI8226 cells. (B) Reads per kilobase million values of indicated genes from the RNA-seq results are plotted. (C) STAT-dependent luciferase reporter activities on RPMI8226 cells with the indicated stimuli are shown. The graph depicts the mean ± SEM of the quantification of 3 independent replicates. (D) Representative STAT1 and STAT3 supershift analysis of RPMI8226 cells incubated with MBP or MBP-PTR1 (100 nM; 6 hours) or IL-6 (50 ng/mL; 15 minutes). (E-F) Representative western blot analysis on RPMI8226 cells treated with the indicated dose of MBP or MBP-PTR1 for 6 hours (E) or 100 nM MBP-PTR1 for the indicated time (F). ∗P < .05.
Figure 4.
Figure 4.
STAT1 is required for HAPLN1 matrikine–induced MM cell migration and BM homing. (A) Graphs depicting the percentage migration of MM.1S shControl or shSTAT1 clones in response to MBP or MBP-PTR1, with MBP-treated shControl being set as 100%. (B) The tibia-to-femur ratio of PKH26+ MM percentage was plotted as in Figure 2B. (C) Graph depicting the normalized expression of genes in the red cluster. Data are expressed as mean ± SD. (D) The dot plot represents the enrichment scores of the top 30 pathways in which the size of dot indicates the number of genes enriched for each pathway, and the color intensity correlates with the adjusted P. See “Methods” for enrichment score calculations. (E-F) mRNA levels of indicated genes was quantified using qRT-PCR and normalized to glyceraldehyde-3-phosphatedehydrogenase (GAPDH) and fold change relative to control (MBP in wild-type [WT] cells) were plotted. The graph represents the means ± SEM of 5 biological replicates for panel E and 3 biological replicates for panel F, each performed in duplicates. ∗P < .05; ∗∗P < .01; ∗∗∗P < .001; ∗∗∗∗P < .0001.
Figure 5.
Figure 5.
Autocrine/paracrine production of IFN-β by NF-κB contributes to HAPLN1 matrikine–induced STAT1 activation. (A) Representative western blot analysis of indicated proteins in RPMI8226 cells pretreated with IKK16 (10 μM) or dimethyl sulfoxide (DMSO) for 10 minutes and stimulated with 100 nM of MBP or MBP-PTR1 for 6 hours. (B) Representative western blot analysis of indicated proteins in RPMI8226 cells pretreated for 10 minutes with cycloheximide (CHX; 20 μg/mL) or brefeldin A (BFA; 3 μg/mL) and stimulated with 100 nM of MBP or MBP-PTR1 for 6 hours. (C) RPMI8226 cells were stimulated with 100 nM of MBP or MBP-PTR1 for 6 hours (lane 1 and 2). RPMI8226 cells were stimulated with 100 nM of MBP or MBP-PTR1 for 5 hours and subsequently washed with fresh media. Conditioned medium (CM) was harvested after a 1-hour incubation of fresh media without MBP or MBP-PTR1. CM was added to fresh RPMI8226 cells for 15 minutes (lane 3 and 4) and analyzed using western blotting for the indicated proteins. (D) RPMI8226 (WT and STAT1 KO) cells were stimulated with 100 nM of MBP or MBP-PTR1 for 6 hours. The IFNB1 mRNA level was quantified using qRT-PCR and normalized to GAPDH and fold change relative to control (MBP in WT cells) was plotted. (E) RPMI8226 cells were treated as in panel A. The mRNA level of IFNB1 was quantified using qRT-PCR and normalized to GAPDH and fold change relative to control (MBP and DMSO treated cells) was plotted. (F) Representative western blot analysis of indicated proteins in RPMI8226 cells pretreated with 10 μg/mL of anifrolumab or human immunoglobulin G (IgG) for 10 minutes and stimulated with 100 nM of MBP or MBP-PTR1 for 6 hours or IFN-β (50 pg/mL) for 15 minutes. The graph represents the means ± SEM of 3 biological replicates for panels D-E, each performed in duplicates. ∗P < .05, ∗∗P < .01.
Figure 6.
Figure 6.
High HAPLN1 levels in BM plasma fractions and high STAT1 mRNA levels in MM cells correlate with poor prognosis of patients with NDMM. (A) Kaplan-Meier PFS curve of the HAPLN1 high and low groups (n = 26). (B) Graph depicting the number of therapies that patients with NDMM received during the follow-up. (C) Kaplan-Meier PFS curve of patients at standard cytogenetic risk (n = 14). (D) Kaplan-Meier PFS curve of STAT1 high and low groups from the CoMMpass study. ∗P < .05; ∗∗P < .01.

Similar articles

References

    1. Shain K. Metastatic myeloma? Blood. 2012;119(24):5612–5613. - PubMed
    1. Hideshima T, Mitsiades C, Tonon G, Richardson PG, Anderson KC. Understanding multiple myeloma pathogenesis in the bone marrow to identify new therapeutic targets. Nat Rev Cancer. 2007;7(8):585–598. - PubMed
    1. Manier S, Sacco A, Leleu X, Ghobrial IM, Roccaro AM. Bone marrow microenvironment in multiple myeloma progression. J Biomed Biotechnol. 2012;2012(6):157496. 157495. - PMC - PubMed
    1. Alsayed Y, Ngo H, Runnels J, et al. Mechanisms of regulation of CXCR4/SDF-1 (CXCL12)-dependent migration and homing in multiple myeloma. Blood. 2007;109(7):2708–2717. - PMC - PubMed
    1. Roccaro AM, Sacco A, Purschke WG, et al. SDF-1 inhibition targets the bone marrow niche for cancer therapy. Cell Rep. 2014;9(1):118–128. - PMC - PubMed

Publication types