. 2023 Oct 30;196(1):112-125.
doi: 10.1093/toxsci/kfad085.

A systems approach reveals species differences in hepatic stress response capacity

Affiliations

A systems approach reveals species differences in hepatic stress response capacity

Giusy Russomanno et al. Toxicol Sci. .

Abstract

To minimize the occurrence of unexpected toxicities in early phase preclinical studies of new drugs, it is vital to understand fundamental similarities and differences between preclinical species and humans. Species differences in sensitivity to acetaminophen (APAP) liver injury have been related to differences in the fraction of the drug that is bioactivated to the reactive metabolite N-acetyl-p-benzoquinoneimine (NAPQI). We have used physiologically based pharmacokinetic modeling to identify oral doses of APAP (300 and 1000 mg/kg in mice and rats, respectively) yielding similar hepatic burdens of NAPQI to enable the comparison of temporal liver tissue responses under conditions of equivalent chemical insult. Despite pharmacokinetic and biochemical verification of the equivalent NAPQI insult, serum biomarker and tissue histopathology analyses revealed that mice still exhibited a greater degree of liver injury than rats. Transcriptomic and proteomic analyses highlighted the stronger activation of stress response pathways (including the Nrf2 oxidative stress response and autophagy) in the livers of rats, indicative of a more robust transcriptional adaptation to the equivalent insult. Components of these pathways were also found to be expressed at a higher basal level in the livers of rats compared with both mice and humans. Our findings exemplify a systems approach to understanding differential species sensitivity to hepatotoxicity. Multiomics analysis indicated that rats possess a greater basal and adaptive capacity for hepatic stress responses than mice and humans, with important implications for species selection and human translation in the safety testing of new drug candidates associated with reactive metabolite formation.

Keywords: acetaminophen; liver injury; oxidative stress; preclinical species.


Figures

Figure 1.
Figure 1.
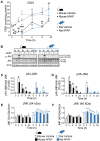
Hepatocellular injury after equivalent hepatic NAPQI burden occurs more quickly and to a greater magnitude in mice compared with rats. A, Oral equivalent doses (OEDs) of APAP derived from PBPK model simulations predicted to give similar levels of total hepatic NAPQI burden in mice (300 mg/kg) and rats (1000 mg/kg). Liver injury serum markers (ALT [B], AST [C] and total bilirubin [TBIL, D]) and hepatocellular degeneration/necrosis (E) in mice and rats exposed to 300 and 1000 mg/kg APAP, respectively. Values are mean±SD (n = 5). p Values are denoted as #p < .05, and ##p < .01 (APAP-treated against time-matched control animals) or *p < .05, and **p < .01 (APAP-treated mice vs rats, Mann-Whitney U test). E, Representative HES images, scale bar = 100 μm.
Figure 2.
Figure 2.
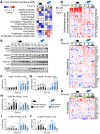
Confirmation of equivalent chemical insult in mice and rats. A, Total hepatic GSH in mice and rats exposed to 300 and 1000 mg/kg APAP respectively. Dotted lines indicate vehicle control animals. Values are mean±SD (n = 5–12). B, APAP-induced phosphorylation of JNK at Tyr185 (p56) and Thr183 (p46). Samples are pooled from 5 animals per time point. Uncropped blots are shown in Supplementary Figure 7. C–F, Densitometric analysis of immunoblots. Values are mean±SD (n = 4). Unpaired t test or Mann-Whitney U test, as appropriate. p Values are denoted as *p < .05, **p < .01, and ***p < .001 (mouse vs rat for each condition/time point), or #p < .05, ##p < .01, and ####p < .0001 (APAP-treated animals vs vehicle controls).
Figure 3.
Figure 3.
Transcriptomic analysis reveals a more robust activation of adaptive stress response pathways in the liver of APAP-treated rats, compared with mice. A, Number of genes that were uniquely responsive to APAP in mice and rat (black and blue bars, respectively; padj < .01, fold change >1.5 or <−1.5, comparison against time matched vehicle controls). Stacked grey bars indicate DEGs in common between the 2 species. GSEA at (B) 3, (C) 6, and (D) 9 h after APAP treatment. Bars represent normalized enrichment scores (NES) of selected GO terms for both species. Individual GO terms (padj < .05) were clustered into parent terms. The bar is missing for nonsignificant GO terms. Red squares represent −log10 of padj.
Figure 4.
Figure 4.
Rats show a more robust overall transcriptional response to equivalent NAPQI insult than mice. A, WGCNA average absolute EGs in APAP-treated mice and rats. B, Correlation plots of module EGs at the indicated time points. Pearson correlation coefficient (r) and p value for each comparison are shown. EGs for relevant modules that are higher in mouse are depicted in black (LIVER:237, negative regulation of cell proliferation; LIVER:313, leukocyte activation; LIVER:15, cell death), whereas those higher in rat are depicted in blue (LIVER:108, LIVER:101, and LIVER:49, oxidative stress response; LIVER:176, endoplasmic reticulum stress response; LIVER:223, LIVER:2, and LIVER:296, autophagy). C, EGs comparison across species for selected modules.
Figure 5.
Figure 5.
Proteomic analysis corroborates the more robust activation of adaptive stress response pathways in the liver of APAP-treated rats, compared with mice. A, Comparative toxicity analysis in the liver of APAP-treated animals (n = 5, SWATH proteomics). Heatmap plots showing changes in the expression of proteins involved in (B) inflammatory and immune responses, (C) Nrf2-signalling, and (D) autophagy (log2 fold-change vs time-matched vehicle control animals). E, Protein expression levels of NQO1, HMOX1, SQSTM1, LC3B-I, and -II. Samples are pooled from 5 animals per time point. Uncropped blots are shown in Supplementary Figure 7. F–J, Densitometric analysis of immunoblots. Protein levels were normalized to β-actin. Values are mean±SD (n = 5). Mann-Whitney U test. p Values are denoted as *p < .05, and **p < .01 (mouse vs rat for each condition/time point), or #p < .05, and ##p < .01 (APAP-treated animals vs vehicle controls).
Figure 6.
Figure 6.
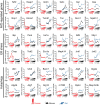
Higher basal expression levels of stress response pathway genes in the liver of rats, compared with mice and humans. Differences between species in the basal expression of Nrf2 genes and genes modulating endoplasmic reticulum (ER) stress and autophagy from birth to adulthood. mRNA levels are expressed as reads per kilo base per million (RPKM)±SD (Cardoso-Moreira et al., 2019).
Figure 7.
Figure 7.
Higher basal expression levels of stress response pathway proteins in the liver of rats, compared with mice. Heatmaps showing rank-binned basal expression levels of proteins associated with the (A) Nrf2 and (B) autophagy responses in the livers of untreated animals (0 h controls, n = 5/species). Proteins with the lowest abundance were assigned to bin 1, and those with the highest to bin 10. A bin value of 0 (depicted in white) was assigned to proteins that were not detected. The difference among consecutive bins is 1.49 ± 0.16 (log2 expression).
Figure 8.
Figure 8.
Confirmation of species differences in basal capacities of the Nrf2 and autophagy pathways. A, Protein expression levels and B, densitometric analysis of GCLM, GCLC, NQO1, HMOX1, SQSTM1, JNK, and LC3B isoforms I and II in liver tissue collected from patients undergoing liver resections (n = 8) or untreated mice (n = 3) and rats (n = 3). Protein levels were normalized to β-actin. Values are mean±SD. One-way ANOVA or Kruskal-Wallis test, as appropriate. p Values are denoted as *p < .05, **p < .01, and ****p < .0001, comparison as indicated.

Similar articles

Cited by

References

    1. Aithal G. P. (2010). Mind the gap. Altern. Lab. Anim. 38(Suppl. 1), 1–4. - PubMed
    1. Ashburner M., Ball C. A., Blake J. A., Botstein D., Butler H., Cherry J. M., Davis A. P., Dolinski K., Dwight S. S., Eppig J. T., et al. (2000). Gene ontology: Tool for the unification of biology. The Gene Ontology Consortium. Nat. Genet. 25, 25–29. - PMC - PubMed
    1. Bernal W., Auzinger G., Dhawan A., Wendon J. (2010). Acute liver failure. Lancet 376, 190–201. - PubMed
    1. Boobis A. R., Tee L. B., Hampden C. E., Davies D. S. (1986). Freshly isolated hepatocytes as a model for studying the toxicity of paracetamol. Food Chem. Toxicol. 24, 731–736. - PubMed
    1. Cardoso-Moreira M., Halbert J., Valloton D., Velten B., Chen C., Shao Y., Liechti A., Ascencao K., Rummel C., Ovchinnikova S., et al. (2019). Gene expression across mammalian organ development. Nature 571, 505–509. - PMC - PubMed