. 2023 Dec 14;142(24):2055-2068.
doi: 10.1182/blood.2023020118.

The effects of pathogenic and likely pathogenic variants for inherited hemostasis disorders in 140 214 UK Biobank participants

Affiliations

The effects of pathogenic and likely pathogenic variants for inherited hemostasis disorders in 140 214 UK Biobank participants

Luca Stefanucci et al. Blood. .

Abstract

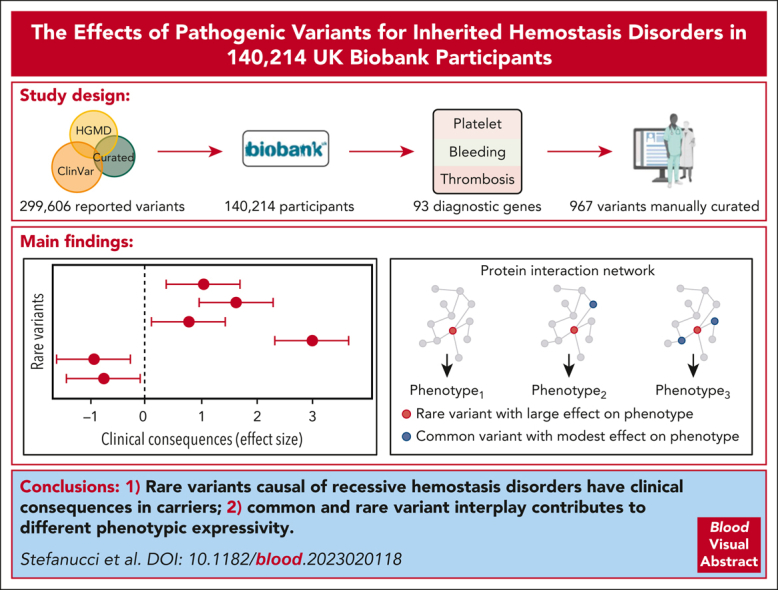
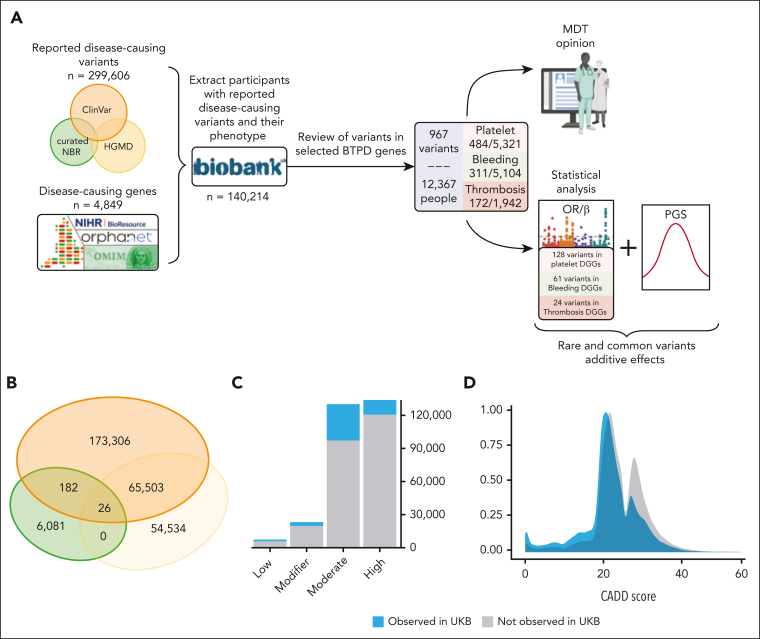
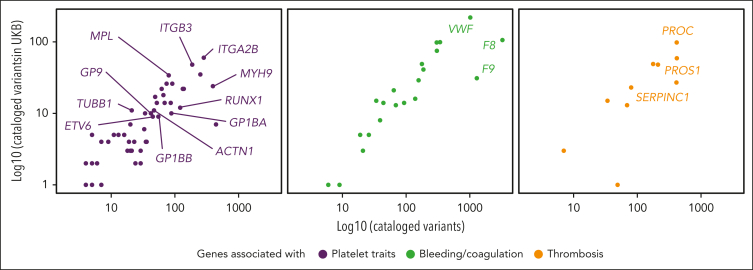
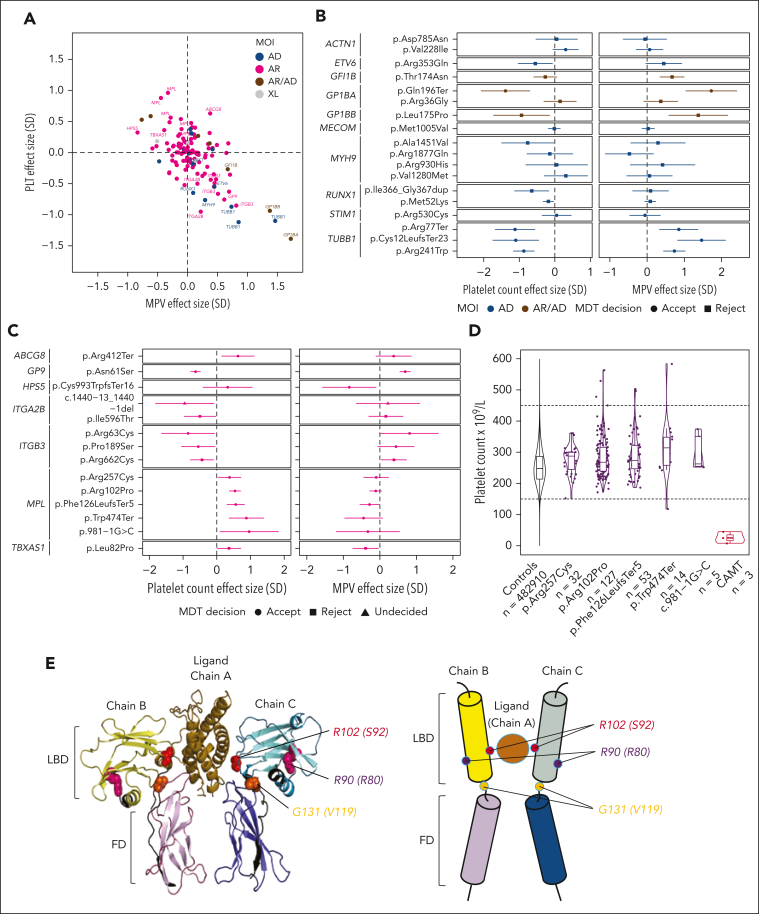
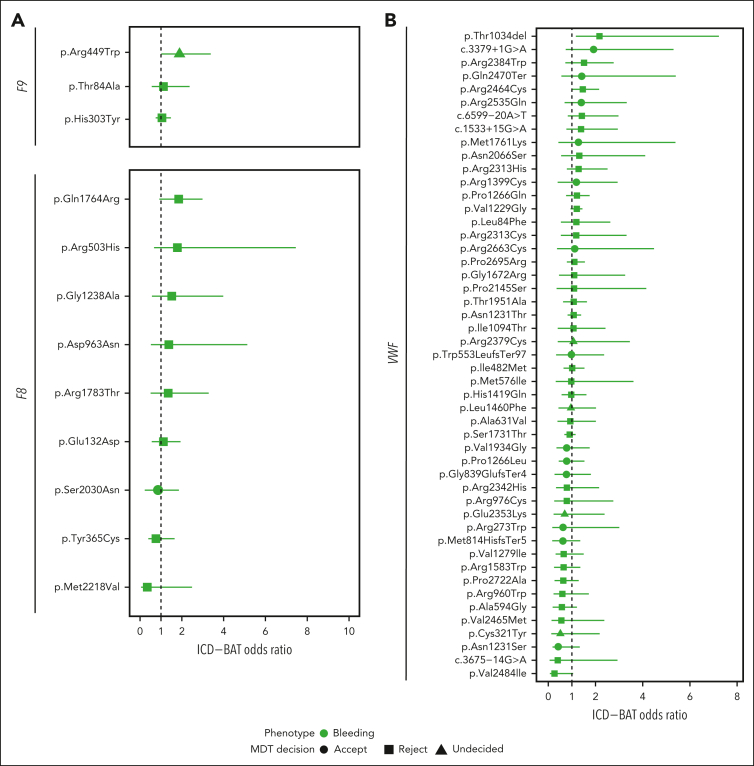
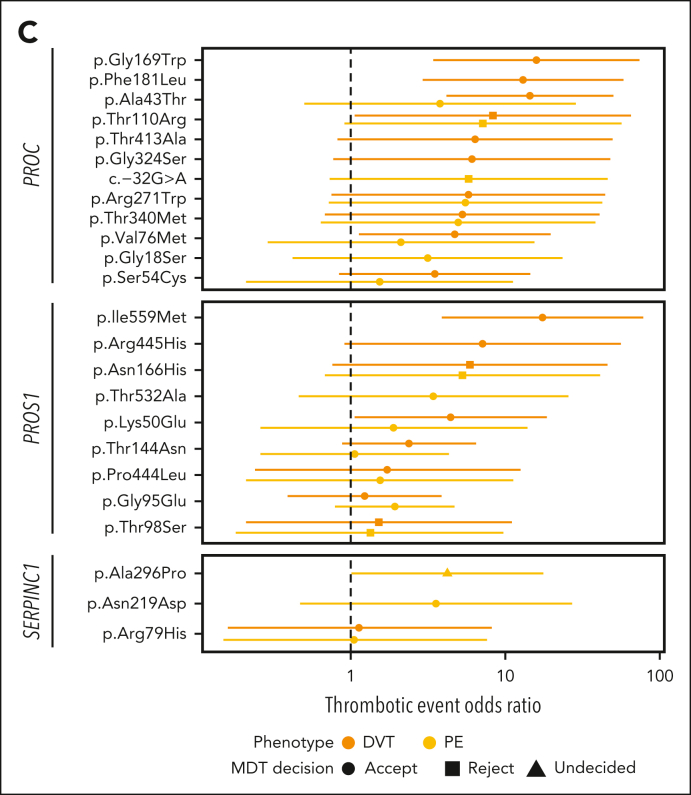
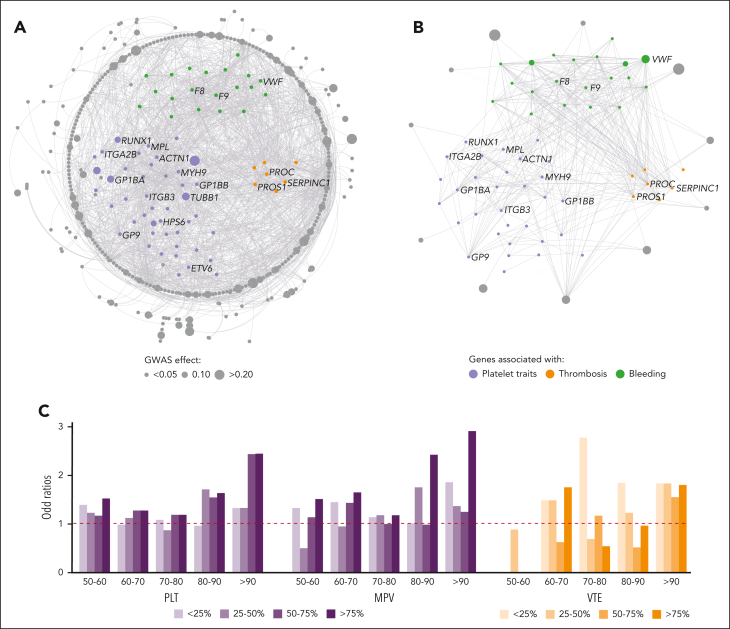
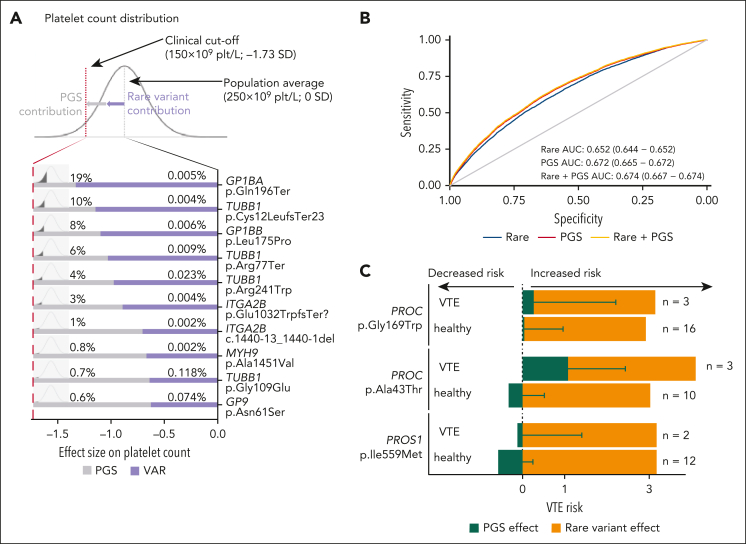
Rare genetic diseases affect millions, and identifying causal DNA variants is essential for patient care. Therefore, it is imperative to estimate the effect of each independent variant and improve their pathogenicity classification. Our study of 140 214 unrelated UK Biobank (UKB) participants found that each of them carries a median of 7 variants previously reported as pathogenic or likely pathogenic. We focused on 967 diagnostic-grade gene (DGG) variants for rare bleeding, thrombotic, and platelet disorders (BTPDs) observed in 12 367 UKB participants. By association analysis, for a subset of these variants, we estimated effect sizes for platelet count and volume, and odds ratios for bleeding and thrombosis. Variants causal of some autosomal recessive platelet disorders revealed phenotypic consequences in carriers. Loss-of-function variants in MPL, which cause chronic amegakaryocytic thrombocytopenia if biallelic, were unexpectedly associated with increased platelet counts in carriers. We also demonstrated that common variants identified by genome-wide association studies (GWAS) for platelet count or thrombosis risk may influence the penetrance of rare variants in BTPD DGGs on their associated hemostasis disorders. Network-propagation analysis applied to an interactome of 18 410 nodes and 571 917 edges showed that GWAS variants with large effect sizes are enriched in DGGs and their first-order interactors. Finally, we illustrate the modifying effect of polygenic scores for platelet count and thrombosis risk on disease severity in participants carrying rare variants in TUBB1 or PROC and PROS1, respectively. Our findings demonstrate the power of association analyses using large population datasets in improving pathogenicity classifications of rare variants.


Conflict of interest statement

Conflict-of-interest disclosure: O.S.B., Q.W., K.C., P.P., K.M., and S.P. are current AstraZeneca employees and/or stockholders. L. Sun is a full-time employee at Regeneron Genetics Center, LLC. The remaining authors declare no competing financial interests.

The current affiliation for P.P. is R&D Data Office, Data Science and Artificial Intelligence, BioPharmaceuticals R&D, AstraZeneca, Cambridge, United Kingdom.

The current affiliation for K.M. is Centre for Genomics Research, Discovery Sciences, BioPharmaceuticals R&D, AstraZeneca, Cambridge, United Kingdom.

A complete list of the members of the NIHR BioResource Consortium appears in the supplemental Material.

Figures

None
Graphical abstract
Figure 1.
Figure 1.
Diagram of the workflow and a high-level summary of variants analyzed. (A) Visual depiction of project workflow showing the selection and filtering steps adopted to generate the catalog of BTPD variants used in the MDT review and the statistical analysis of UKB exome data set (“Methods”); from left to right: the online sources used to retrieve gene and variant information; the number of UKB participants available for inclusion in the study; the number of BTPD variants and the number of UKB participants carrying a BTPD variant; review of BTPD variants for pathogenicity by MDTs and used for association analysis to estimate effect sizes and ORs. Of the 967 BTPD variants, 213 (22%) had sufficient UKB carriers to perform an association analysis (“Methods”). Altogether, we estimated effect sizes for 128 variants in platelet disorder DGGs associated with platelet count and volume, ORs for 67 of these variants and for 61 variants in the coagulation genes F8/F9/VWF on bleeding, and ORs for 24 variants in thrombotic disorder genes PROC/PROS1/SERPINC1 on VTE (supplemental Table 4). (B) Venn diagram showing the overlap for variant pathogenicity labels between the resources with ClinVar (orange), HGMD (yellow), and NIHR BioResource (green). (C) VEP-calculated functional impacts of the 299 606 pathogenic and likely pathogenic variants, subclassified according to whether they were observed or not in the UKB study population. x-axis: variants grouped according to their impact on protein function (“Methods”), ranging from low (eg, synonymous single nucleotide variants [SNV]), modifier, moderate to high impact (eg, premature stop). y-axis: number of unique variants in each functional effect category. In gray are the variants not observed in UKB, and in blue those observed. (D) CADD (PHRED) scores for the pathogenic and likely pathogenic variants: CADD score distribution for all cataloged-variants in gray and for the subset observed in UKB participants in blue. y-axis: relative density.
Figure 2.
Figure 2.
Number of pathogenic and likely pathogenic variants per BTPD gene. Scatter plots show the number of cataloged-variants per BTPD gene retrieved from the resources (x-axis) vs the ones observed in UKB participants (y-axis). The BTPD genes are categorized according to whether they are associated with platelet (purple), bleeding and coagulation (green) and thrombotic (orange) disorders. HUGO Gene Nomenclature Committee (HGNC) gene symbols label key genes flagged in the results. x- and y-axis are logarithmic scaled.
Figure 3.
Figure 3.
Effect sizes for variants in platelet disorder genes and MPL structure. (A) Effect sizes (in SD) for the platelet count (PLT) and MPV in carriers of 128 BPTD-variants present in at least 5 unrelated European UKB participants; 24 variants labeled by HGNC gene symbol have a significant effect on PLT and/or MPV (P < .05). Variants are color-coded by MOI for the associated platelet disorder: AD, autosomal dominant; AR, autosomal recessive; XL, X-linked inheritance. (B) Effect sizes in SD with 95% confidence intervals (CI) for platelet count and MPV associated with 19 cataloged-variants for AD thrombocytopenia disorders, of which 10 have significant effects (P < .05). Variants with AD MOI are in blue and AD/AR in brown. MDT decision is indicated by circles and squares for accept and reject, respectively. (C) Effect sizes in SD with 95% CI values for platelet count and MPV that are significantly associated with 14 cataloged-variants for AR platelet disorders (P < .05). Circles, squares and triangles indicate MDT decisions for accept, reject and undecided, respectively. (D) Violin plots with platelet count distributions of UKB controls (black), carriers of 1 of 5 CAMT-causing MPL variants that were associated with a significant increase in platelet count (purple) and patients with CAMT (red); each point represents a unique UKB individual, except for the CAMT cases for whom platelet count values were retrieved from the NIHR BioResource study database. (E) Probable structure of the MPL receptor and its ligand thrombopoietin (TPO), as represented by the 3D structure of the highly homologous erythropoietin receptor (EPOR, chains B and C) and bound erythropoietin (EPO, chain A) from the Protein Data Bank (PDB) entry “1EER,” which is the best available model for the impact of MPL residue changes. Left: PyMOL image of the 1eer structure with 3 variants shown in spacefill on chains B and C. Two are possible LoF variants, Arg102Pro, labeled R102 on chain C and shown in red, and Gly131Ser, labeled G131, orange; and 1 predicted as benign, Arg90Gln, labeled R90, magenta. In brackets are the residue numbers in the “1EER”structure. Right: schematic representation of the complex, with the same colors for the domains and variants (small, colored circles). Additional variants with possible functional consequences and which, like the LoF variant Gly131Ser, are highly conserved and occur in the linker region between the domains are: Pro136Arg, Pro136His and Gly131Ser (not shown). FD, fibronectin type III domain; LBD, ligand-binding domain.
Figure 4.
Figure 4.
ORs of hematological phenotypes for coagulation and thrombotic genes. (A) Risk of increased ICD-BAT score, as a measure of bleeding, in female UKB carriers of BPTD-variants in F9(NM_000133.3) (n = 3) and F8(NM_000132.3) (n = 9). (B) Risk of increased ICD-BAT score in UKB carriers 49 BPTD-variants in VWF(NM_000552.3). (C) Risk of deep vein thrombosis (DVT; dark orange), or pulmonary embolism (PE; yellow) in UKB carriers of BPTD-variants in PROC(NM_000312.3) (n = 12), PROS1(NM_000313.3) (n = 9), and SERPINC1(NM_000488.3) (n = 3). The risk is given as an OR, with 95% CIs. MDT decision is indicated by circles, squares and triangles for accept, reject and undecided, respectively.
Figure 4.
Figure 4.
ORs of hematological phenotypes for coagulation and thrombotic genes. (A) Risk of increased ICD-BAT score, as a measure of bleeding, in female UKB carriers of BPTD-variants in F9(NM_000133.3) (n = 3) and F8(NM_000132.3) (n = 9). (B) Risk of increased ICD-BAT score in UKB carriers 49 BPTD-variants in VWF(NM_000552.3). (C) Risk of deep vein thrombosis (DVT; dark orange), or pulmonary embolism (PE; yellow) in UKB carriers of BPTD-variants in PROC(NM_000312.3) (n = 12), PROS1(NM_000313.3) (n = 9), and SERPINC1(NM_000488.3) (n = 3). The risk is given as an OR, with 95% CIs. MDT decision is indicated by circles, squares and triangles for accept, reject and undecided, respectively.
Figure 5.
Figure 5.
Interactomes and omnigenic model of complex polygenic hematological phenotypes. (A) An interactome of 366 nodes and 1559 edges was generated using the proteins encoded by the 93 BTPD DGGs and the 658 proteins encoded by the genes harboring GWAS-variants for platelet count as “seeds” for retrieving their first-order interactors. (B) A similar interactome of 73 nodes and 374 edges was generated for venous thrombotic events (VTE) using the 93 DGG-encoded proteins and 297 proteins encoded by genes harboring GWAS-variants for VTE as seeds. For panels A-B, only interactions from the IntAct database are shown, in order to simplify the network visualization. Nodes and edges were arranged using Cytoscape software circular layout. Seed genes (ie, DGG genes) were positioned in the center of the circles. The nodes in the outer rings are first-order interactors of the seed genes. Although the algorithm used for platelet traits and thrombosis is the same, the number of nodes is much larger in platelet genes, which led to a better resolution of the outer circle. The outer circle highlights genes that interact with BTPD genes but are not BTPD genes themselves. The radii of nodes are proportional to the estimated effect size, in SD, of the GWAS-variant residing in the gene. Nodes have been colored purple, green and orange for genes/proteins implicated in platelet, bleeding, and thrombotic disorders or in gray if the gene/protein does not belong to one of these DGG domains. (C) Barplots showing the results of the expansion analysis using the entire human interactome of 18 410 nodes and 571 917 edges, showing the enrichment in effect sizes of GWAS-variants as a function of the distance from the core seed genes. x-axis shows the OR of the proximity to the core seed genes/proteins, with >90 to 50 to 60 groups representing the nodes (proteins) most proximal and most distal from seed proteins (panels A-B). Group “>90” consists of the seed genes/proteins and their close protein interactors estimated via propagation score. The reported ORs are calculated using the most distant proteins (<50%) as a reference. The effect sizes of GWAS-variants for platelets and VTE (panel C) are split into 4 quartile effects described for the PGS analysis for VTE and platelets., The top quartile (ie, 75%) contains the variants that have been associated with the largest effect sizes in the relevant GWAS. The y-axis shows the enrichment (in OR) for a set of effect-size quartile bins, in a given distance from the center of the expansion network (in comparison to the periphery of the interaction network). For example, the top quartile of large effect variants for PLT has an OR of >2 of being in close proximity to seed genes (bin group “>90”). Results of the expansion analyses for the count (PLT) and mean volume (MPV) of platelets are in purple and for VTE in orange.
Figure 6.
Figure 6.
Interplay between BTPD variant and PGS. (A) Each line represents the interplay between the effect of 1 of the top 10 BTPD variants and PGS on platelet count. The estimated effect size of the unique variant is represented by the purple segment of the bar and the PGS contribution is represented by the gray segment of the bar. The percentages given above the bars represent the frequencies of UKB participants carrying the BTPD variant and the predicted percentage of the population having a given PGS value for platelet count. The combination of the BTPD variant effect and PGS effect is together required to drop platelet count below the clinical threshold. The x-axis reports the effect size on platelet count in SD required to reduce the platelet count below the 150 × 109/L threshold. (B) Receiver operating characteristic curve showing the prediction of VTE phenotypes using a predictive model based solely on rare BTPD variants for thrombosis (blue), a second model using only the PGS common variants (red), and a third one integrating rare BTPD- and common GWAS-variants (yellow). The area under the curve (AUC) indicates performance in variant classification. (C) Additive effect of the PGS for VTE derived from common GWAS-variants and 2 rare BTPD variants in PROC and 1 in PROS1. The x-axis shows the effects and directionalities of PGS effect estimates in SD (in green; ie, increased vs decreased risk) and the OR for the rare BTPD variant in OR (in orange). The contribution to VTE risk given by the 3 rare BTPD variants is constant, per variant, in carriers with VTE and “healthy” carriers without VTE (the orange portion of the bars). The distribution of PGS values differs significantly between the carriers with VTE and the “healthy” carriers (green portion of the bars).

Comment in

Similar articles

Cited by

References

    1. Ferreira CR. The burden of rare diseases. Am J Med Genet A. 2019;179(6):885–892. - PubMed
    1. Turro E, Astle WJ, Megy K, et al. Whole-genome sequencing of patients with rare diseases in a national health system. Nature. 2020;583(7814):96–102. - PMC - PubMed
    1. Dudley JT, Kim Y, Liu L, et al. Human genomic disease variants: a neutral evolutionary explanation. Genome Res. 2012;22(8):1383–1394. - PMC - PubMed
    1. MacArthur DG, Tyler-Smith C. Loss-of-function variants in the genomes of healthy humans. Hum Mol Genet. 2010;19(R2):R125–R130. - PMC - PubMed
    1. Forrest IS, Chaudhary K, Vy HMT, et al. Population-based penetrance of deleterious clinical variants. JAMA. 2022;327(4):350–359. - PMC - PubMed

Publication types