. 2023 Nov 6;58(21):2195-2205.e5.
doi: 10.1016/j.devcel.2023.08.003. Epub 2023 Aug 29.

Control of murine brown adipocyte development by GATA6

Affiliations

Control of murine brown adipocyte development by GATA6

Seoyoung Jun et al. Dev Cell. .

Abstract

Brown adipose tissue (BAT) is a thermogenic organ that protects animals against hypothermia and obesity. BAT derives from the multipotent paraxial mesoderm; however, the identity of embryonic brown fat progenitor cells and regulators of adipogenic commitment are unclear. Here, we performed single-cell gene expression analyses of mesenchymal cells during mouse embryogenesis with a focus on BAT development. We identified cell populations associated with the development of BAT, including Dpp4+ cells that emerge at the onset of adipogenic commitment. Immunostaining and lineage-tracing studies show that Dpp4+ cells constitute the BAT fascia and contribute minorly as adipocyte progenitors. Additionally, we identified the transcription factor GATA6 as a marker of brown adipogenic progenitor cells. Deletion of Gata6 in the brown fat lineage resulted in a striking loss of BAT. Together, these results identify progenitor and transitional cells in the brown adipose lineage and define a crucial role for GATA6 in BAT development.

Keywords: DPP4; EBF2; GATA6; UCP1; adipose tissue; brown adipocyte; brown adipocyte development; brown adipogenesis; progenitor.


Conflict of interest statement

Declaration of interests The authors declare no competing interests.

Figures

Figure 1.
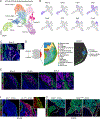
Figure 1.. Profiling of mesenchymal cells during brown adipose tissue (BAT) development
(A) Uniform manifold approximation and projection (UMAP) of 16,165 cells related to the dermomyotome-brown adipose lineage based on marker gene expression and computationally predicted anatomic location (see workflow in Fig. S1). (B) Cells in (A) highlighted by developmental stage of origin. (C) UMAP of 9,895 mesenchymal and skeletal muscle cells from E10.5-E13.5 mouse embryos, representing clusters predicted to localize to the dorsal mouse embryo, where BAT develops (see Fig. S1). Clusters marked by Pax1 expression were aggregated into the Sclerotome group. (D) Violin plots corresponding to (C). (E) Cells in (C) were incorporated into a reference used to deconvolve spatial gene expression data from an E12.5 embryo. Color intensity indicates the estimated proportion of cells at each spot corresponding to the given cell type. (F) Cells in (C) colored by developmental stage of origin. (G) Schematic for cross-section in the anterior region of embryo (created with Biorender.com; left) and immunostaining of CDH4 (green) and EBF2 (red) in the anterior region of mouse embryos at E12.5 and E13.5 (n=3 each, scale bar, 100 μm; right). NT = Neural tube. (H) Immunostaining of CDH4 (green) and tdTomato (red) in the anterior region of E13.5 embryo from En1+/+; tdTom (control) and En1Cre/+; tdTom reporter mice. (n=2 Cre−; n=3 Cre+, scale bar, 100 μm) NT = Neural tube.
Figure 2.
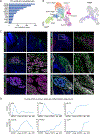
Figure 2.. DPP4+ mesenchymal cells contribute to adipocytes and fascial cells in BAT
(A) UMAP of 13,474 mesenchymal cells from E13.5-E15.5 mouse embryos, representing clusters predicted to localize to the dorsal mouse embryo, where BAT develops (also see Fig. S1). (B) Expression of marker genes in cells from (A). (C) Immunostaining of NGFR (green) and MYOSIN (magenta) in the anterior region of mouse embryos at E14.5. (n=3, scale bar, 100 μm) NT = Neural tube (D) Mesenchymal cells from E13.5-E15.5 were incorporated into a reference used to deconvolve spatial gene expression data from an E14.5 embryo. (Left) Segment of spatial gene expression data used for deconvolution. (Center) Atlas-provided annotations of spots . (Right) Blue or green spots indicate where PreAds or Dpp4+ cells are predicted to make up >40% or >10% of cells, respectively. (E) Immunostaining of DPP4 (green) and PPARg (magenta) in the anterior region of mouse embryos at E14.5 to E16.5. (n=11 E14.5; n=4 E15.5; n=4 E16.5, scale bar, 100 μm). NT = Neural tube. (F) Immunostaining of DPP4 (green) and tdTomato (red) in the anterior region of E14.5 embryo from En1+/+; tdTom (control) and En1Cre/+; tdTom reporter mice. (n=3 Cre−; n=9 Cre+, scale bar, 100 μm). NT = Neural tube. (G) Immunostaining of PPARg (green), DPP4 (white) and tdTomato (red) in the anterior region of E16.5 embryo from Dpp4+/+; tdTom (control) and Dpp4CreER/+; tdTom reporter mice. (n=4 Cre−; n=10 Cre+, scale bar, 100 μm). NT = Neural tube.
Figure 3.
Figure 3.. Identification of GATA6 as a marker of brown adipocyte progenitor cells
(A) Transcription factors enriched in preadipocytes relative to all other E13.5-E15.5 dorsal mesenchyme cell clusters (log2FC > 0.25). P values were calculated using the FindMarkers function in Seurat. (B) UMAP (left) and Gata6 expression (right) in E13.5-E15.5 dorsal mesenchymal cells (see Fig. 2A). (C) Immunostaining of GATA6 (green), PPARg (magenta), and DPP4 (white) in the anterior region of mouse embryos from E12.5 to E16.5. (n=3 E12.5; n=3 E13.5; n=6 E14.5; n=6 E15.5, n=5 E16.5; scale bar, 100 μm) NT = Neural tube. (D) mRNA expression levels of indicated genes during human iPSC-to-brown adipocyte differentiation.
Figure 4.
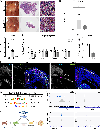
Figure 4.. GATA6 is required for BAT development
(A) Macroscopic view and H&E staining of interscapular BAT from Myf5+/+;Gata6fl/fl (control) and Myf5Cre/+;Gata6fl/fl (homozygous mutant, Gata6ΔMyf5) mice at P0. BAT is highlighted by dashed lines. (n=5 Ctl; n=7 KO, scale bar, 200 μm) (B) BAT weight of the control, Myf5Cre/+;Gata6fl/+ (heterozygous mutant) and Gata6ΔMyf5 mice at P0 (n=8 Ctl; n=13 Het, n=13 KO, mean ± s.e.m.). One-way ANOVA followed by all pairwise comparisons with Holm-Sidak multiple correction. ***P≤ 0.001, ****P≤ 0.0001. (C) Gata6 mRNA levels in interscapular BAT from control, heterozygous and homozygous mutant mice at P0 (n=8 Ctl; n=13 Het; n=13 KO, mean ± s.e.m.). One-way ANOVA followed by all pairwise comparisons with Holm-Sidak multiple correction. ****P≤ 0.0001. (D) mRNA levels of BAT-selective genes in BAT from control and Gata6ΔMyf5 mice at P0 (n=8 Ctl; n=13 Het; n=13 KO, mean ± s.e.m.). One-way ANOVA followed by all pairwise comparisons with Holm-Sidak multiple correction. *P≤ 0.05. (E) Weights of interscapular BAT from control and Gata6ΔMyf5 adult mice (normalized by body weight) (n=6 Ctl; n=4 KO, mean ± s.e.m.). Two-sample, two-sided t-test. ****P≤ 0.0001. (F) Immunostaining of GATA6 (green), PPARg (magenta) and DPP4 (white) in the anterior region of control and Gata6ΔMyf5 mice at E14.5. (n=11 Ctl; n=11 KO, scale bar, 100 μm). NT = Neural tube. (G) De novo motif analysis of GATA6-binding regions in E15.5 BAT. (H) ChIP-seq profiles in reads per million total reads (RPM) for GATA6 (blue), H3K27-Ac (gray), and IgG (black) in E15.5 BAT at the following genes: Ebf2, Ctcf, Tcf3, Ak1. (I) Working model of the brown adipocyte lineage hierarchy, highlighting the role of GATA6 in regulating brown adipogenic commitment upstream of Pparg expression.

References

    1. Cannon B, and Nedergaard J (2004). Brown adipose tissue: function and physiological significance. Physiological reviews 84, 277–359. - PubMed
    1. Enerback S, Jacobsson A, Simpson EM, Guerra C, Yamashita H, Harper ME, and Kozak LP (1997). Mice lacking mitochondrial uncoupling protein are cold-sensitive but not obese. Nature 387, 90–94. 10.1038/387090a0. - DOI - PubMed
    1. Cohen P, and Kajimura S (2021). The cellular and functional complexity of thermogenic fat. Nature reviews. Molecular cell biology 22, 393–409. 10.1038/s41580-021-00350-0. - DOI - PMC - PubMed
    1. Sakers A, De Siqueira MK, Seale P, and Villanueva CJ (2022). Adipose-tissue plasticity in health and disease. Cell 185, 419–446. 10.1016/j.cell.2021.12.016. - DOI - PMC - PubMed
    1. Seki T, Yang Y, Sun X, Lim S, Xie S, Guo Z, Xiong W, Kuroda M, Sakaue H, Hosaka K, et al. (2022). Brown-fat-mediated tumour suppression by cold-altered global metabolism. Nature 608, 421–428. 10.1038/s41586-022-05030-3. - DOI - PMC - PubMed

Publication types

Substances