. 2023 Sep 14;66(17):12115-12129.
doi: 10.1021/acs.jmedchem.3c00680. Epub 2023 Aug 30.

Profound Changes in Functional Structure and Dynamics of Serum Albumin in Children with Nephrotic Syndrome: An Exploratory Research Study

Affiliations

Profound Changes in Functional Structure and Dynamics of Serum Albumin in Children with Nephrotic Syndrome: An Exploratory Research Study

Haleh H Haeri et al. J Med Chem. .

Abstract

Patients with nephrotic syndrome (NS) suffer from urinary loss of albumin. As a cause, previous studies focused on the glomerular filter rather than analyzing the molecular properties of albumin itself. Later one was initiated by clinical observations indicating unexplained molecular alterations of human serum albumin (HSA) in an NS pediatric patient. Therefore, we examined serum from eight pediatric patients with steroid-sensitive and -resistant NS and compared it with serum from healthy subjects as well as commercial HSA. We used dynamic and electrophoretic light scattering to characterize the protein size and effective surface charge and electron paramagnetic resonance spectroscopy to measure the local environment and binding dynamics of up to seven fatty acids associated with HSA. Our findings suggest that pronounced differences in binding behavior and surface charge of HSA could enhance their filtration through the GBM, leading to direct toxicity of HSA to podocytes.


Conflict of interest statement

The authors declare no competing financial interest.

Figures

Figure 1
Figure 1
Schematic representation of the intact glomerular filtration barrier under the presence of proteinuria. (A) Normal components of the intact glomerular filtration barrier: capillary endothelial cells, glomerular basement membrane, and glomerular epithelial cells (podocytes) The space between foot processes are called slit diaphragm, and the podocyte foot processes are connected by nephrin molecules (red) which are essential to stabilize the podocyte cell filtration barrier. (B) Schematic representation of the proteinuria (with serum albumin) from loss of the normal glomerular filtration barrier and albumin uptake mechanism by podocytes. Adapted from Refs.,
Scheme 1
Scheme 1. Schematic Representation of Applied Techniques To Study Molecular Properties of Albumin
Left side: Particle size distributions reflected in hydrophobic radius (RH, pictured as a circle) for commercial HSA (∼3.5 nm) is obtained by the dynamic light scattering (DLS) technique. Corresponding surface charges of HSA are provided by the ELS method and indicated in red and blue color (negatively or positively charged protein areas). Right side: A typical CW EPR spectrum of measured samples, through spin probing (16-DSA). The distance between the outermost lines of the spectrum is indicated by 2A′zz (called apparent hyperfine coupling) which could be used as a scale of the polarity of the local environment. Spectral analysis (peak intensities and broadening) gives information about rotational dynamics (τc). Being more hydrophobic on the surface, water is repelled by HSA (green, apolar hydration), while in a hydrophilic case, we see the accumulation of water around protein (blue).
Figure 2
Figure 2
DLS results for com-HSA and ELS data sets for samples in the “healthy” group. (A) Particle size distribution for commercial HSA at side scattering, loaded with increasing amounts of 16-DSA. (B) Development of the zeta potential based on the added equivalents of FA for the three samples in the “healthy”-group. The three ratios 1:2, 1:4, and 1:6 are highlighted in red boxes.
Figure 3
Figure 3
ELS results for samples in the SSNS group. Comparison of the zeta potential at three loading ratios for all children’s serum samples diagnosed with SSNS. As a reference, the zeta potential for the “Control” sample (”healthy”-group) is shown as a red bold line.
Figure 4
Figure 4
ELS results for samples in the SRNS group. (A) Comparison of the zeta potential at three loading ratios for all children’s serum samples with SRNS. (B:) Change in zeta potential depending on the treatment state of the patient with severe SRNS (sample SRNS#3.1). As a reference, the zeta potential for the “Control” sample (“healthy” group) is shown as a red bold line.
Figure 5
Figure 5
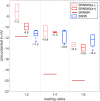
Boxplots of ELS results for group SSNS and severe SRNS case (SRNS#3). Light and dark red boxes show zeta potential at different loading ratios for SRNS#3 samples, separated based on the remission state (a– with 4 weeks after the last HSA substitution; a+ under HSA substitution). SRNS#3.1 is taken separately and shown as an orange line. Blue boxes present results for the SSNS group. The medians (lines in boxes) and their corresponding values are given in all plots.
Figure 6
Figure 6
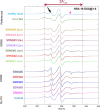
Experimental and simulated CW EPR spectra (colored per sample, plotted against magnetic field B in milliTesla, mT) for children’s samples at a loading ratio 1:4. Two distinguishable features between SSNS and SSRS groups can be pointed out. First, there are different spectral line shapes, indicating different binding behavior of 16-DSA to HSA (arrows, asterisk, and full lines). The black arrow shows faster dynamics of a rather loosely bound FA to protein for all SSNS samples. The second feature relates to the amount of free FA (not bound, see asterisk). Spectral simulation allows the quantification of these differences. The apparent hyperfine coupling (2A′zz) is indicated as the distance between the two outermost lines. The “healthy adult” data set represents a healthy individual adult as described in refs (25, 26).
Figure 7
Figure 7
Different behavior of HSA’s two binding sites with 16-DSA, at a loading ratio of 1:4 HSA:16-DSA. Based on the information obtained from spectral simulations, we can estimate the population (spectral contribution) of each binding site (A) and (B) (please see text), as well as dynamics (τc (ns)) for samples. The SRNS group contains all SRNS#3 sets of samples. “Healthy-m” denotes the median values for all healthy samples per binding site and “HSA” show the values for commercially purified HSA, according to ref (25).
Figure 8
Figure 8
Graphical illustration of probed local environments via light scattering and CW-EPR. The two clearly discernible patient groups are (A) healthy and (B) steroid-sensitive-NS (SSNS). Left column: Calculated surface charges based on an APBS model (Adaptive Poisson-Boltzmann Solver) for the healthy structure. The surface charges for two SSNS groups are adaptively scaled. Corresponding experimentally obtained zeta potentials (from DLS and ELS) at a 1:4 loading ratio of HSA:16-DSA are also given. As for the SSNS group, the average value of surface charges is given. Distribution of surface charges is color-coded in red (negative) and blue (positive). Middle column: Representative cw-EPR spectra at 1:4 loading ratio for each group show distinct differences in terms of both hyperfine coupling (indicative of FA binding behavior) and rotational correlation times (dynamics). Right column: Illustration of the local environment around HSA-bound FAs (shown in yellow) dissolved in water for healthy and NS-diseased groups. The results from DLS and EPR on the SSNS group revealed a more hydrophobic environment around high-affinity binding sites of HSA. These data are depicted as pushing water molecules out of the surrounding hydration shell of the HSA molecule.

Similar articles

References

    1. Butt L.; Unnersjö-Jess D.; Höhne M.; Edwards A.; Binz-Lotter J.; Reilly D.; Hahnfeldt R.; Ziegler V.; Fremter K.; Rinschen M. M.; Helmstädter M.; Ebert L. K.; Castrop H.; Hackl M. J.; Walz G.; Brinkkoetter P. T.; Liebau M. C.; Tory K.; Hoyer P. F.; Beck B. B.; Brismar H.; Blom H.; Schermer B.; Benzing T. A Molecular Mechanism Explaining Albuminuria in Kidney Disease. Nat. Metab. 2020, 2, 461–474. 10.1038/s42255-020-0204-y. - DOI - PubMed
    1. Eddy A. A.; Symons J. M. Nephrotic Syndrome in Childhood. Lancet 2003, 362, 629–639. 10.1007/s00112-019-0677-5. - DOI - PubMed
    1. Levin M.; Smith C.; Walters M. D. S.; Gascoine P.; Barratt T. M. Steroid-Responsive Nephrotic Syndrome: A Generalised Disorder of Membrane Negative Charge. Lancet 1985, 326, 239–242. 10.1016/S0140-6736(85)90290-9. - DOI - PubMed
    1. Hausmann R.; Kuppe C.; Egger H.; Schweda F.; Knecht V.; Elger M.; Menzel S.; Somers D.; Braun G.; Fuss A.; Uhlig S.; Kriz W.; Tanner G.; Floege J.; Moeller M. J. Electrical Forces Determine Glomerular Permeability. J. Am. Soc. Nephrol. 2010, 21, 2053–2058. 10.1681/ASN.2010030303. - DOI - PMC - PubMed
    1. Carrie B. J.; Salyer W. R.; Myers B. D. Minimal Change Nephropathy: An Electrochemical Disorder of the Glomerular Membrane. Am. J. Med. 1981, 70, 262–268. 10.1016/0002-9343(81)90760-9. - DOI - PubMed