. 2023 Oct 11;43(41):6872-6883.
doi: 10.1523/JNEUROSCI.0354-23.2023. Epub 2023 Aug 30.

Rapid, Activity-Dependent Intrinsic Plasticity in the Developing Zebra Finch Auditory Cortex

Affiliations

Rapid, Activity-Dependent Intrinsic Plasticity in the Developing Zebra Finch Auditory Cortex

Yao Lu et al. J Neurosci. .

Abstract

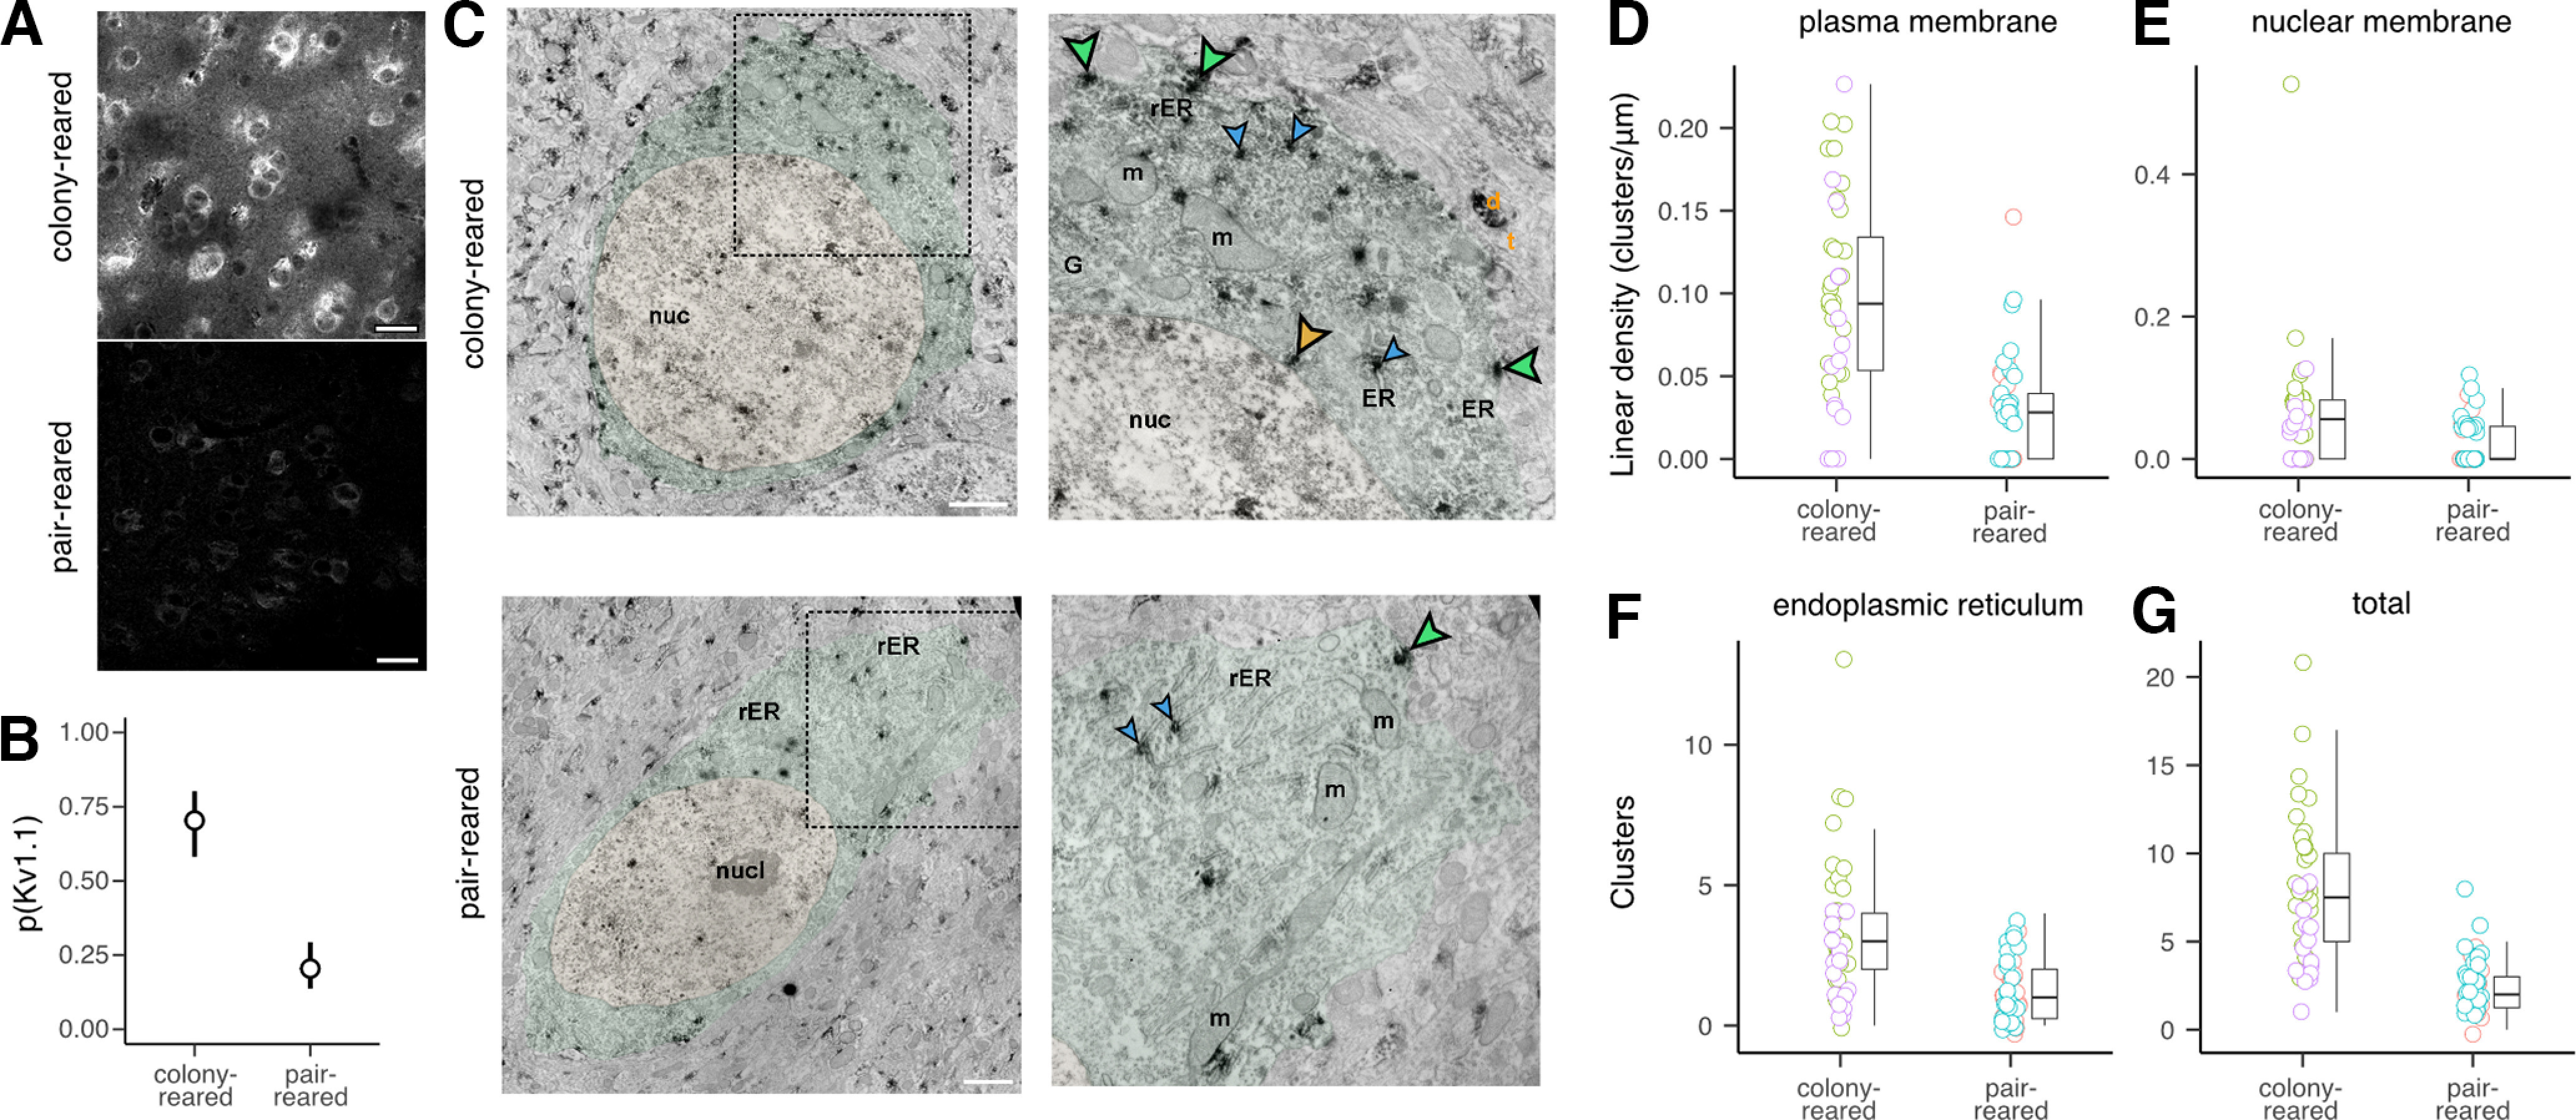
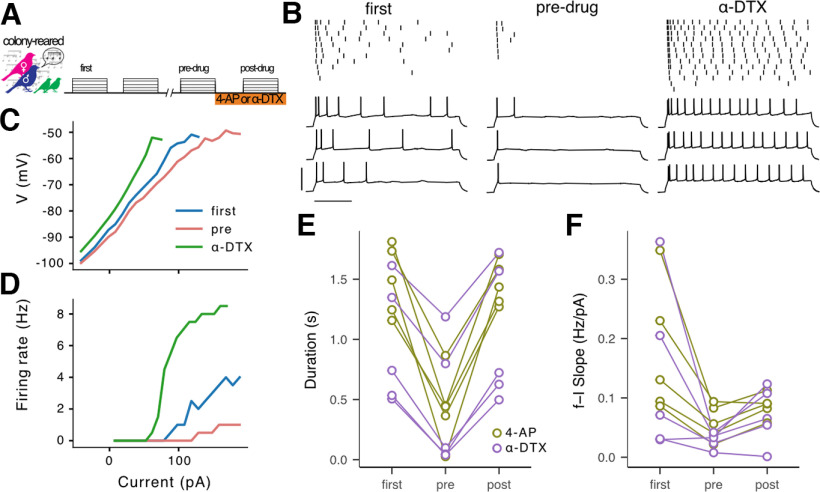
The acoustic environment an animal experiences early in life shapes the structure and function of its auditory system. This process of experience-dependent development is thought to be primarily orchestrated by potentiation and depression of synapses, but plasticity of intrinsic voltage dynamics may also contribute. Here, we show that in juvenile male and female zebra finches, neurons in a cortical-level auditory area, the caudal mesopallium (CM), can rapidly change their firing dynamics. This plasticity was only observed in birds that were reared in a complex acoustic and social environment, which also caused increased expression of the low-threshold potassium channel Kv1.1 in the plasma membrane and endoplasmic reticulum (ER). Intrinsic plasticity depended on activity, was reversed by blocking low-threshold potassium currents, and was prevented by blocking intracellular calcium signaling. Taken together, these results suggest that Kv1.1 is rapidly mobilized to the plasma membrane by activity-dependent elevation of intracellular calcium. This produces a shift in the excitability and temporal integration of CM neurons that may be permissive for auditory learning in complex acoustic environments during a crucial period for the development of vocal perception and production.SIGNIFICANCE STATEMENT Neurons can change not only the strength of their connections to other neurons, but also how they integrate synaptic currents to produce patterns of action potentials. In contrast to synaptic plasticity, the mechanisms and functional roles of intrinisic plasticity remain poorly understood. We found that neurons in the zebra finch auditory cortex can rapidly shift their spiking dynamics within a few minutes in response to intracellular stimulation. This plasticity involves increased conductance of a low-threshold potassium current associated with the Kv1.1 channel, but it only occurs in birds reared in a rich acoustic environment. Thus, auditory experience regulates a mechanism of neural plasticity that allows neurons to rapidly adapt their firing dynamics to stimulation.

Keywords: Kv1.1; activity-dependent plasticity; auditory learning; intrinsic dynamics; zebra finch.


Figures

Figure 1.
Figure 1.
Early auditory experience modulates expression and localization of Kv1.1. A, Examples of α-Kv1.1 staining in CM at P30–P35 in CR and PR zebra finches. Images are single confocal slices (0.44) with identical laser, gain, and contrast settings. Scale bar: 20 μm. B, Proportion of Kv1.1-positive neurons in each rearing condition from n=2 CR and n=3 PR chicks. Hollow circles show means for each condition; whiskers show 90% credible intervals for the mean (GLMM; see Materials and Methods). There are many more immunopositive neurons in CR birds (GLMM: log-odds ratio = 2.2±0.36, p < 0.001). C, Composite electron micrograph of a Kv1.1-immunopositive cell from a CR bird (top) and a PR bird (bottom). The nucleus (yellow) and cytoplasm (green) are pseudocolored. Scale bar: 1 μm. The right panel shows detail of the area indicated by a dashed line in the left panel. DAB staining product accumulated in discrete clusters on the plasma membrane (green arrowheads), the endoplasmic reticulum (blue arrowheads), and the cytosolic side of the nuclear membrane (orange arrowhead). Abbreviations: m, mitochondria; ER, endoplasmic reticulum; rER, rough ER; G, Golgi apparatus; nuc, nucleus; nucl, nucleolus; d, dendrite; t, terminal. D, Comparison of the linear density (DAB clusters per μm of membrane) of Kv1.1 staining on the plasma membrane for CR and PR conditions. Hollow circles correspond to individual neurons, with color indicating the bird ( n=2 birds in each condition, 25 neurons per bird). Boxplots indicate median (horizontal line), interquartile range (central box) and the largest value no further than 1.5 times the interquartile range (whiskers). The density of Kv1.1 on the plasma membrane is higher in CR birds (Wilcoxon test: W=1709, p < 0.001). E, The linear density of staining on the nuclear membrane for CR and PR birds, same format as D. The density is higher for CR birds ( W=1367, p=0.002). F, The number of clusters associated with the ER is greater in cells from CR birds compared with PR birds ( W=1565, p < 0.001). G, The total number of clusters associated with ER, plasma membrane, and nuclear membrane is higher in cells from CR birds compared with PR birds ( W=1823, p < 0.001).
Figure 2.
Figure 2.
Kv1.1 is not sufficient for phasic excitability. A, Example of a Kv1.1-negative tonic neuron. Image is a single confocal slice (0.44 μm) showing fluorescent staining for Kv1.1 (cyan) and biocytin (magenta). Scale bar: 40 μm. Bottom shows exemplar voltage traces in response to step current injections. Scale bars: 20 mV, 50 pA, 500 ms. B, Example of a Kv1.1-positive tonic neuron. C, Example of a Kv1.1-positive phasic neuron. D, Average response duration for Kv1.1-negative ( n=3) and Kv1.1-positive ( n=24) neurons. Symbols represent single neurons and have been jittered horizontally for clarity. E, Average response duration versus Kv1.1 staining, measured as the density of puncta detected within the stained soma. The correlation is not significant (Spearman correlation: ρ22=0.08, p=0.70).
Figure 3.
Figure 3.
Rapid emergence of phasic excitability in colony-reared (CR) birds. A, Neurons from colony-reared chicks were stimulated with epochs of depolarizing step currents 2 s in duration with varying amplitude. B, Tonic responses of an exemplar neuron immediately after establishing the whole-cell recording. Top is a raster plot showing spike times. Below are voltage and current traces for three selected trials. Scale bars: 40 mV, 100 pA, 500 ms. C, Phasic response of the same exemplar neuron 841 s after the start of the recording. Same format as in A. D, Firing rate versus injected current amplitude (f-I curve) for the first and last epochs. E, Steady-state voltage versus injected current amplitude for the first and last epochs of the recording. The line is plotted only when the cell did not spike during the measurement window. Data for the negative current values was taken from hyperpolarizing pulses used in every sweep to track input and series resistance. Note the emergence of strong outward rectification in the latter epoch. F, Firing duration, slope of frequency versus current, rheobase (Ith), resting potential (Vm), and resting input resistance (Rm) for each epoch in the recording. Vertical lines show standard error of mean for duration, Vm, and Rm, which were averaged across all the sweeps in the epoch. Pauses in the recording occurred when the range of stimulating currents was adjusted to ensure an adequate number of traces included spikes (see Materials and Methods). G, Change in duration from first to last epoch versus total recording time (top) and total number of spikes (bottom). Each symbol corresponds to the last epoch recorded in an individual neuron. H, Comparison of average firing duration in the first and last epochs for n=33 neurons in colony-reared birds where the recording lasted at least 400 s. Circles and lines correspond to individual neurons. Because of the large number of cells, boxplots are shown to indicate median (horizontal line), interquartile range (central box) and the largest value no further than 1.5 times the interquartile range (whiskers). The important comparison is the mean change, which was estimated in an omnibus model including all the conditions in which plasticity was tested (see Materials and Methods). For this condition, the average change was 0.55±0.09 s (LMM: t74.7=6.0, p < 0.001). I, Comparison of frequency-current slope in first and last epochs for the same neurons. The average change was 0.100±0.018 Hz/pA ( t76=5.52, p < 0.001).
Figure 4.
Figure 4.
Tonic dynamics are stable in pair-reared (PR) birds. A, Experimental design: neurons from PR chicks were stimulated with epochs of depolarizing step currents. B–F, Responses of an exemplar neuron to depolarizing step currents immediately after establishing the whole-cell recording and 1001 s later. Same format as Figure 3B–F. G, Change in duration from first to last epoch versus total recording time (top) and total number of spikes (bottom). H, Comparison of average firing duration in the first and last epochs for n=16 neurons in PR birds where the recording lasted at least 400 s. The average change in duration was 0.03±0.13 s (LMM: t72.5=0.257, p=0.80). I, Comparison of frequency-current slope in first and last epochs for the same neurons. The average change in slope was 0.057±0.027 Hz/pA ( t76=2.19, p=0.031).
Figure 5.
Figure 5.
Blocking low-threshold potassium currents reverses the shift to phasic dynamics. A, Neurons from CR birds were stimulated with epochs of depolarizing step currents. After 700–1700 s of recording, either 4-AP (2 mm) or α-DTX (100 nm) was applied in the bath. B, Responses of an exemplar neuron during the first epoch, the last epoch before drug application (predrug), and the epoch after drug application (α-DTX). Format is the same as in Figure 3B,C. Scale bars: 40 mV, 500 ms. Current steps: 130, 150, 170 pA. C, Steady-state voltage versus injected current for the epochs shown in B. D, Firing rate versus injected current amplitude for the epochs in B. E, Comparison of average firing duration in the first, predrug, and postdrug epochs for neurons treated with 4-AP (brown; n=5) or α-DTX (purple; n=5). Only neurons with an initial duration >0.5 s that decreased by at least 0.4 s were tested (all neurons: mean change in duration = 0.75±0.08 s; t334=9.0, p<0.001). The change from predrug to postdrug was 0.96±0.12 s for 4-AP ( t305=8.2, p<0.001) and 0.60±0.11 s for α-DTX ( t304=5.5, p<0.001). F, Comparison of frequency-current slope in the same neurons. Neither drug significantly reversed the change in slope (4-AP: mean change = 0.03±0.04 Hz/pA, t16=0.6, p=0.79; α-DTX: mean change = 0.04±0.04, t16=1.0, p=0.60).
Figure 6.
Figure 6.
Intrinsic plasticity depends on activity and intracellular calcium A, In the minimal stimulation condition, neurons from CR chicks were tested with a single epoch of depolarizing step currents, clamped at the resting potential for at least 400 s, and then tested with another epoch of current steps. B, Comparison of average firing duration (left) and f-I slope (right) in the first and last epochs for the minimal stimulation condition ( n=15). The average change in duration was 0.18±0.13 s (LMM: t66.2=1.38, p=0.17), and the average change in slope was 0.048±0.027 Hz/pA ( t76=1.79, p=0.078). C, In the BAPTA condition, slices from CR chicks were preincubated with 10 μm BAPTA-AM for 30 min. Cells were stimulated with epochs of depolarizing step currents for at least 400 s. D, Comparison of average firing duration (left) and f-I slope (right) in the first and last epochs for the BAPTA condition ( n=16). The average change in duration was 0.18±0.13 s ( t71.4=1.37, p=0.17), and the average change in slope was 0.041±0.026 Hz/pA ( t76=1.60, p=0.11).
Figure 7.
Figure 7.
Intrinsic plasticity depends on experience, activity, and intracellular calcium, and is correlated with changes in passive membrane properties. A, Average change in response duration for the CR, PR, minimal stimulation, and BAPTA conditions. Hollow circles show means; thick and thin whiskers show 50% and 90% credible intervals for the mean. The change in duration in the CR condition is greater than for the PR condition ( t73.2=3.25, p=0.002), the minimal stimulation condition ( t68.8=2.32, p=0.023), and the BAPTA condition ( t72.4=2.35, p=0.021). The differences between PR, minimal stimulation, and BAPTA conditions were not significant ( p>0.42 for all comparisons). B, Average change in f-I slope for the same conditions. The differences were not statistically significant ( F3,76=1.62, p=0.19). C, Comparison of changes in duration with changes in rheobase, input resistance (Rm), f-I slope, and resting membrane potential (Vm). Each symbol represents a single neuron, with color corresponding to the experimental condition. The blue line is the best linear fit, and the gray band is the standard error of the fit. Across all conditions, a decrease in duration was correlated with an increase in rheobase ( r78=0.27, p=0.017), an increase in f-I slope ( r78=0.42, p<0.001), and a decrease in Vm ( r78=0.26, p=0.021). Changes in duration were not significantly correlated with changes in Rm ( r78=0.22, p=0.054).
Figure 8.
Figure 8.
Model of slow and fast intrinsic plasticity. When zebra finches fledge (P18–P20), CM neurons have low levels of Kv1.1 expression and only produce tonic responses. Exposure to a complex environment stimulates Kv1.1 expression in CR birds, but neurons remain tonic so long as the Kv1.1 remains within the neuron. Acute stimulation that elevates intracellular calcium causes Kv1.1 to be exported to the plasma membrane, rapidly shifting the dynamics to phasic spiking. Kv1.1 expression remains low in PR animals, so their neurons are not able to become phasic. An unknown process may allow phasic neurons to internalize Kv1.1 and shift back to tonic spiking.

Similar articles

Cited by

References

    1. Adachi R, Yamada R, Kuba H (2019) Tonotopic differentiation of coupling between Ca2+ and Kv1.1 expression in brainstem auditory circuit. iScience 13:199–213. 10.1016/j.isci.2019.02.022 - DOI - PMC - PubMed
    1. Akter N, Adachi R, Kato A, Fukaya R, Kuba H (2018) Auditory input shapes tonotopic differentiation of Kv1. 1 expression in avian cochlear nucleus during late development. J Neurosci 38:2967–2980. 10.1523/JNEUROSCI.2472-17.2018 - DOI - PMC - PubMed
    1. Amin N, Doupe AJ, Theunissen FE (2007) Development of selectivity for natural sounds in the songbird auditory forebrain. J Neurophysiol 97:3517–3531. 10.1152/jn.01066.2006 - DOI - PubMed
    1. Bal R, Oertel D (2001) Potassium currents in octopus cells of the mammalian cochlear nucleus. J Neurophysiol 86:2299–2311. 10.1152/jn.2001.86.5.2299 - DOI - PubMed
    1. Bishop HI, Guan D, Bocksteins E, Parajuli LK, Murray KD, Cobb MM, Misonou H, Zito K, Foehring RC, Trimmer JS (2015) Distinct cell- and layer-specific expression patterns and independent regulation of Kv2 channel subtypes in cortical pyramidal neurons. J Neurosci 35:14922–14942. 10.1523/JNEUROSCI.1897-15.2015 - DOI - PMC - PubMed

Publication types

LinkOut - more resources