. 2023 Sep 1;40(9):msad192.
doi: 10.1093/molbev/msad192.

De Novo Mutation Rates in Sticklebacks

Affiliations

De Novo Mutation Rates in Sticklebacks

Chaowei Zhang et al. Mol Biol Evol. .

Abstract

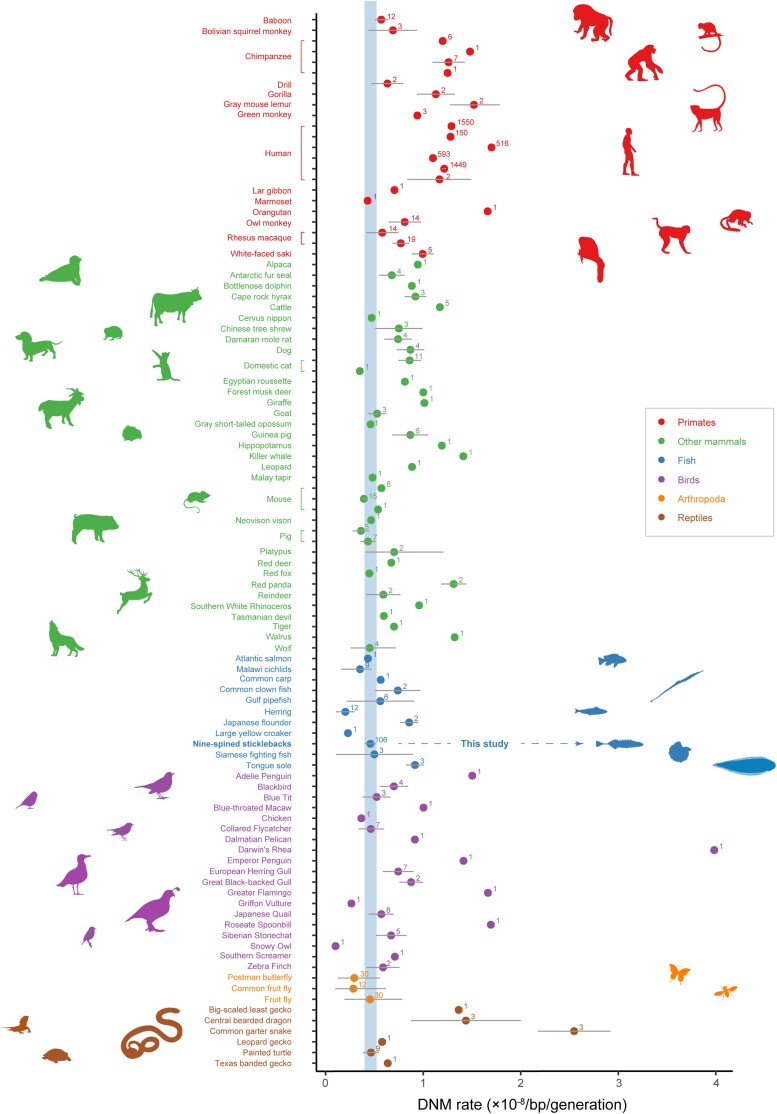
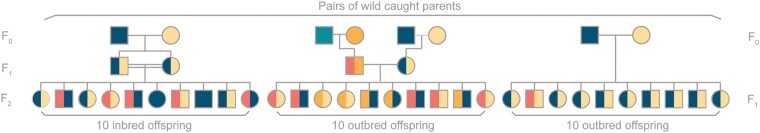
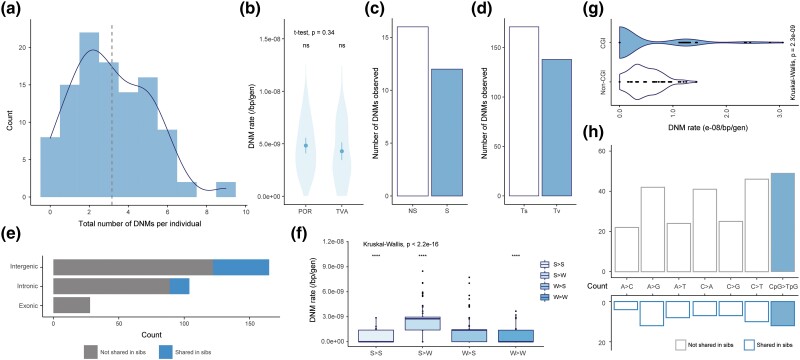
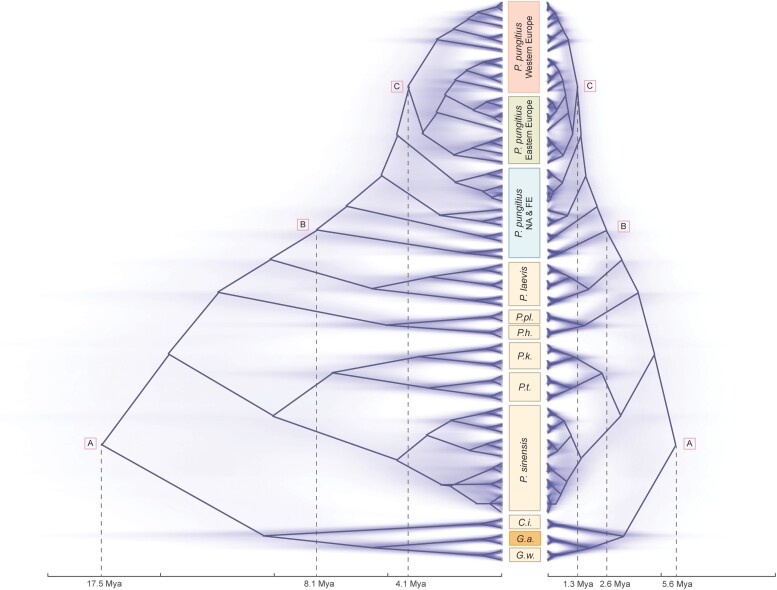
Mutation rate is a fundamental parameter in population genetics. Apart from being an important scaling parameter for demographic and phylogenetic inference, it allows one to understand at what rate new genetic diversity is generated and what the expected level of genetic diversity is in a population at equilibrium. However, except for well-established model organisms, accurate estimates of de novo mutation rates are available for a very limited number of organisms from the wild. We estimated mutation rates (µ) in two marine populations of the nine-spined stickleback (Pungitius pungitius) with the aid of several 2- and 3-generational family pedigrees, deep (>50×) whole-genome resequences and a high-quality reference genome. After stringent filtering, we discovered 308 germline mutations in 106 offspring translating to µ = 4.83 × 10⁻⁹ and µ = 4.29 × 10⁻⁹ per base per generation in the two populations, respectively. Up to 20% of the mutations were shared by full-sibs showing that the level of parental mosaicism was relatively high. Since the estimated µ was 3.1 times smaller than the commonly used substitution rate, recalibration with µ led to substantial increase in estimated divergence times between different stickleback species. Our estimates of the de novo mutation rate should provide a useful resource for research focused on fish population genetics and that of sticklebacks in particular.

Keywords: divergence time; genetic diversity; germline mutation rate; mutation rate; ninespine stickleback.


Figures

<sc>Fig.</sc> 1.
Fig. 1.
DNM rates to date. Per-site-per-generation DNM rate (10−8) estimates from studies which have used pedigree-based mutation rate estimation. The common names are sorted in alphabetical order for each taxonomic group. The number on each point indicates how many trios have been included in each estimate. Rates with no error bars do not have 95% confidence intervals available. For more details and references, please see supplementary table S1, Supplementary Material online. The blue shaded area indicates the confidence interval of DNM rate estimate for the nine-spined stickleback.
<sc>Fig.</sc> 2.
Fig. 2.
Pedigree types. Three types of pedigree structures used in this study: three-generation inbred line (left), three-generation outbred line (middle), and two-generation outbred line (right). Squares and circles represented males and females, respectively. The mutated alleles are shown in red and the normal wild types in other colours. Three possible scenarios have been presented here: 1) mutation transmitted from the F1 generation and shared between full-sibs (left); 2) mutation occurring in F0 germ cell and being transmitted to F2 offspring (middle); 3) non-shared mutation.
<sc>Fig.</sc> 3.
Fig. 3.
Mutation rates, types, and spectra. (a) Frequency distribution of DNMs detected per individual (dotted line is the mean = 3.16). (b) Mean DNM rates in POR (4.83 × 10⁻⁹ [95% CI: 4.09–5.56 × 10⁻⁹]) and TVA (4.29 × 10⁻⁹ [95% CI: 3.45–5.13 × 10⁻⁹]) populations (t101.63 = 0.96, P = 0.34). (c) Observed number of non-synonymous (NS) and synonymous (S) DNMs. (d) Observed number of transversion (Tv) vs. transition (Ts) mutations. (e) Number of DNMs located in intergenic, intronic, or exonic areas, categorized according to mutations being shared among full-sibs (blue) or not (gray). (f) DNM rate of strong-to-weak pairing type (S > W) mutations—note that this was significantly higher (Kruskal–Wallis test) than in the other types (S > S: C > G, S > W: C > A or C > T, W > S: A > C or A > G, W > W: A > T. The respective median DNM rates after corrected by FNR were: 0, 2.76, 1.39, 0 × 10−9/bp/generation). (g) Comparison of per-sample DNM rates in CpG island and non-CpG island regions. (h) Mutation spectrum of the detected DNMs separated according to if mutations were shared among siblings (below, blue border) or not (above, gray border).
<sc>Fig.</sc> 4.
Fig. 4.
The DNM and substitution rate-based phylogenies of Pungitius sticklebacks. The DNM rate-based tree on left and substitution rate-based tree on right. Solid lines represent the summarized canal trees with maximum clade credibility scores, while the faint lines represent consensus trees for all topologies. (P.pl., P. platygaster; P.h., P. hellenicus; P.k., P. kaibarae; P.t., P. tymensis; G.w., G. wheatlandi; G.a., G. aculeatus; C.i., Culaea inconstans; FE, Far Eastern lineage; NA, North American lineage).

Similar articles

Cited by

References

    1. Barrett RD, Schluter D. 2008. Adaptation from standing genetic variation. Trends Ecol Evol. 23:38–44. - PubMed
    1. Bergeron LA, Besenbacher S, Bakker J, Zheng J, Li P, Pacheco G, Sinding MS, Kamilari M, Gilbert MTP, Schierup MH, et al. . 2021. The germline mutational process in rhesus macaque and its implications for phylogenetic dating. Gigascience. 10:giab029. - PMC - PubMed
    1. Bergeron LA, Besenbacher S, Turner T, Versoza CJ, Wang RJ, Price AL, Armstrong E, Riera M, Carlson J, Chen H, et al. . 2022. The mutationathon highlights the importance of reaching standardization in estimates of pedigree-based germline mutation rates. eLife. 11:e73577. - PMC - PubMed
    1. Bergeron LA, Besenbacher S, Zheng J, Li P, Bertelsen MF, Quintard B, Hoffman JI, Li Z, St Leger J, Shao C, et al. . 2023. Evolution of the germline mutation rate across vertebrates. Nature. 615(7951):285–291. - PMC - PubMed
    1. Berglund J, Quilez J, Arndt PF, Webster MT. 2014. Germline methylation patterns determine the distribution of recombination events in the dog genome. Genome Biol Evol. 7(2):522–530. - PMC - PubMed

Publication types