

Analysis of marine heatwaves over the Bay of Bengal during 1982-2021
- PMID: 37648697
- PMCID: PMC10468509
- DOI: 10.1038/s41598-023-39884-y
Analysis of marine heatwaves over the Bay of Bengal during 1982-2021
Erratum in
-
Author Correction: Analysis of marine heatwaves over the Bay of Bengal during 1982-2021.Sci Rep. 2023 Sep 21;13(1):15716. doi: 10.1038/s41598-023-43101-1. Sci Rep. 2023. PMID: 37735493 Free PMC article. No abstract available.
Abstract
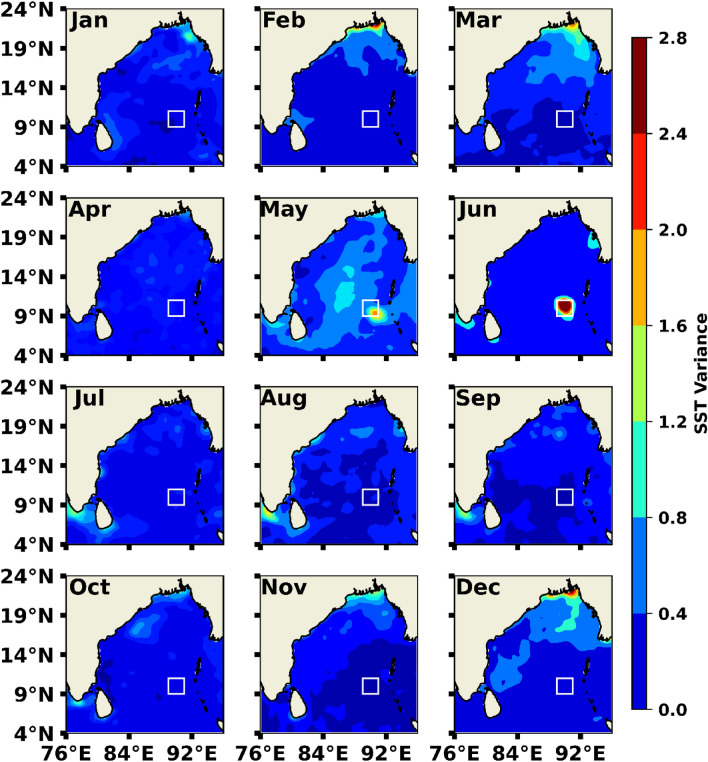
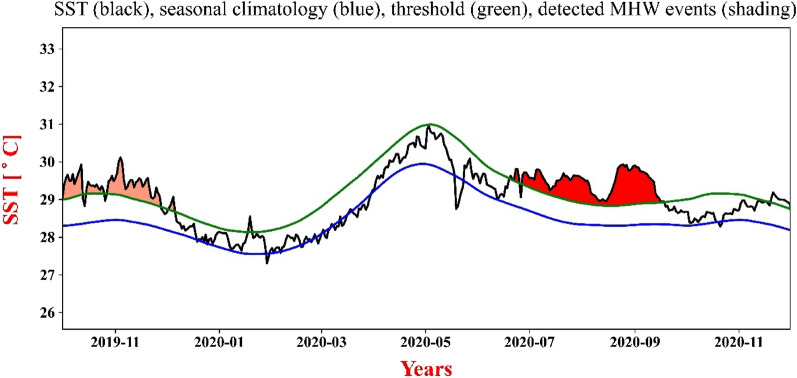
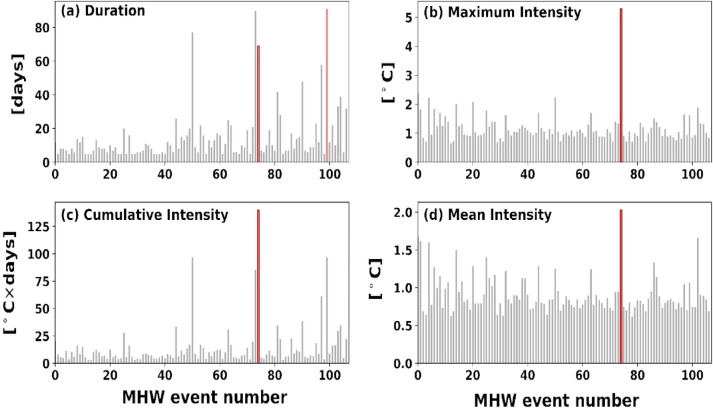
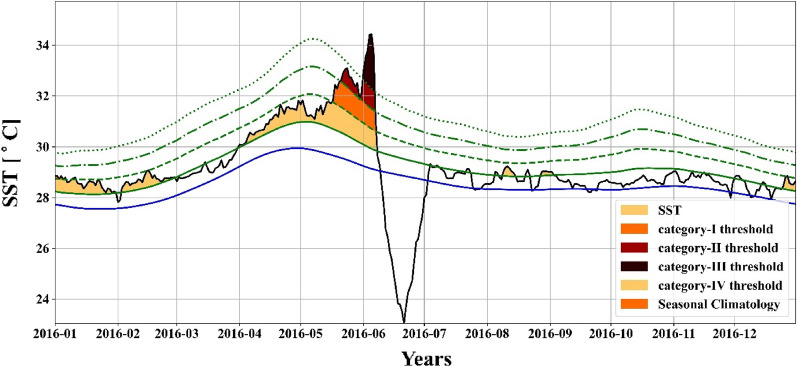
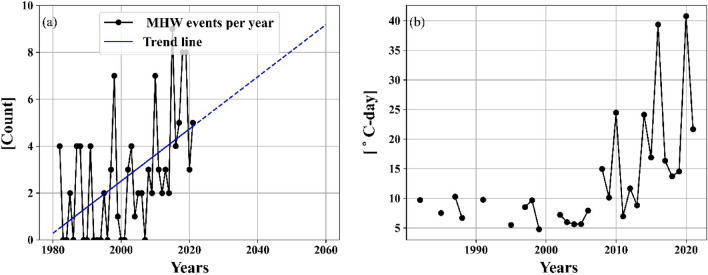
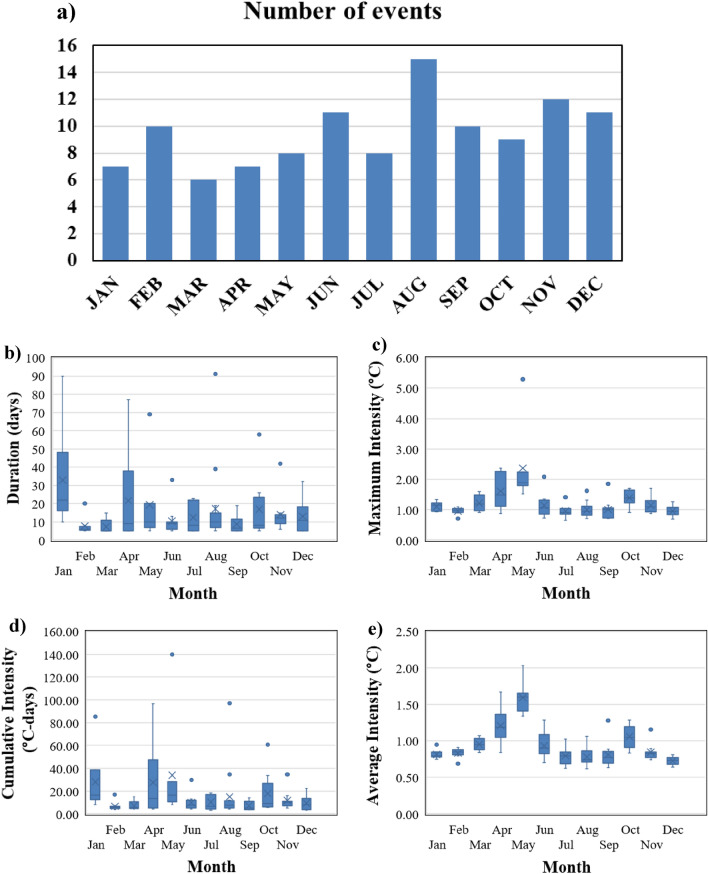
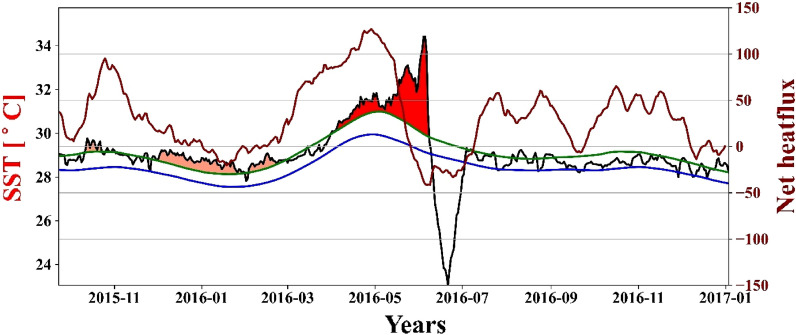
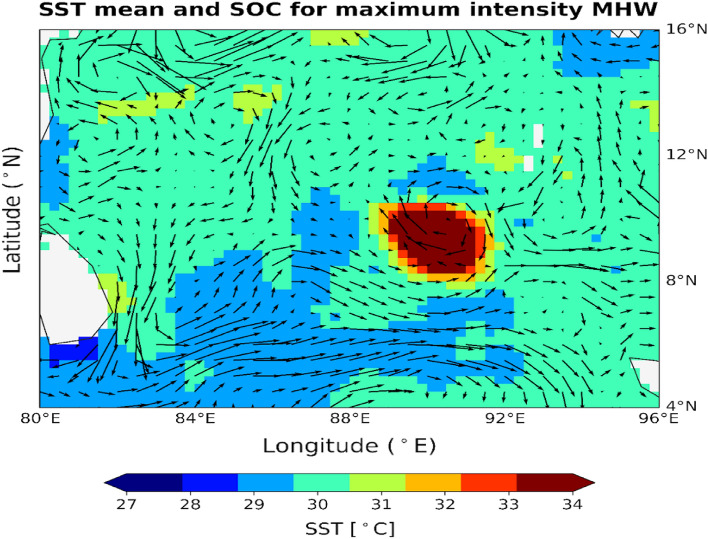
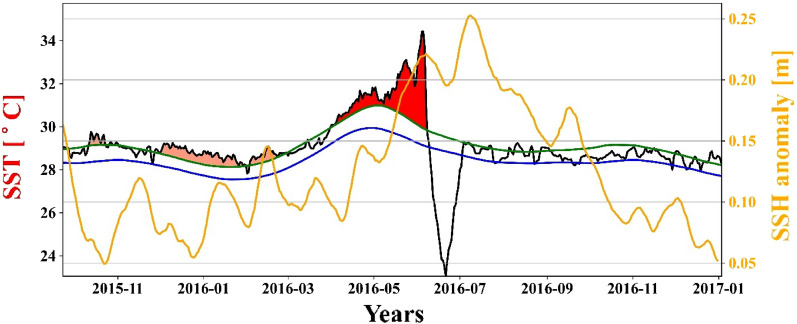
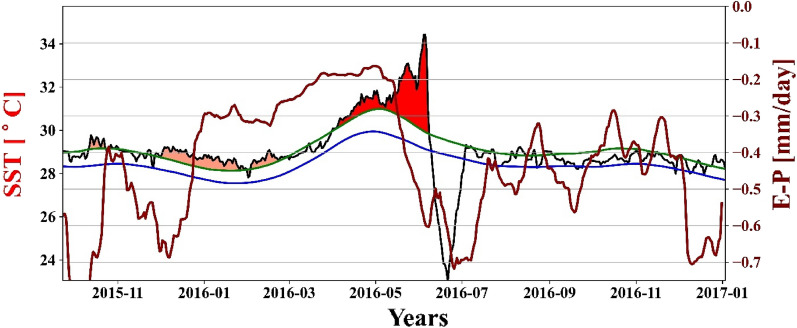
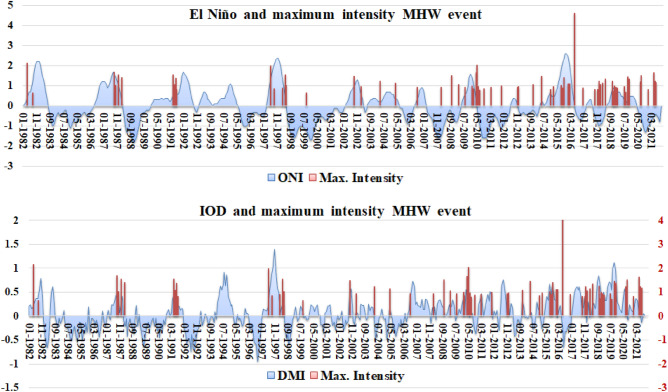
Anomalous increase in sea surface temperature and its impact on natural ecosystems greatly interests the research community. Here we investigate the causes, impacts, and trends of marine heat wave (MHW) events in the Bay of Bengal (BoB) from 1982 to 2021. A total of 107 MHW events have been isolated (> 90th percentile threshold) in this Indian Ocean region, and their variation in intensity, duration, and frequency has been investigated. Our research unveils that an average of three MHW events/year accompanied by a linearly increasing trend of 1.11 MHW events/decade has been observed over the study region. It was also found that the most intense event was observed in 2016, which continued for 69 days, and had a maximum intensity of 5.29 °C and a mean intensity of 2.03 °C (above climatology mean). Moreover, it was observed that the net heat flux, along with anticyclonic eddies, was the primary cause of MHW events. Anticyclonic eddies associated with positive sea surface height anomaly were observed (> 0.20 m) in the vicinity of the most intense MHW event. Additionally, climate change and climate modes like El Niño and Indian Ocean Dipole show a high positive influence on the MHW events. Furthermore, we have examined the MHW event recurrence patterns in various regions of the BoB. From the monthly analysis, it was found that August and November had the most occurrences of MHWs, while April and May had the most extreme MHW events.
© 2023. Springer Nature Limited.
Conflict of interest statement
The authors declare no competing interests.
Figures
References
-
- Stocker, T. (ed) Climate change 2013: The physical science basis. Working Group I Contribution to the Fifth Assessment Report of the Intergovernmental Panel on Climate Change (Cambridge University Press, 2014).
-
- Gnanaseelan C, Roxy MK, Deshpande A. Variability and trends of sea surface temperature and circulation in the Indian Ocean. In: Rajeevan MN, Nayak S, editors. Observed Climate Variability and Change Over the Indian Region. Singapore: Springer; 2017. pp. 165–179.
-
- Dong L, Zhou T, Wu B. Indian Ocean warming during 1958–2004 simulated by a climate system model and its mechanism. Clim. Dyn. 2014;42(1):203–217.
-
- Roxy MK, Ritika K, Terray P, Masson S. The curious case of Indian Ocean warming. J. Clim. 2014;27(22):8501–8509.
-
- Roemmich D, the Argo Steering Team Argo: The challenge of continuing 10 years of progress. Oceanography. 2009;22(3):46–55.
LinkOut - more resources
Full Text Sources
Miscellaneous
