. 2023 Aug 30;9(1):127.
doi: 10.1038/s41531-023-00566-1.

An interpretable multiparametric radiomics model of basal ganglia to predict dementia conversion in Parkinson's disease

Affiliations

An interpretable multiparametric radiomics model of basal ganglia to predict dementia conversion in Parkinson's disease

Chae Jung Park et al. NPJ Parkinsons Dis. .

Abstract

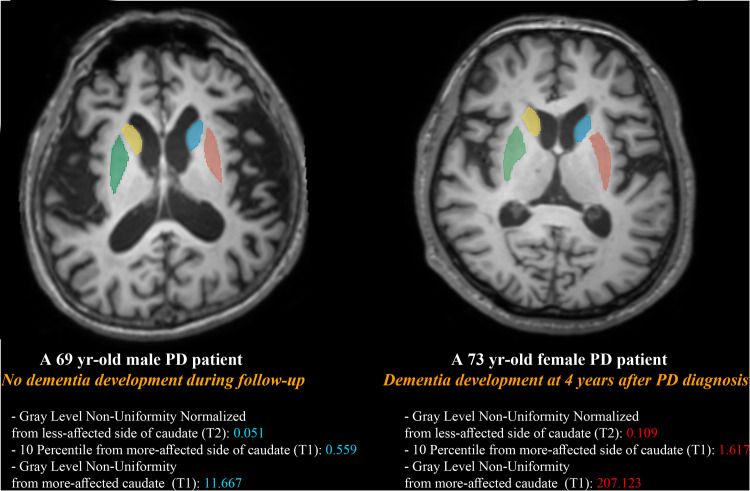
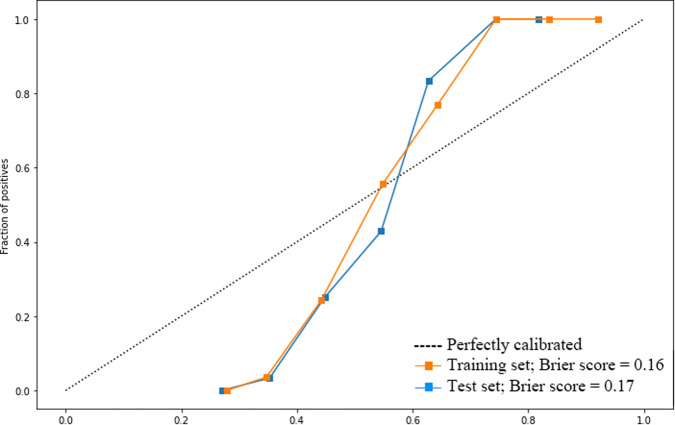
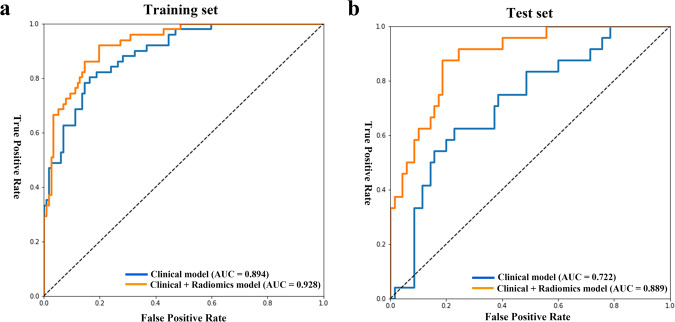
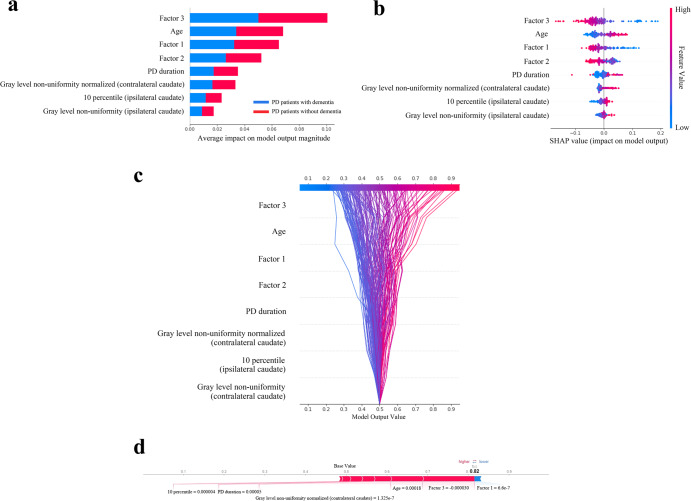
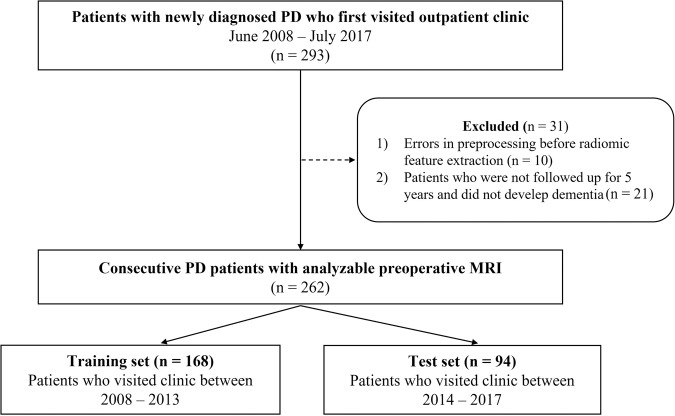
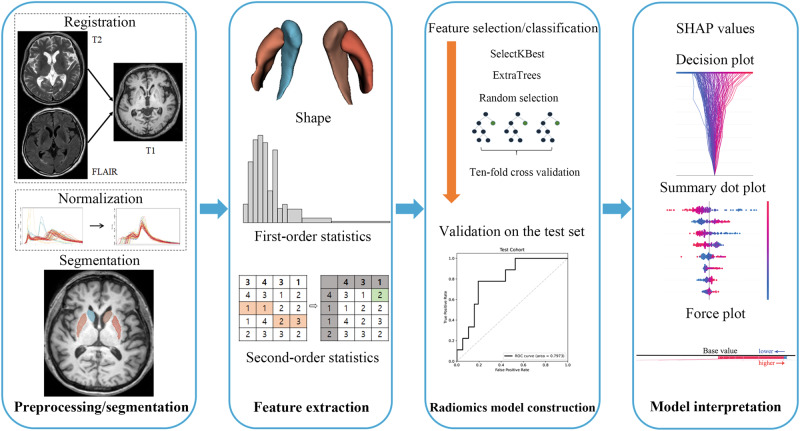
Cognitive impairment in Parkinson's disease (PD) severely affects patients' prognosis, and early detection of patients at high risk of dementia conversion is important for establishing treatment strategies. We aimed to investigate whether multiparametric MRI radiomics from basal ganglia can improve the prediction of dementia development in PD when integrated with clinical profiles. In this retrospective study, 262 patients with newly diagnosed PD (June 2008-July 2017, follow-up >5 years) were included. MRI radiomic features (n = 1284) were extracted from bilateral caudate and putamen. Two models were developed to predict dementia development: (1) a clinical model-age, disease duration, and cognitive composite scores, and (2) a combined clinical and radiomics model. The area under the receiver operating characteristic curve (AUC) were calculated for each model. The models' interpretabilities were studied. Among total 262 PD patients (mean age, 68 years ± 8 [standard deviation]; 134 men), 51 (30.4%), and 24 (25.5%) patients developed dementia within 5 years of PD diagnosis in the training (n = 168) and test sets (n = 94), respectively. The combined model achieved superior predictive performance compared to the clinical model in training (AUCs 0.928 vs. 0.894, P = 0.284) and test set (AUCs 0.889 vs. 0.722, P = 0.016). The cognitive composite scores of the frontal/executive function domain contributed most to predicting dementia. Radiomics derived from the caudate were also highly associated with cognitive decline. Multiparametric MRI radiomics may have an incremental prognostic value when integrated with clinical profiles to predict future cognitive decline in PD.


Conflict of interest statement

The authors declare no competing interests.

Figures

Fig. 1
Fig. 1. The representative figures from two patients with and without dementia development with their radiomic feature values.
Region of interests were drawn on both sides of caudate and putamen. A 69-year-old male who did not develop dementia during the follow-up period showed overall lower scores of selected three radiomic features compared to those from a 73-year-old female who develop dementia.
Fig. 2
Fig. 2. Calibration curves and Brier scores of the combined model (clinical + radiomic features) in both training and test sets.
The Brier score was 0.16 and 0.17 in the training and test set, respectively.
Fig. 3
Fig. 3. Receiver operating characteristics curves of the models in the training and test sets.
a In the training set, the combined clinical and radiomics model tended to show superior performance compared to that of the model with only clinical features (AUC: 0.928 vs. 0.894, P = 0.284, NRI = 0.119). b In the test set, the performance of the combined clinical and radiomics model was superior to that of the clinical model (AUC: 0.889 vs. 0.722, P = 0.016, NRI = 0.207). AUC area under the curve, NRI net reclassification index.
Fig. 4
Fig. 4. Model interpretability of the combined clinical and radiomics model for the prediction of dementia conversion with SHapley Additive exPlanations (SHAP) in the training set.
a Variance importance plot listing the most significant variables. Features with greater importance for the prediction of dementia conversion are positioned in the upper portion, and the features are presented in descending order. b Summary plot of feature impact on the decision of the model showing positive and negative relationships of the predictors with the target variable. A positive SHAP value indicates an increase in the probability of dementia conversion. c Decision plot showing how the model predicts dementia conversion. Starting at the bottom of the plot, the prediction line shows how the SHAP values accumulate from the base value to arrive at the model’s final score at the top of the plot, demonstrating how each feature contributes to the overall prediction. d Force plot of a representative patient who developed dementia during the follow-up period. Red arrows represent features that drive the prediction value higher, while blue arrows represent features that drive the prediction value lower. The size of each arrow represents the magnitude of the effect of the corresponding feature. Note that factor 3 and age largely push the model prediction score higher. Factor 1 visual memory/visuospatial function, Factor 2 verbal memory function, Factor 3 frontal/executive function.
Fig. 5
Fig. 5
Flowchart of patient enrollment.
Fig. 6
Fig. 6. Workflow of image preprocessing, radiomics feature extraction, and machine learning.
(1) Preprocessing and segmentation: For the radiomic feature extraction, registration of T2 and FLAIR to T1 images and normalization of signal intensities was performed. The regions of interest were put on the bilateral putamen and caudate. (2) Feature extraction: Three different categories of radiomic features—shape feature, first-order features, and second-order features were obtained. (3) Radiomics model construction: SelectKBest feature selection method combined with ExtraTrees classifier were used to develop two predictive models—clinical and combined (clinical + radiomics) model. The models were developed in the training set, then validated in the test set. (4) Model interpretation: We performed SHAP analysis to understand the contributing role of each selected radiomic feature and obtained decision plot, summary dot plot, and force plot.

Similar articles

Cited by

References

    1. Hely MA, et al. The Sydney multicenter study of Parkinson’s disease: the inevitability of dementia at 20 years. Mov. Disord. 2008;23:837–844. - PubMed
    1. Williams-Gray CH, et al. Evolution of cognitive dysfunction in an incident Parkinson’s disease cohort. Brain. 2007;130:1787–1798. - PubMed
    1. Stoessl AJ, Martin WRW, McKeown MJ, Sossi V. Advances in imaging in Parkinson’s disease. Lancet Neurol. 2011;10:987–1001. - PubMed
    1. McKinlay A, Grace RC, Dalrymple-Alford JC, Roger D. Characteristics of executive function impairment in Parkinson’s disease patients without dementia. J. Int. Neuropsychol. Soc. 2010;16:268–277. - PubMed
    1. Chung SJ, et al. Effect of striatal dopamine depletion on cognition in de novo Parkinson’s disease. Parkinsonism Relat. Disord. 2018;51:43–48. - PubMed