. 2023 Aug 30;14(1):5287.
doi: 10.1038/s41467-023-41020-3.

Critical dynamics arise during structured information presentation within embodied in vitro neuronal networks

Affiliations

Critical dynamics arise during structured information presentation within embodied in vitro neuronal networks

Forough Habibollahi et al. Nat Commun. .

Abstract

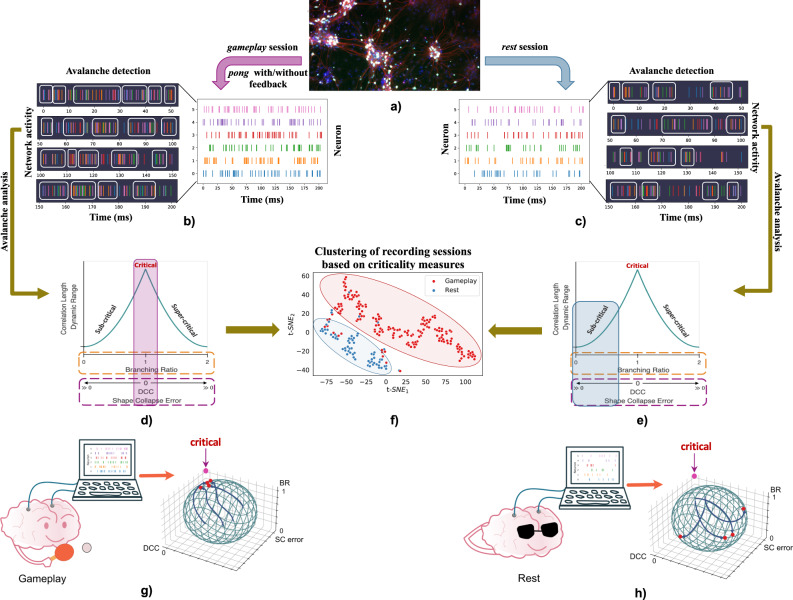
Understanding how brains process information is an incredibly difficult task. Amongst the metrics characterising information processing in the brain, observations of dynamic near-critical states have generated significant interest. However, theoretical and experimental limitations associated with human and animal models have precluded a definite answer about when and why neural criticality arises with links from attention, to cognition, and even to consciousness. To explore this topic, we used an in vitro neural network of cortical neurons that was trained to play a simplified game of 'Pong' to demonstrate Synthetic Biological Intelligence (SBI). We demonstrate that critical dynamics emerge when neural networks receive task-related structured sensory input, reorganizing the system to a near-critical state. Additionally, better task performance correlated with proximity to critical dynamics. However, criticality alone is insufficient for a neuronal network to demonstrate learning in the absence of additional information regarding the consequences of previous actions. These findings offer compelling support that neural criticality arises as a base feature of incoming structured information processing without the need for higher order cognition.


Conflict of interest statement

B.J.K. and F.H. are employees of Cortical Labs. B.J.K. is a shareholder of Cortical Labs and holds an interest in patents related to the use of criticality in neural cell cultures as a metric of interest. The remaining authors declare no competing interests.

Figures

Fig. 1
Fig. 1. Schematic overview of study.
a) Showing cortical cells harvested from embryonic rodents. b) & c) The recorded population activity from these cortical cells is then binned to 50 ms bins during both Gameplay and Rest sessions. The neuronal avalanches are cascades of network activity that surpass a certain activity threshold for a certain duration of time, which are then extracted by bin. d) & e) Avalanches are utilized to examine the criticality metrics in the neuronal network’s activity patterns to identify the working regime of each recording in terms of being sub-, super-, or near-critical. f) The same measures of criticality are used to cluster the recordings between two groups of Gameplay and Rest. g) & h) Illustration of the experimental pipeline in which cultured cortical networks are recorded during Gameplay and Rest states. The recorded neuronal activities are then employed to extract the 3 metrics of criticality (namely Branching Ratio (BR), Deviation from Criticality Coefficient (DCC), and Shape Collapse error (SC error)) which are found to move towards the critical point during Gameplay g) and move further from that point during Rest h).
Fig. 2
Fig. 2. Culture dynamics vary drastically when receiving structured information through gameplay related stimulation.
Avalanche size and duration PDF plots and the calculated DCC values for 2 representative sample cortical cultures at a) Rest (i.e. Session 1) and b) Gameplay (i.e. Session 4) of the same experiment and the corresponding α and τ exponents. DCC is given by ∥βpred − βfit∥; for details, see Table 1 and section Exponent relation and Deviation from Critically coefficient (DCC).
Fig. 3
Fig. 3. Comparison between critical and non-critical dynamics.
a) Illustration of the course of the expected change in the DCC measure when transitioning between near-critical and non-critical regimes. b) Comparison of the shape collapse error while scaling avalanche shapes in 2 sample recording sessions. Scaled avalanches across a range of durations show little error around the polynomial fit in the upper row (indicative of a near-critical regime) while this error increases significantly in the data represented at the bottom row (indicative of a non-critical regime). c) Effect of branching ratio (BR) on activity propagation through a network over time. In critical regimes, BR = 1.0 and, on average, activity neither saturates nor decays across time. df) DCC, BR, and SC error extracted for all the recordings and compared between Gameplay and Rest. The illustrated trend in all measures supports the conclusion of the system tuning near criticality during Gameplay. The Gameplay recordings display DCC and SC error values closer to 0 and branching ratios closer to 1; features which are missing in the Rest recordings. Box plots show interquartile range, with bars demonstrating 1.5X interquartile range, the line marks the median and the black triangle marks the mean. Error bands, 1 SE. *** indicates p < 5 × 10−4 and **** indicates p < 5 × 10−5. g) Summary of the key characteristics of a critical system compared between all Rest and Gameplay sessions as well as the corresponding performance level in terms of the observed H/M ratio. Error bars, SEM. **** indicates p < 5 × 10−5. The sample sizes of the box and bar plots are equal to the number of independent Gameplay recordings (n = 192) and Rest recordings (n = 116). Alexander-Govern approximation test with p = 7.836e − 06, p = 5.667e − 13, p = 2.460e − 07, and p = 3.356e − 06 for DCC, BR, SC error, and H/M ratio in Gameplay vs Rest. h) A weakly significant negative correlation was found between DCC and the neuronal culture performance in terms of H/M ratio (r = − 0.13, p < 0.05, Pearson Correlation test). i) A strongly significant positive association was observed between BR and H/M ratio (r = 0.24, p < 0.00005, Pearson Correlation test). j) A strongly significant negative correlation was found between SC error and H/M ratio (r = − 0.17, p < 0.005, Pearson Correlation test). Shades represent the 95% confidence intervals. Source data are provided as a Source Data file.
Fig. 4
Fig. 4. Critical dynamics are observed in subpopulations of neurons during Gameplay but not Rest and in different feedback conditions.
a) Visualization of the extracted representation for each data point using the t-SNE algorithm in a 2-dimensional space (i.e., dimensions t-SNE1 and t-SNE2). The two Rest and Gameplay classes are illustrated with different colors. b) DCC, c) BR, and d) SC error variations between Rest and Gameplay sessions in separate motor and sensory regions of the cultures. The illustrated trend in all three measures on the subpopulations is in line with the previous conclusion about the entire population. A similar pattern in these results also states that during Gameplay the neuronal ensembles move near criticality while in Rest, they are further from a critical state. ***p < 10−3, ****p < 10−5. Box plots show interquartile range, with bars demonstrating 1.5X interquartile range, the line marks the median and the black triangle marks the mean. Error bands, 1 SE. The sample sizes of the box and bar plots are equal to the number of independent Gameplay recordings (n = 192) and Rest recordings (n = 116). Alexander-Govern approximation test with p = 8.172e − 4,  p = 8.839e − 6, and p = 7.139e − 6 for DCC, BR, and SC error in the motor region and p = 5.627e − 12, p = 4.637e − 7, and p = 1.442e − 6 for DCC, BR, and SC error in the sensory region in Gameplay vs Rest. e) Comparing the average DCC measure calculated in different feedback conditions with the Rest sessions. ***p < 5 × 10−3, ****p < 10−10. Error bars, SEM. The sample sizes of the bar plots are the number of independent recordings during Rest or different feedback conditions, that is n = [209, 113, 119, 95] for Rest, Stimulus, Silent, and No-feedback. Source data are provided as a Source Data file.
Fig. 5
Fig. 5. Comparison of criticality metrics between different bursting patterns for either Gameplay or Rest.
ac) DCC, BR, and SC error of all Rest and Gameplay sessions for different size distributions of avalanches observed during Rest recordings of each culture. df) DCC, BR, and SC error of all Rest and Gameplay sessions for different types of burst rates observed during Rest recordings of each culture. Alexander-Govern approximation test was utilized. ***p < 5 × 10−3 with a) p = 8.335e − 4 during Rest, b) p = 4.705e − 3 during Gameplay, c) p = 1.064e − 4, and p = 6.423e − 8 during Gameplay and Rest respectively, e) p = 4.815e − 3 during Gameplay, and f) p = 9.514e − 5, and p = 1.068e − 5 during Gameplay and Rest respectively. Box plots show interquartile range, with bars demonstrating 1.5X interquartile range, the line marks the median and the black triangle marks the mean. Error bands, 1 SE. The sample sizes of the box plots are equal to the number of independent Gameplay recordings (n = 192) and Rest recordings (n = 116). Source data are provided as a Source Data file.

Similar articles

Cited by

References

    1. Plenz, D. et al. Self-organized criticality in the brain. arXiv preprint arXiv:2102.09124 (2021).
    1. Lotfi N, et al. Signatures of brain criticality unveiled by maximum entropy analysis across cortical states. Phys. Rev. E. 2020;102:012408. - PubMed
    1. Ma Z, Turrigiano GG, Wessel R, Hengen KB. Cortical circuit dynamics are homeostatically tuned to criticality in vivo. Neuron. 2019;104:655–664. - PMC - PubMed
    1. Cocchi L, Gollo LL, Zalesky A, Breakspear M. Criticality in the brain: A synthesis of neurobiology, models and cognition. Prog. Neurobiol. 2017;158:132–152. - PubMed
    1. Beggs JM, Plenz D. Neuronal avalanches in neocortical circuits. J. Neurosci. 2003;23:11167–11177. - PMC - PubMed

Publication types