. 2023 Aug;620(7976):1001-1006.
doi: 10.1038/s41586-023-06295-y. Epub 2023 Aug 30.

A microscale soft ionic power source modulates neuronal network activity

Affiliations

A microscale soft ionic power source modulates neuronal network activity

Yujia Zhang et al. Nature. 2023 Aug.

Abstract

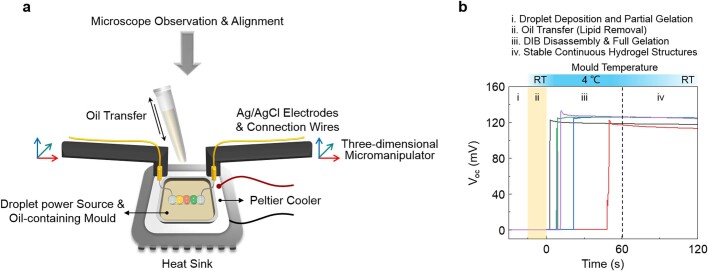
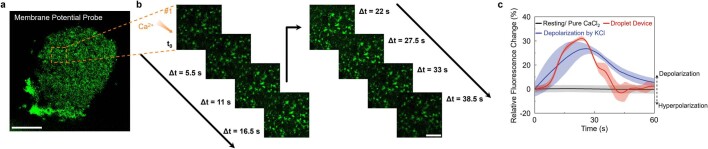
Bio-integrated devices need power sources to operate1,2. Despite widely used technologies that can provide power to large-scale targets, such as wired energy supplies from batteries or wireless energy transduction3, a need to efficiently stimulate cells and tissues on the microscale is still pressing. The ideal miniaturized power source should be biocompatible, mechanically flexible and able to generate an ionic current for biological stimulation, instead of using electron flow as in conventional electronic devices4-6. One approach is to use soft power sources inspired by the electrical eel7,8; however, power sources that combine the required capabilities have not yet been produced, because it is challenging to obtain miniaturized units that both conserve contained energy before usage and are easily triggered to produce an energy output. Here we develop a miniaturized soft power source by depositing lipid-supported networks of nanolitre hydrogel droplets that use internal ion gradients to generate energy. Compared to the original eel-inspired design7, our approach can shrink the volume of a power unit by more than 105-fold and it can store energy for longer than 24 h, enabling operation on-demand with a 680-fold greater power density of about 1,300 W m-3. Our droplet device can serve as a biocompatible and biological ionic current source to modulate neuronal network activity in three-dimensional neural microtissues and in ex vivo mouse brain slices. Ultimately, our soft microscale ionotronic device might be integrated into living organisms.


Conflict of interest statement

The authors declare no competing interests.

Figures

Fig. 1
Fig. 1. Structure and output performance of the droplet power source.
ac, Fabrication process for a power unit formed by depositing hydrogel droplets: pre-gel droplets were submerged in lipid-containing oil and acquired lipid monolayer coatings, which subsequently formed lipid bilayers when droplets were placed in contact (a); the insulating lipid prevented ion flux between droplets when they were connected to form a single unit (b); Ag/AgCl electrodes were used to measure electrical output, and the power source was activated by transfer into lipid-free oil and thermal gelation to rupture the lipid bilayers (Methods; c). The current direction within the device is from left to right; that is, cations move from the left to the central droplet and anions move from the right to the central droplet. d, Bright-field images of the formation process of a droplet power unit. In (i) to (iii), the volume of each droplet was 50 nl. Scale bars, 500 μm. Panel (iii) shows the insertion of Ag/AgCl electrodes. In (iv) and (v), droplets were encapsulated in a flexible and compressible organogel to demonstrate energy preservation in a portable unit. The volume of each droplet was 500 nl. Scale bars, 10 mm. e, Output open-circuit voltage (VOC) during the transition from pre-gel (i) to gel (ii) to continuous hydrogel network (iii), as shown in d. Inset: output short-circuit current (ISC) of a droplet power unit after formation of a continuous hydrogel network (iii). f, Variation of normalized VOC and mean droplet diameter of single power units with different length of storage time in oil before the formation of continuous hydrogel networks. Normalization was with respect to the initial values of each experiment. The diameter of the droplets decreased over time owing to the evaporation of water. Data in e,f are mean values ± s.d. (n = 7). Source data
Fig. 2
Fig. 2. Effect of droplet volume on the electrical characteristics of droplet power sources.
a, Initial (t = 0) VOC and ISC values. Droplet volumes below 100 nl were calculated on the basis of diameters measured by microscopy. b, Calculated power densities and total released charge of single power units with various droplet volumes. The power source volume and length were five times that of a single-droplet volume and diameter. c, Normalized VOC, ISC and total released charge of power units formed into droplet networks in series and/or in parallel. The volume of each droplet was 1.84 nl. 2 × 2 stands for two sets of two paralleled power units in series. Inset: schematics showing the power units that were formed into continuous droplet networks during measurements. The normalization was with respect to the outputs of a single unit. Data are mean values ± s.d. (n = 5). Source data
Fig. 3
Fig. 3. Template-assisted droplet network fabrication and output.
a,b, Preparation of a large-scale patterned power source network. First, seven droplets were deposited in a mould, by using a programmable microinjector, and formed a hexagonal ‘flower-like’ structure (a). Droplet networks can be drawn into a truncated pipette tip by capillary action and arranged in three dimensions. Hexagonal assemblies of droplets were layered to form larger droplet networks (b). n refers to the number of units. c, Bright-field images of a mould with multiple droplet hexagons. The volume of each droplet was about 4 nl. Scale bar, 600 μm. d, Zoom-in of a single hexagonal layer. Scale bar, 200 μm. e, Stacks of 7 and 28 power units. Scale bar, 600 μm. f, After four-step sequential deposition into a spiral mould, droplets self-assembled into a chain of power units (Methods). g,h, Twenty power units were connected (g; scale bar, 1.2 mm) to generate an output voltage sufficient to light up a red light-emitting diode (h).
Fig. 4
Fig. 4. Neuronal modulation induced by the ionic droplet device.
a, The triggering strategy used to modulate neuronal activity by generating ionic current from a droplet device. The high-salt and ion-selective droplets together acted as a droplet device, which was attached to droplets that contained neural microtissues or ex vivo mouse brain slices. Droplet no. 1, no. 2 and no. 3 received a cation influx from the left and an anion influx from the right. b, The ionic-current-modulated neuronal activity as reflected by intracellular Fluo-4 fluorescence. c, Output of the droplet device across the low-salt droplets. The voltage readout was conducted in open-circuit mode to ensure that the continuous hydrogel network was the only current path (n = 5). The volume of each droplet was 500 nl. The average voltage during the first 10 min was 120 mV. The corresponding ionic current was about 2.6 µA. d, Frames at various time points showing neurons embedded in droplet no. 1. Neurons were cultured for different periods (day 3 and 17), and reflected a change of neuronal network activities. The high-salt droplets contained 0.5 M CaCl2. Ionic current flowed from left to right into droplet no. 1. Orange dashed lines mark the modulated area. Scale bars, 150 μm. e, Relative fluorescence intensities at different time points along the white dashed lines indicated in d. The black dot in each plot indicates the centre of fluorescence (weighted-mean distance) at the corresponding time point. a.u., arbitrary units. f, Relative displacement of the centre of fluorescence over 90 s for neuronal networks after different culture periods and in ex vivo brain slices from mice. GABA treatment was used on the day-17 neural tissues to suppress activities of neuronal networks (n = 3; *P < 0.05; **P < 0.01; NS, not significant; unpaired one-tail t-test). Data in f are presented as mean values ± s.d. Source data
Extended Data Fig. 1
Extended Data Fig. 1. Electricity-generating mechanism of the electric eel.
a, Location of the electric organ in the electric eel (Electrophorus electricus). b, Electrocytes stacked within the organ generate an electrical potential, which arises as depicted from directional ion fluxes through sodium and potassium channels.
Extended Data Fig. 2
Extended Data Fig. 2. Measurement of power source activation during DIB rupture.
a, The integration of a Peltier cooler and a heat sink to the bottom of the droplet measurement system enabled electrical readouts during temperature-triggered droplet gelation and oil transfer. b, Output VOC during droplet network formation (i) and the activation process (ii and iii). Five independent droplet power sources were all activated within 60 s (iv).
Extended Data Fig. 3
Extended Data Fig. 3. SEBS organogel encapsulation enabled preservation of droplet networks in physiological environments.
a, Schematic showing the SEBS organogel encapsulation. b, Photographs of a droplet power source formed from 500 nL droplets and encapsulated in an organogel cube. Comparison with a one-penny coin (20.3 mm diameter). c, The encapsulated droplet power source is soft and can withstand repeated bending and twisting by hand. d, The open-circuit voltages are shown for droplet power sources encapsulated in organogel after 30 min immersion in phosphate buffered saline (pH 7.4, Gibco) or rabbit blood (New Zealand white rabbit strain, Envigo).
Extended Data Fig. 4
Extended Data Fig. 4. Optimization of the droplet power source for maximal output.
a, VOC and ISC of single power units with different concentration gradients between the high-salt and low-salt droplets, with the high-salt droplets set at 2 M CaCl2. b, VOC and ISC of single power units with different salt concentrations in the low-salt droplets, with the concentration gradient set at 10-fold (see Supplementary Note 3 for detailed discussion). c, The dependence of output voltage, current, and power of a single power unit on the external loading resistance. The instantaneous output power reached a maximum (75 nW for 50 nL droplets) when the loading resistance was set around 78 kΩ. The output voltage, current, and power were typical of a concentration cell, showing a positive correlation between voltage and load resistance, while the current followed a reverse trend. Data are presented as mean ± s.d. (n = 5).
Extended Data Fig. 5
Extended Data Fig. 5. Cell viability study and immunofluorescence staining of neural microtissues before and after treatment of the droplet device.
a, Cell viability in neuron-containing droplets, which had been connected to droplet devices for 10 min and then cultured in medium for 4, 12, 24, and 48 h. The control group was neural microtissues embedded in agarose droplets and not placed in contact with a droplet device. Salt concentrations in the high-salt droplets (CaCl2) were: 0.5 M (50-fold gradient, light blue); 1 M (100-fold gradient, dark blue). Data are presented as mean ± s.d. (n = 5). b, Fluorescence (bottom) and overlaid bright-field (top) live/dead imaging of microtissues embedded in agarose droplets. Calcein-AM (live, green) and PI (dead, red) staining were conducted after droplet device (0.5 M) modulation. Scale bars, 600 μm. c and d, RFP-labelled microtissues were stained for the neuronal cell marker TUJ1 and the apoptosis marker caspase 3. RFP is expressed by live cells; the TUJ1 staining reveals the neuronal cells including their processes; the caspase 3 staining reveals apoptotic cells. The control group (c, Day 10) was not contacted with a droplet device. The experimental group had been connected with the droplet device for 10 min and then cultured in medium for 48 h (d, Day 12). Salt concentrations in the high-salt droplets (CaCl2) were 0.5 M (50-fold gradient). e, The number of apoptotic cells in an area of 100 × 100 μm2. Data are presented as mean ± s.d. (n = 6).
Extended Data Fig. 6
Extended Data Fig. 6. Droplet configurations for verification of the modulatory effects of droplet devices on neural microtissues.
a, Direct contact of neuron-containing droplets (neurons cultured for 3 days) with high-salt droplets (0.5 M CaCl2). b, Frames at various time-points showing a low level of stable intrinsic fluorescence (amplified). Scale bar, 300 μm. c, Applying an external voltage to Ag/AgCl electrodes in Ca2+-free hydrogel droplets in contact with droplets containing neural microtissues. Droplet #1 received a positive input voltage relative to droplet #3. The resulting current was ~2.6 µA, which is similar to that produced by the droplet device. d, Frames at various time-points showing neurons embedded in the #1 droplet. The neurons had been cultured for different periods (3 and 17 days). Ionic current flowed from left to right into the #1 droplet. Red dashed lines mark the border of the modulated area of the Ca2+ wave. Scale bars, 150 μm. e, Relative fluorescence changes for neural microtissues after modulation by various means. The control group was neuron-containing droplets in direct contact with high-salt droplets (a). The “electrical” group was subjected to an external voltage source (b). The droplet device group is documented in Fig. 4.
Extended Data Fig. 7
Extended Data Fig. 7. Monitoring the change of neuronal membrane potential after attachment of the droplet device.
a, Neuronal membrane potential was measured by confocal imaging using FluoVolt™, a voltage-sensitive fluorescent probe (Methods). Scale bar, 200 μm. b, Frames at various time-points of a zoom-in area in (a) showing the fluorescence change after attachment to a droplet device. Ionic current flowed from top-left to bottom-right of the selected area. Scale bar, 50 μm. c, Relative fluorescence change of individual neurons after attachment of the droplet device. The black curve represents neurons in direct contact with high-salt droplets (0.5 M CaCl2). The stable fluorescence indicates that the neurons remain in a resting state. The red curve represents neurons under droplet device modulation (see b) and the blue curve represents neurons depolarized by adding 20 mM KCl solution. Three neural microtissues were tested under each condition and five cells from each were randomly selected for fluorescence quantification.
Extended Data Fig. 8
Extended Data Fig. 8. Effect of the droplet device on various neuronal networks.
a, Neuronal network cultured for 10 days. High-salt droplets contained 0.5 M CaCl2. Ionic current flowed from left to right into the #1 droplet. Orange dashed lines mark the modulated area with increased fluorescence intensity. b, Profile plots of relative fluorescence intensities at different time-points along the white dashed line indicated in (a). Ionic current flowed from left to right. The black dot in each plot indicates the Weighted-mean Distance at that time-point. c, In the same setup, part of an ex vivo mouse brain slice was embedded in a hydrogel droplet for treatment with the droplet device. d, Profile plots for (c) and the Weighted-mean Distances at each time-point. e, In the same setup, day 17 neurons were treated with GABA before treatment with the droplet device. f, Profile plots for (e) and the Weighted-mean Distances at each time-point. Scale bars in (a), (c), and (e), 300 μm.
Extended Data Fig. 9
Extended Data Fig. 9. Direct attachment of the droplet device to a mouse brain slice.
a, Direct response of a mouse brain slice without a hydrogel coating to the droplet device. High-salt droplets contained 0.5 M CaCl2. The two ion-selective droplets were separated by a distance of ~300 μm. b, Orange dashed lines mark the modulated area, which has increased fluorescence intensity. The fluorescence response of the brain slice was less directional and uneven compared to the neural microtissues, which might be due to the different neuronal wirings or tissue structures in different regions of the brain slice. Scale bar, 150 μm.

Similar articles

Cited by

References

    1. Choi S, Lee H, Ghaffari R, Hyeon T, Kim D-H. Recent advances in flexible and stretchable bio-electronic devices integrated with nanomaterials. Adv. Mater. 2016;28:4203–4218. doi: 10.1002/adma.201504150. - DOI - PubMed
    1. Kim J, Campbell AS, de Ávila BE-F, Wang J. Wearable biosensors for healthcare monitoring. Nat. Biotechnol. 2019;37:389–406. doi: 10.1038/s41587-019-0045-y. - DOI - PMC - PubMed
    1. Chung HU, et al. Binodal, wireless epidermal electronic systems with in-sensor analytics for neonatal intensive care. Science. 2019;363:eaau0780. doi: 10.1126/science.aau0780. - DOI - PMC - PubMed
    1. Wang C, et al. Inverted battery design as ion generator for interfacing with biosystems. Nat. Commun. 2017;8:15609. doi: 10.1038/ncomms15609. - DOI - PMC - PubMed
    1. Yang C, Suo Z. Hydrogel ionotronics. Nat. Rev. Mater. 2018;3:125–142. doi: 10.1038/s41578-018-0018-7. - DOI