. 2023 Aug;620(7976):982-987.
doi: 10.1038/s41586-023-06419-4. Epub 2023 Aug 30.

Champion-level drone racing using deep reinforcement learning

Affiliations

Champion-level drone racing using deep reinforcement learning

Elia Kaufmann et al. Nature. 2023 Aug.

Abstract

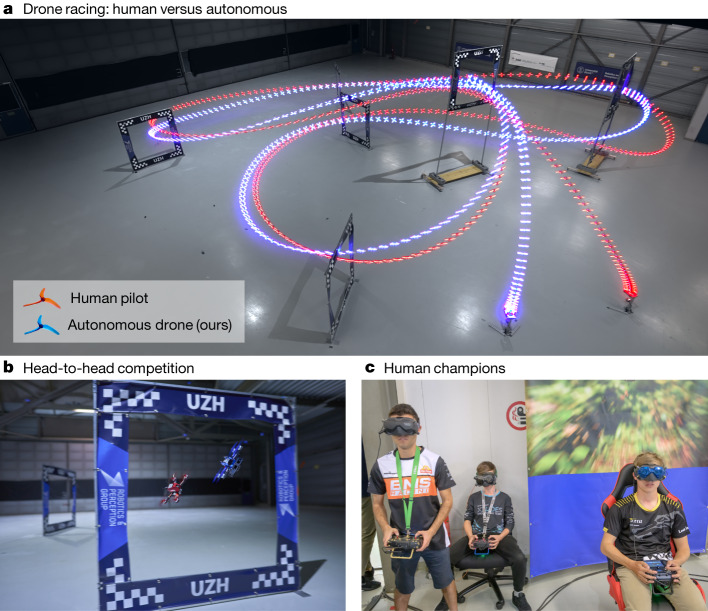
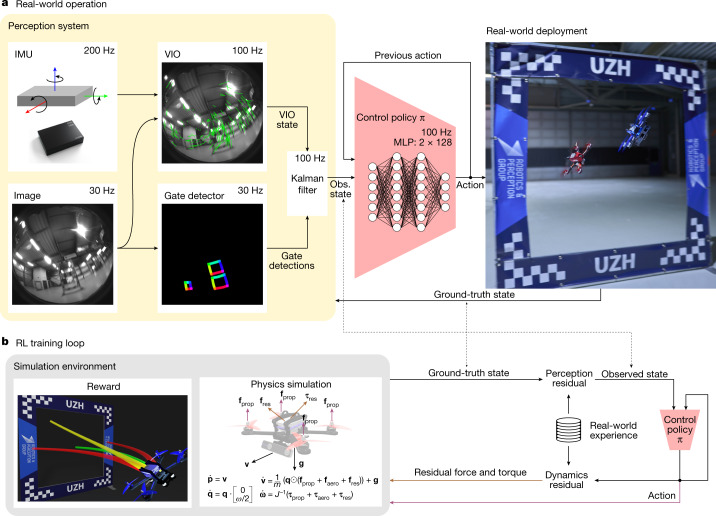
First-person view (FPV) drone racing is a televised sport in which professional competitors pilot high-speed aircraft through a 3D circuit. Each pilot sees the environment from the perspective of their drone by means of video streamed from an onboard camera. Reaching the level of professional pilots with an autonomous drone is challenging because the robot needs to fly at its physical limits while estimating its speed and location in the circuit exclusively from onboard sensors1. Here we introduce Swift, an autonomous system that can race physical vehicles at the level of the human world champions. The system combines deep reinforcement learning (RL) in simulation with data collected in the physical world. Swift competed against three human champions, including the world champions of two international leagues, in real-world head-to-head races. Swift won several races against each of the human champions and demonstrated the fastest recorded race time. This work represents a milestone for mobile robotics and machine intelligence2, which may inspire the deployment of hybrid learning-based solutions in other physical systems.


Conflict of interest statement

The authors declare no competing interests.

Figures

Fig. 1
Fig. 1. Drone racing.
a, Swift (blue) races head-to-head against Alex Vanover, the 2019 Drone Racing League world champion (red). The track comprises seven square gates that must be passed in order in each lap. To win a race, a competitor has to complete three consecutive laps before its opponent. b, A close-up view of Swift, illuminated with blue LEDs, and a human-piloted drone, illuminated with red LEDs. The autonomous drones used in this work rely only on onboard sensory measurements, with no support from external infrastructure, such as motion-capture systems. c, From left to right: Thomas Bitmatta, Marvin Schaepper and Alex Vanover racing their drones through the track. Each pilot wears a headset that shows a video stream transmitted in real time from a camera aboard their aircraft. The headsets provide an immersive ‘first-person-view’ experience. c, Photo by Regina Sablotny.
Fig. 2
Fig. 2. The Swift system.
Swift consists of two key modules: a perception system that translates visual and inertial information into a low-dimensional state observation and a control policy that maps this state observation to control commands. Control commands specify desired collective thrust and body rates, the same control modality that the human pilots use. a, The perception system consists of a VIO module that computes a metric estimate of the drone state from camera images and high-frequency measurements obtained by an inertial measurement unit (IMU). The VIO estimate is coupled with a neural network that detects the corners of racing gates in the image stream. The corner detections are mapped to a 3D pose and fused with the VIO estimate using a Kalman filter. b, We use model-free on-policy deep RL to train the control policy in simulation. During training, the policy maximizes a reward that combines progress towards the centre of the next racing gate with a perception objective to keep the next gate in the field of view of the camera. To transfer the racing policy from simulation to the physical world, we augment the simulation with data-driven residual models of the vehicle’s perception and dynamics. These residual models are identified from real-world experience collected on the race track. MLP, multilayer perceptron.
Fig. 3
Fig. 3. Results.
a, Lap-time results. We compare Swift against the human pilots in time-trial races. Lap times indicate best single lap times and best average times achieved in a heat of three consecutive laps. The reported statistics are computed over a dataset recorded during one week on the race track, which corresponds to 483 (115) data points for Swift, 331 (221) for A. Vanover, 469 (338) for T. Bitmatta and 345 (202) for M. Schaepper. The first number is the number of single laps and the second is the number of three consecutive laps. The dark points in each distribution correspond to laps flown in race conditions. b, Head-to-head results. We report the number of head-to-head races flown by each pilot, the number of wins and losses, as well as the win ratio.
Fig. 4
Fig. 4. Analysis.
a, Comparison of the fastest race of each pilot, illustrated by the time behind Swift. The time difference from the autonomous drone is computed as the time since it passed the same position on the track. Although Swift is globally faster than all human pilots, it is not necessarily faster on all individual segments of the track. b, Visualization of where the human pilots are faster (red) and slower (blue) compared with the autonomous drone. Swift is consistently faster at the start and in tight turns, such as the split S. c, Analysis of the manoeuvre after gate 2. Swift in blue, Vanover in red. Swift gains time against human pilots in this segment as it executes a tighter turn while maintaining comparable speed. d, Analysis of the split S manoeuvre. Swift in blue, Vanover in red. The split S is the most challenging segment in the race track, requiring a carefully coordinated roll and pitch motion that yields a descending half-loop through the two gates. Swift gains time against human pilots on this segment as it executes a tighter turn with less overshoot. e, Illustration of track segments used for analysis. Segment 1 is traversed once at the start, whereas segments 2–4 are traversed in each lap (three times over the course of a race).
Extended Data Fig. 1
Extended Data Fig. 1. Residual models.
a, Visualization of the residual observation model and the residual dynamics model identified from real-world data. Black curves depict the residual observed in the real world and coloured lines show 100 sampled realizations of the residual observation model. Each plot depicts an entire race, that is, three laps. b, Predicted residual observation for a simulated rollout. Blue, ground-truth position provided by the simulator; orange, perturbed position generated by the Gaussian process residual.
Extended Data Fig. 2
Extended Data Fig. 2. Multi-iteration fine-tuning.
Rollout comparison after fine-tuning the policy for one iteration (blue) and two iterations (orange).

Similar articles

Cited by

References

    1. De Wagter C, Paredes-Vallés F, Sheth N, de Croon G. Learning fast in autonomous drone racing. Nat. Mach. Intell. 2021;3:923. doi: 10.1038/s42256-021-00405-z. - DOI
    1. Hanover, D. et al. Autonomous drone racing: a survey. Preprint at https://arxiv.org/abs/2301.01755 (2023).
    1. Sutton, R. S. & Barto, A. G. Reinforcement Learning: An Introduction (MIT Press, 2018).
    1. Mnih V, et al. Human-level control through deep reinforcement learning. Nature. 2015;518:529–533. doi: 10.1038/nature14236. - DOI - PubMed
    1. Schrittwieser J, et al. Mastering Atari, Go, chess and shogi by planning with a learned model. Nature. 2020;588:604–609. doi: 10.1038/s41586-020-03051-4. - DOI - PubMed