. 2023 Nov;37(11):2237-2249.
doi: 10.1038/s41375-023-02013-9. Epub 2023 Aug 30.

Frequent ZNF217 mutations lead to transcriptional deregulation of interferon signal transduction via altered chromatin accessibility in B cell lymphoma

Affiliations

Frequent ZNF217 mutations lead to transcriptional deregulation of interferon signal transduction via altered chromatin accessibility in B cell lymphoma

Franziska Briest et al. Leukemia. 2023 Nov.

Abstract

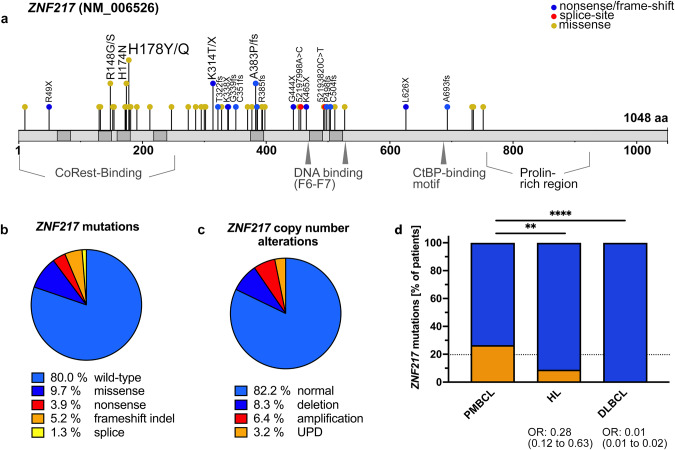
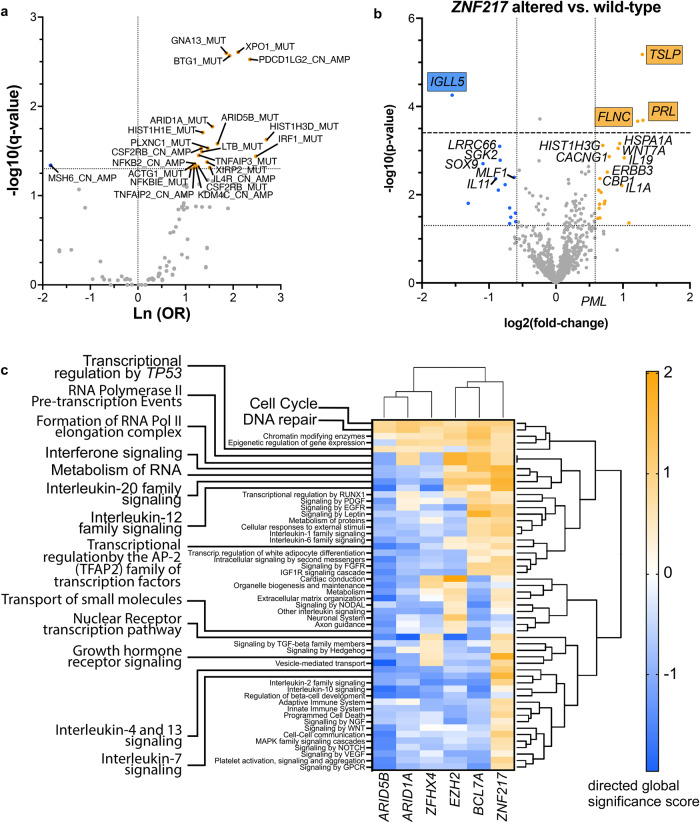
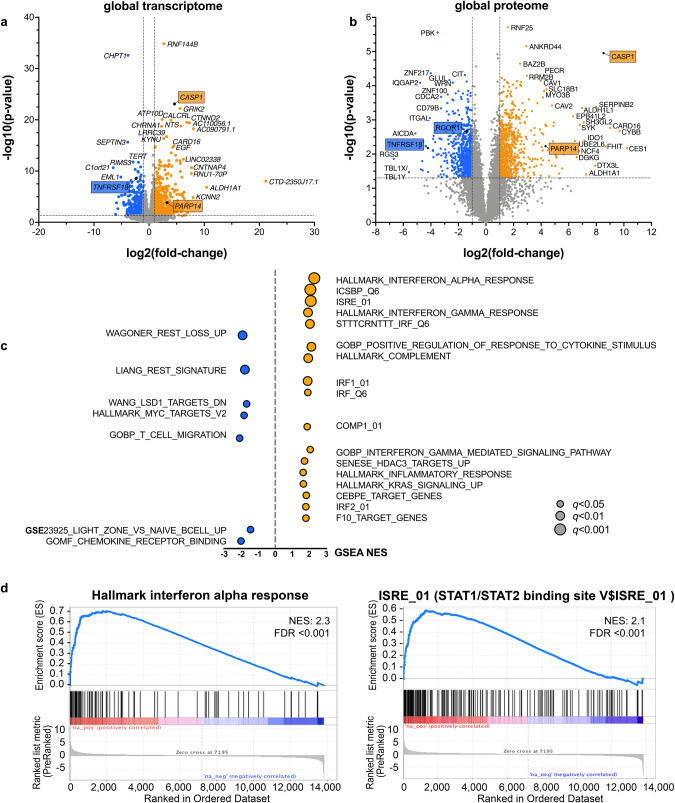
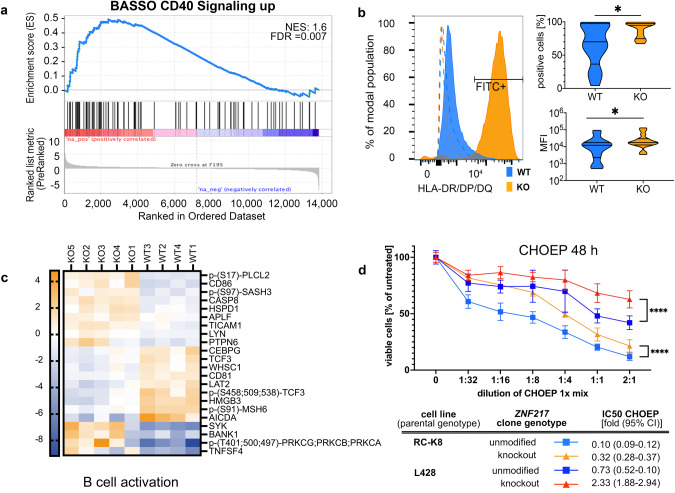
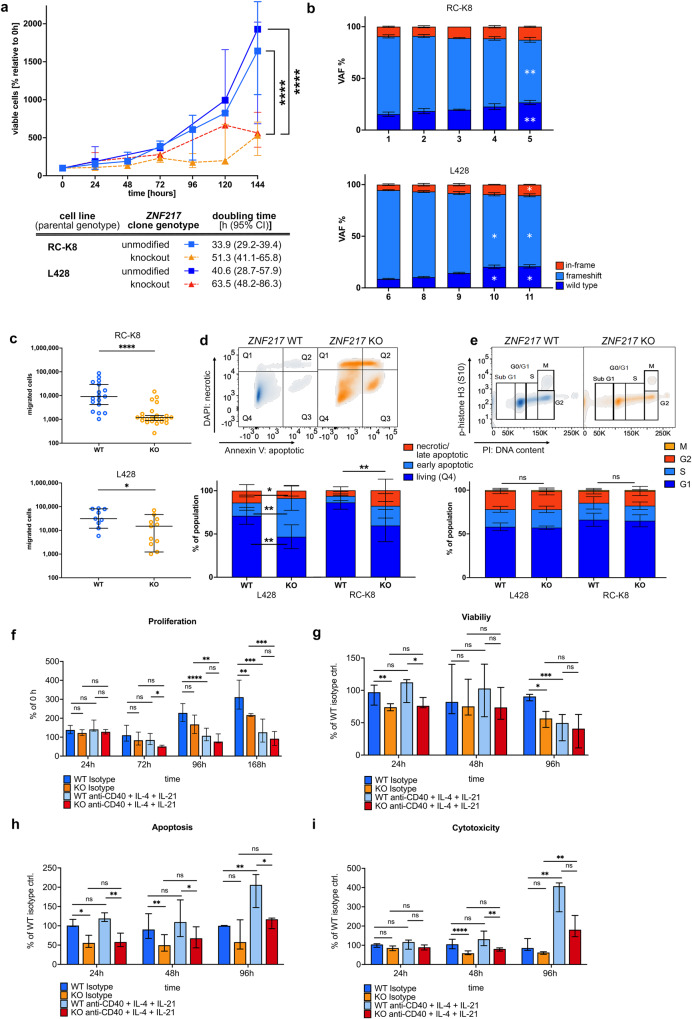
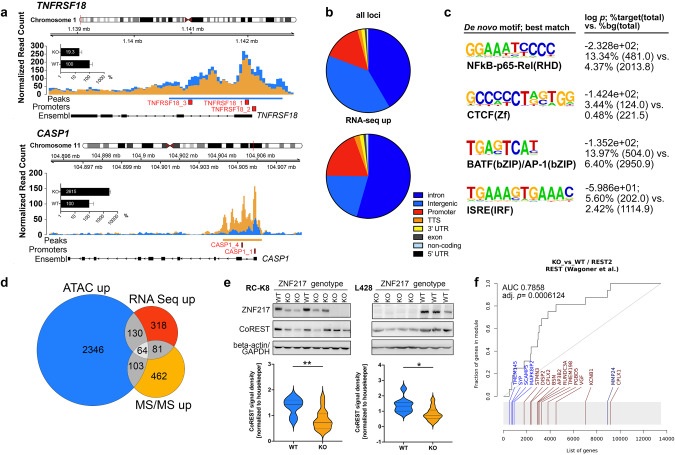
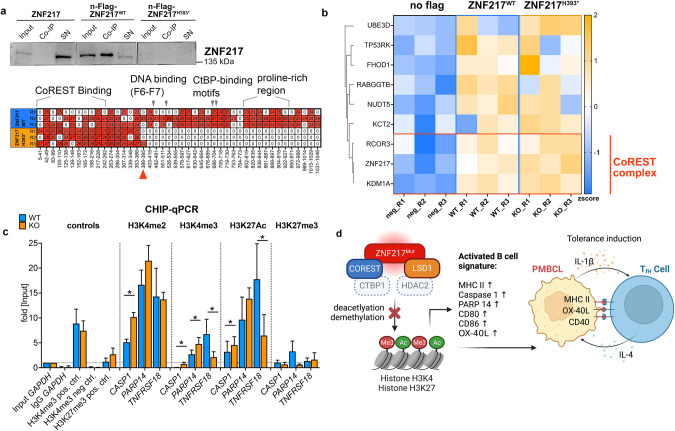
Recent exome-wide studies discovered frequent somatic mutations in the epigenetic modifier ZNF217 in primary mediastinal B cell lymphoma (PMBCL) and related disorders. As functional consequences of ZNF217 alterations remain unknown, we comprehensively evaluated their impact in PMBCL. Targeted sequencing identified genetic lesions affecting ZNF217 in 33% of 157 PMBCL patients. Subsequent gene expression profiling (n = 120) revealed changes in cytokine and interferon signal transduction in ZNF217-aberrant PMBCL cases. In vitro, knockout of ZNF217 led to changes in chromatin accessibility interfering with binding motifs for crucial lymphoma-associated transcription factors. This led to disturbed expression of interferon-responsive and inflammation-associated genes, altered cell behavior, and aberrant differentiation. Mass spectrometry demonstrates that ZNF217 acts within a histone modifier complex containing LSD1, CoREST and HDAC and interferes with H3K4 methylation and H3K27 acetylation. Concluding, our data suggest non-catalytic activity of ZNF217, which directs histone modifier complex function and controls B cell differentiation-associated patterns of chromatin structure.


Conflict of interest statement

FB received honoraria from Ipsen Pharma and funding from Novartis, both unrelated to the project. DN received honoraria from Incyte Biosciences and Gilead. RR received honoraria from AbbVie, AstraZeneca, Janssen, Illumina and Roche. LB has received honoraria from AbbVie, Amgen, Astellas, BristolMyers Squibb, Celgene, Daiichi Sankyo, Gilead, Hexal, Janssen, Jazz Pharmaceuticals, Menarini, Novartis, Pfizer, Roche, Sanofi, and Seattle Genetics, and has received research support from Bayer and Jazz Pharmaceuticals. FD reports personal fees from AbbVie, AstraZeneca, Gilead, Incyte, Novartis, and Roche outside the submitted work. The other authors declare that they have no competing financial interests.

Figures

Fig. 1
Fig. 1. ZNF217 aberrations in PMBCL patients.
a Mutation diagram (lolliplot) for ZNF217. 31/157 PMBCL samples (19.7%) harbored ZNF217 SNVs or indels. Hot-spot mutations, truncating mutations (blue) and splice mutations (red) were labeled with specification of the alteration, SNVs are visualized in yellow. Domain data was obtained from Nunez et al. [55] and https://www.uniprot.org/. b Distribution of mutation types and c CNA of n = 157 PMBCL patients. In case of >1 alteration, the most deleterious type was attributed to the patient. d Comparison of ZNF217 mutation prevalence in PMBCL, HL and DLBCL. Patient-level data of ZNF217 was extracted from our data set and previous studies in PMBCL [7, 15], HL [–19], and DLBCL [–58]. Merged data were compared by two-sided fisher’s exact test. 95% CI of OR was calculated by Baptista-Pike method. Individual prevalence of the mutated gene in the present study is indicated by the dashed line.
Fig. 2
Fig. 2. Gene expression in ZNF217 altered PMBCL.
a Volcano plot showing systematic evaluation of pairwise associations between mutated ZNF217 and mutations or copy-number alterations in other genes of the targeted panel. 2 × 2 contingency tables were generated for each pair followed by Fisher’s exact tests and adjustment for multiple testing using Benjamini-Hochberg correction. y-axis displays the q-value of each pair as -log10(q) (dotted line indicates q < 0.05). x-axis represents the strength of the correlation expressed as log odds where blue dots indicate mutually exclusive and orange dots co-mutated genomic lesions. b RNA was isolated from n = 120 PMBCL patients and analyzed with the human nCounter PanCancer Pathways panel probe set (Nanostring). Volcano plot shows differentially higher (orange) and lower (blue) expressed transcripts with their log2-fold change on the x-axis. Y-axis shows -log10(p) (dotted line indicates p < 0.05; dashed line indicates FDR < 0.05). c Differential expression at gene set level. Global directed gene expression heatmap on gene set level, bearing either ≥1 copy-number changes and/or ≥1 SNV in either ARID5B, ARID1A, ZFHX4, EZH2, BCL7A, or ZNF217 versus respective wild types demonstrated substantial differences in the global perturbation patterns induced by ZNF217 alterations. Gene expression was analyzed by use of an extended nCounter PanCancer probe panel (Nanostring technologies). Directed global significance score was calculated using the Nanostring nSolver 4.0.70 software as the square root of the mean signed squared t-statistic for the genes in a gene set, with t-statistics coming from the linear regression underlying the differential expression analysis. Pathways with the highest and smallest differences in pathway scores between ZNF217 and ARID1A were highlighted.
Fig. 3
Fig. 3. Gene expression after knockout of ZNF217 in aggressive lymphoma cell lines.
a RC-K8 cells (ZNF217KO: n = 7; ZNF217WT: n = 4) were bulk sequenced by RNA-Sequencing for transcriptome analysis. Genetic modification of ZNF217 resulted in large changes in gene expression triggering the significantly altered expression of 1022 genes (log2-fold change <-0.5/ > 0.5; q < 0.05). Genes chosen for further evaluation by CHIP-qPCR are marked. b Additional analysis of the global proteome of ZNF217KO (n = 5) versus ZNF217WT cells (n = 4) verified the data obtained from transcriptomic analysis with high consistency. Proteins subjected to further analyses are marked. c Pre-ranked gene set enrichment analysis (GSEA) was performed including the following gene sets collections from https://www.gsea-msigdb.org: MSigDB: (H) Hallmark, (C5) GO, (C3) TFT, (C2) CP: REACTOME, custom DB (defined Supplementary Table S8). Genes having at least one occurrence of transcription factor binding motifs of STAT1, IRF8, C/EBP-epsilon, IRF1 or IRF2, respectively, were significantly enriched [59]. Enrichment data for each enriched gene set can be found in Supplementary Table S8. Graphs show normalized enrichment scores (NES) and false discovery rate (FDR) q-values of GSEA analysis. d Enrichment plots for two of the top-ranked gene sets Hallmark Interferon-alpha response and ISRE_01 are shown in detail. ISRE corresponds to STAT1/2 transcription factor binding and indicates interferon I downstream signaling. Abbreviations: WT ZNF217 wild type, KO ZNF217 knockout.
Fig. 4
Fig. 4. B cell activation signature after knockout of ZNF217.
a Pre-ranked gene set enrichment analysis (GSEA) was performed based on a gene signature derived from CD40 activation [60]. Graph shows normalized enrichment scores (NES) and false discovery rate (FDR) q-values of GSEA analysis b Flow cytometry analysis of MHC class II presentation of ZNF217KO (n = 15) and ZNF217WT (n = 13; data obtained from n = 3 independent experiments). Left side: representative histogram of fluorescence shift comparing one anti-HLA-DR/DP/DQ-FITC-stained WT with one randomly assigned KO sample. Dashed lines: isotype controls. Right side: quantification of positive cells over threshold (top) and mean fluorescence intensity (bottom). Mann–Whitney test; *<0.05. c Significantly differentially abundant (phospho-)proteins (FDR < 0.05) associated with B cell activation visualized by Euclidean clustering of z-scores (Supplementary Table S8.4 and S8.5). d Treatment of cell clones with R-CHOEP resulted in a lower IC50 in ZNF217WT versus ZNF217KO cells of 3.2 to 3.4 -fold. Figure shows merged data from n = 11 different ZNF217KO or ZNF217WT clones obtained from n = 3 independent WST-1 assay experiments after 48 h of increasing dilutions of R-CHOEP treatment (mean with 95% CI; Mixed effect model with Geisser–Greenhouse correction). 1x R-CHOEP is defined in Supplementary Table S4. q indicated by *<0.05; **<0.01, ***<0.001, ****<0.0001.
Fig. 5
Fig. 5. Expression of aberrant ZNF217 induced large phenotypic changes in B cell lymphoma cell lines and interfered with oncogenic signaling pathways.
ZNF217KO and ZNF217WT single cell clones were analyzed in cell-based functional assays. a Baseline growth characteristics of RC-K8 (KO: n = 28 and WT: n = 19) and L-428 (KO n = 11 and WT n = 9) were determined by longitudinal WST-1 viability assays after 6 h of serum starvation. Raw data of growth curves shows median and interquartile range of merged replicates of n ≥ 3 independent experiments. Growth curves were fitted with an exponential (Mathusian) growth model and extra sum-of-squares F test was used to compare proliferation/viability. b Bulk cells were transfected with guide RNA and Cas9 and longitudinally analyzed in n = 3 independent experiments for their relative proportion of genotypes by Sanger sequencing. Time points indicate weeks after transfection. Friedman-Test and Dunn’s post test were used, bars show mean (SD). c ZNF217KO and ZNF217WT cells were analyzed for their migratory potential in a Boyden Chamber assay after 24 h. Median and 95% CI of means of biological replicates (total n: RC-K8: WT: n = 46, KO: n = 67, L-428: WT: n = 18, KO: n = 22) of n ≥ 3 independent experiments are shown. Statistical significance was determined by Mann–Whitney-Test. d, e Determination of apoptotic/dead cell content in passaging of ZNF217KO (n = 14) versus ZNF217WT (n = 8) clones using Annexin-V- and DAPI-based flow cytometry, and cell cycle analysis (WT: n = 14, KO: n = 28). Upper panel shows representative flow cytometry density plots of ZNF217WT and ZNF217KO examples of RC-K8. Means of n ≥ 3 independent experiments were merged and error bars show SD. f Proliferation of ZNF217KO (n = 6) and ZNF217WT (n = 4) clones upon stimulation in duplicates with an agonist anti-CD40 antibody, IL-4, and IL-21. One representative experiment of three independent ones (total n: KO: n = 14) and WT: n = 16. Bars show median and interquartile range (Welch’s ANOVA test with Dunett’s T3 multiple comparisons test). gi ZNF217KO (n = 9) and ZNF217WT (n = 10) clones were treated in triplicates with anti-CD40 antibody, IL-4, and IL-21. Control cells were moved to control media after 48 h and viability, apoptosis, and cytotoxicity were measured at the indicated time points after removal. Merged data of three independent experiments, bars show median and interquartile range (Kruskal–Wallis test, Dunn’s multiple comparisons test). q indicated by *<0.05; **<0.01, ***<0.001, ****<0.0001.
Fig. 6
Fig. 6. Loss of ZNF217 led to epigenetic changes by interfering with the CoREST histone modifier complex.
a ATAC-sequencing detected an increased chromatin accessibility in ZNF217KO cells (n = 5) compared to ZNF217WT cells (n = 4). Nucleosome mapping revealed differentially accessible chromatin areas in intronic and around promoter regions of 194 genes, which were found differentially expressed in transcriptome analysis, including genes of the TNF and interleukin signaling (representative maps are shown for CASP1 and TNFRSF18, bar graph indicates relative expression on transcript level, log scale). Red squares denote promoter regions. b Functional annotation of all loci with differential ATAC peaks and of all 192 loci with different chromatin accessibility and gene upregulation determined by RNA-seq. Promoter regions were defined as ± 2500 bp to nearest TSS. c De novo motif enrichment analysis (log p-value, % of targets sequences with known motif out of number of target sequences with motif is shown versus % of background sequences with known motif out of number of background sequences with motif is shown; four top hits ranked by p-values are depicted; Supplementary Table S8). d A number of 64 genes were differentially upregulated in all three multi-omics layers (Supplementary Table S8). e Western blot analysis of ZNF217WT (RC-K8: n = 8; L-428: n = 9) and ZNF217KO (RC-K8: n = 15; L-418: n = 12). Representative blots of one out of three independent experiments and densitometric quantification of all replicates are shown. f Enrichment plot of gene expression data from RNA-sequencing demonstrating a significant enrichment of a gene signature resulting from a perturbation of RE1 Silencing Transcription Factor (REST). Visualization was performed using the tmod R package, (light) blue indicates (significant) downregulation, (light) red indicates (significant) upregulation.
Fig. 7
Fig. 7. Interaction partner of ZNF217 in lymphoma cells.
a Western blot of anti-flag immunoprecipitated protein complexes after ectopic expression of n-Flag-ZNF217 (n = 3) or the n-Flag-ZNF217H393* (n = 3) variant in ZNF217KO cells (Supplementary Fig. S4). The samples with the truncated protein variant did not show any western blot signal (top), since the antibody recognizes a c-terminal epitope. However, peptides of amino acids 1-393 were detected in the mass spectrometry analysis (bottom). b Co-immunoprecipitated proteins after anti-flag pulldown of n = 3 biological replicates in two repeated experiments, data of one experiment is shown; neg R1-R2: no-Flag ZNF217WT controls, R1-R3: n-Flag-ZNF217WT and R1-R3: n-Flag-ZNF217H393* were analyzed by mass spectrometry-based proteomics and included 2777 proteins for quantitation (filter: min 3 valid values in at least one group). LFQ intensities were used for analyses, with imputation. All variants were compared to no-Flag-tag control. Enriched proteins (FDR 20%, or log2fold change >2, -log10 p > 1.3 (0.05)) were defined as ZNF217 binders. A total of 9 binders were identified for wild type and truncated ZNF217, of which 3 known members of the CoREST complex clustered together (Euclidean distance): ZNF217, CoREST 3 and LSD1/KDM1A. Heatmap shows z score-transformed LFQ intensities. c Chromatin-Immunoprecipitation- (CHIP-) qPCR analysis of major target histone marks affecting differentially expressed genes. Target areas for PCR primers were determined from ATAC-sequencing data, qPCR was quantified using the percent input method. Graph shows mean (SD), *q < 0.05; multiple paired t-tests corrected for multiple testing (FDR) of n = 4 ZNF217WT and n = 4 ZNF217KO clones from n ≥ 3 independent experiments. MS/MS: tandem mass spectrometry. FDR indicated by *<0.05; **<0.01. d Summary: Proposed role of ZNF217 in PMBCL: Depiction of the protein complex, including LSD1, CoREST, ZNF217 and most likely HDAC2 and CtBP1, which is perturbed by mutation of ZNF217 and thereby affects H3K4 methylation and H3K27 acetylation leading to altered expression of genes involved in B cell differentiation activation. Upregulation of crucial antigens involved in T cell-interaction suggests a tolerance-induction process. Illustration was created with BioRender.com.

References

    1. Pasqualucci L, Trifonov V, Fabbri G, Ma J, Rossi D, Chiarenza A, et al. Analysis of the coding genome of diffuse large B-cell lymphoma. Nat Genet. 2011;43:830–7. doi: 10.1038/ng.892. - DOI - PMC - PubMed
    1. Quivoron C, Couronné L, Della Valle V, Lopez CK, Plo I, Wagner-Ballon O, et al. TET2 inactivation results in pleiotropic hematopoietic abnormalities in mouse and is a recurrent event during human lymphomagenesis. Cancer Cell. 2011;20:25–38. doi: 10.1016/j.ccr.2011.06.003. - DOI - PubMed
    1. Palomero T, Couronné L, Khiabanian H, Kim M-Y, Ambesi-Impiombato A, Perez-Garcia A, et al. Recurrent mutations in epigenetic regulators, RHOA and FYN kinase in peripheral T cell lymphomas. Nat Genet. 2014;46:166–70. doi: 10.1038/ng.2873. - DOI - PMC - PubMed
    1. Béguelin W, Popovic R, Teater M, Jiang Y, Bunting KL, Rosen M, et al. EZH2 is required for germinal center formation and somatic EZH2 mutations promote lymphoid transformation. Cancer Cell. 2013;23:677–92. doi: 10.1016/j.ccr.2013.04.011. - DOI - PMC - PubMed
    1. Meyer SN, Scuoppo C, Vlasevska S, Bal E, Holmes AB, Holloman M, et al. Unique and shared epigenetic programs of the CREBBP and EP300 acetyltransferases in germinal center B cells reveal targetable dependencies in lymphoma. Immunity. 2019;51:535–47.e9. doi: 10.1016/j.immuni.2019.08.006. - DOI - PMC - PubMed

Publication types