. 2023 Sep;621(7978):381-388.
doi: 10.1038/s41586-023-06459-w. Epub 2023 Aug 30.

An orexigenic subnetwork within the human hippocampus

Affiliations

An orexigenic subnetwork within the human hippocampus

Daniel A N Barbosa et al. Nature. 2023 Sep.

Abstract

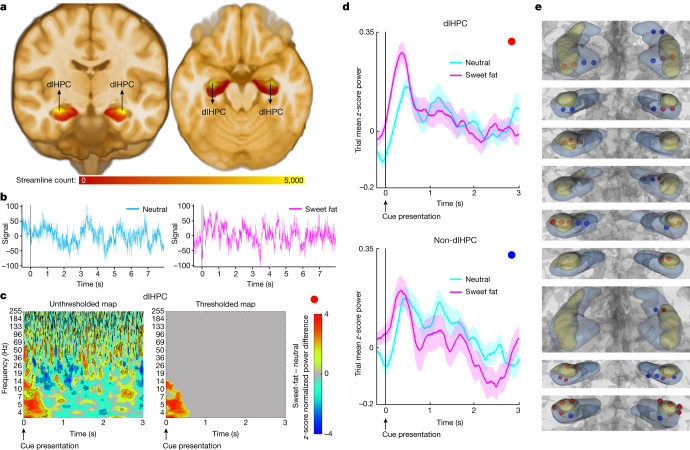
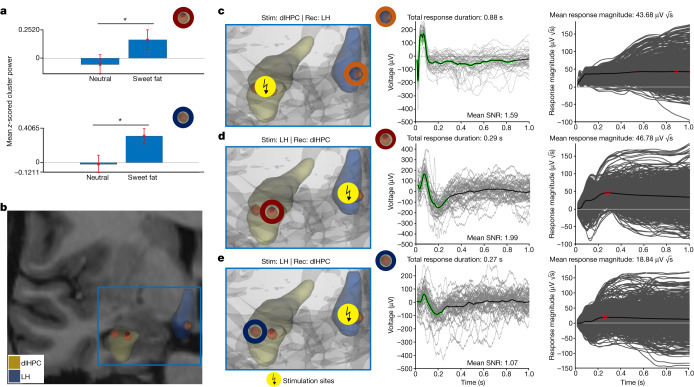
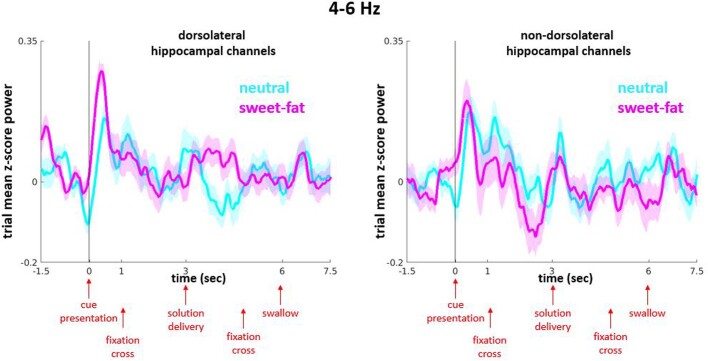
Only recently have more specific circuit-probing techniques become available to inform previous reports implicating the rodent hippocampus in orexigenic appetitive processing1-4. This function has been reported to be mediated at least in part by lateral hypothalamic inputs, including those involving orexigenic lateral hypothalamic neuropeptides, such as melanin-concentrating hormone5,6. This circuit, however, remains elusive in humans. Here we combine tractography, intracranial electrophysiology, cortico-subcortical evoked potentials, and brain-clearing 3D histology to identify an orexigenic circuit involving the lateral hypothalamus and converging in a hippocampal subregion. We found that low-frequency power is modulated by sweet-fat food cues, and this modulation was specific to the dorsolateral hippocampus. Structural and functional analyses of this circuit in a human cohort exhibiting dysregulated eating behaviour revealed connectivity that was inversely related to body mass index. Collectively, this multimodal approach describes an orexigenic subnetwork within the human hippocampus implicated in obesity and related eating disorders.


Conflict of interest statement

C.H.H. receives consulting and speaking honoraria from Boston Scientific and Insightec. C.H.H, D.A.N.B., S.G. and Y.H. have patents owned by Stanford University related to sensing and brain stimulation for the treatment of neuropsychiatric disorders: USPTO serial number: 63/170,404 and 63/220,432; international publication number: WO 2022/212891 A1 (international publication date: 6 October 2022). C.H.H., D.A.N.B. and J.A.M. have patents related to using tractography for circuit-based brain stimulation: USPTO serial number: 63/210,472; international publication number: WO 2022/266000 (international publication date: 22 December 2022). P.R. declares that the opinions and assertions contained in this manuscript do not necessarily reflect the official policy or position of the Uniformed Services University, the Department of Defense or the Henry M. Jackson Foundation for the Advancement of Military medicine. B.D.H. is on the scientific advisory boards of Osmind and Journey Clinical and is a consultant for Clairvoyant Therapeutics and Vine Ventures. The other authors declare no competing interests.

Figures

Fig. 1
Fig. 1. dlHPC subregion involvement in food-related appetitive processing.
a, Tractography analysis of high-resolution, normative data from 178 participants from the HCP showing that tractography-defined LH–hippocampal area interconnections (that is, streamlines) converge in the dlHPC (yellow). b, Example traces of electrophysiological time-domain recordings from the dlHPC in one individual during a taste-neutral (left, cyan) and a sweet-fat (right, magenta) trial. The time interval displayed includes the pre-cue period (−0.5 to 0 s), cue presentation (0–1 s), fixation cross (1–3 s), solution delivery (3–5 s), fixation cross (5–6 s) and a portion of the remaining duration of solution receipt/consummatory phase (6–7.5 s). The detailed task paradigm is described in Supplementary Fig. 1. c, z-score-normalized difference spectrograms (sweet-fat minus taste-neutral solution) in the dlHPC. The colour bar indicates mean z-score power difference (using pooled channels as observations) between the two conditions compared with a null distribution. The outlined clusters (left) reflect significant contiguous time–frequency voxels (P  < 0.05, two-sided paired nonparametric cluster-based permutation testing, 1,000 permutations, n = 34 channels) before correction for multiple comparisons. The thresholded map (right) displays significant time–frequency clusters after correction for multiple comparisons using cluster size (Methods). d, 4–6 Hz mean z-score power time traces during cue (0–1 s) and after cue anticipation (1–3 s) of sweet-fat (magenta) and taste-neutral (cyan) solutions in the dlHPC (top) and non-dlHPC (bottom) hippocampal sites. 0 s and 1 s reflect the cue and fixation cross image presentation times, respectively. e, Hippocampal coverage per participant (n = 9). The red contacts indicate the contacts in direct contact with the dlHPC (yellow subregion). 3D volumes were rendered using DSI Studio (v.2022; publicly available at https://dsi-studio.labsolver.org/). Source Data
Fig. 2
Fig. 2. Dissecting the human LH–dlHPC appetitive processing circuit using single-pulse electrical stimulation.
a, Increased mean z-score low-frequency cluster power in the dlHPC (two channels; top and bottom; outlined by red and dark blue circles) during anticipation of sweet-fat compared with taste-neutral items from a participant with electrodes implanted in both the dlHPC and LH area (P = 0.037 (top) and P = 0.009 (bottom), unpaired one-sided permutation testing, 1,000 permutations). Data are mean ± s.e.m. across trials in each channel (n = 33 trials per condition (top), and n = 33 and n = 30 trials for the taste-neutral and sweet-fat conditions, respectively (bottom)). b, The anatomical location of the dlHPC (yellow volume) and LH-area (blue volume) electrodes used in the trials of single-pulse electrical stimulation. We parameterized single trials and quantified response durations and magnitudes between the LH and dlHPC. c, Electrical stimulation (stim) was delivered through the electrode pair (the same electrodes as in a) in the dlHPC and elicited evoked potentials in the recording (rec) LH electrode outlined in orange. The extracted shapes of the evoked potentials (middle; black line with green highlighting) revealed initially sharp responses characterized by a mean magnitude of 43.68 μV s. SNR, signal-to-noise ratio. d,e, The LH area also received electrical stimulation that elicited evoked potentials in the two recording dlHPC sweet-fat-responsive electrodes outlined in red and dark blue circles (the same electrodes as in a). d, The extracted shapes of the evoked potentials revealed responses with a mean response magnitude of 46.78 μV s in the dlHPC electrode (outlined in red). e, The other dlHPC electrode, probably due to its location, had a lower mean response magnitude. *P < 0.05. 3D volumes were rendered using DSI Studio (v.2022; publicly available at https://dsi-studio.labsolver.org/). Source Data
Fig. 3
Fig. 3. Dissecting the human LH–dlHPC appetitive processing circuit using 3D histology.
a, Display of a post-mortem human sample (left) of the hippocampus and dlHPC section (middle) that was selected for the iDISCO brain-clearing (right) procedure. b, The iDISCO-cleared section (green) was overlaid to the group average dlHPC (yellow), defined on the basis of its higher number of LH streamlines. c, Staining for MCH+ and Alexa Fluor 647 is shown in red and autofluorescence in green within the dlHPC hotspot (high streamline probability with the LH area). The image was acquired using light-sheet microscopy (UltraMicroscope II). Scale bar, 100 μm. 3D visualization is shown in  Supplementary Video 1. This 3D histology experiment could not be repeated independently because only a single sample of the human dlHPC was available for the 3D histology experiments at our institution. We therefore approached these data as a unique opportunity for a proof of principle only, testing the feasibility of directly visualizing MCH+ LH projections with 3D histology (of which testing was lacking in humans).
Fig. 4
Fig. 4. The dlHPC–LH circuit is associated with the obese state involving dysregulated eating behaviour in humans.
a, Regions of interest co-registered to native space of an exemplary individual in the binge-eating cohort: dlHPC (yellow), non-dlHPC (red) and LH (blue; adapted from the CIT168 Subcortical In Vivo Probabilistic Atlas). b, Analysis of the relevance of hippocampal subregions in the binge-eating cohort. Significantly higher normalized streamline counts were observed between the LH and left (L) dlHPC (t = −4.585, P = 0.00006, two-sided t-test) and right (R) dlHPC (t = −3.609, P = 0.00097, two-sided t-test) compared with the non-dlHPC in the overall cohort. n = 34 participants, with 2 subregions analysed in each hemisphere. For the remaining analyses, the overall cohort was divided into two groups: lean (n = 17) and overweight/obese (n = 17). c, rsFC between the dlHPC and LH was decreased in the overweight/obese group compared with the lean group (t = 2.51, P = 0.018, two-sided t-test). d, Structural CI between the left dlHPC and LH was significantly decreased (t = 2.13, P = 0.042, two-sided t-test) in the overweight/obese group compared with the lean group. No significant differences (t = 1.07, P = 0.295, two-sided t-test) in the structural CI between the right dlHPC and LH were found (see Supplementary Fig. 4 for individual participant datapoints for bd). NS, not significant. *P < 0.05; ***P < 0.001. For the box plots in b and d, the centre line shows the median, the box limits show the 25th to 75th percentiles and the whiskers show the minimum to maximum values. Source Data
Extended Data Fig. 1
Extended Data Fig. 1. Relationship between the low frequency cluster power and trial number in the task.
Trial number used as proxy measure for sweet-fat solution expectation. (A) Cluster power plotted as a function of trial number in the task (top: individual trial power, bottom: smoothed data by averaging 3 consecutive trial values). (B) Cluster power in the first versus last 20 trials of the task for the neutral (top) and sweet-fat (bottom) conditions. Note that the last 20 trials had significantly higher cluster power compared to the first 20 trials for the sweet-fat (p = 0.014, one-sided, unpaired permutation testing) but not for the taste-neutral condition (p = 0.198). NS. = non-significant, * = p < .05, error bars represent standard error of the mean across pooled trials.
Extended Data Fig. 2
Extended Data Fig. 2. 4–6 Hz power time course throughout the entirety of the trial.
4–6 Hz mean z-score power time traces in the dlHPC (left traces) and non-dlHPC (right traces) hippocampal sites, respectively. The time interval displayed includes the pre-cue period (−1.5 to 0 s), cue presentation (0-1 s), fixation cross (1–3 s), solution delivery (3–5 s), fixation cross (5-6 s), and a portion of the remaining duration of solution receipt/consummatory phase (6–7.5 s). Note increased 4–6 Hz power for sweet-fat solution is specific to the dorsolateral contacts during both cue presentation and solution delivery. Source Data
Extended Data Fig. 3
Extended Data Fig. 3. dlHPC low frequency cluster power involvement in appetitive food processing is not observed in control brain areas.
(A) Z-score normalized difference spectrograms between the sweet-fat minus the taste-neutral items in the sweet-fat incentive paradigm. Note, this is a repeat of Fig. 1c included here as a reference. (B, left, C) Z-score normalized difference spectrograms between the sweet-fat minus the taste-neutral items in the sweet-fat incentive paradigm in occipital (B) and middle temporal (C) control areas. (B, right) Spectrograms for taste-neutral (top) and sweet-fat (bottom) items, displayed separately for each item.
Extended Data Fig. 4
Extended Data Fig. 4. Non-dorsolateral hippocampal spectral content during food anticipation.
(A) Z-score normalized difference spectrograms (sweet-fat – taste-neutral item) in the non-dorsolateral hippocampus (non-dlHPC) before (left spectrogram) and after (right spectrogram) correction for multiple comparisons. Colour bar indicates mean z-score power difference (using pooled channels as observations) between the two conditions compared to a null distribution. Outlined clusters (left spectrogram) reflect significant contiguous time-frequency voxels (p < 0.05, two-sided cluster-based permutation testing, 1000 permutations) before correction for multiple comparisons. Thresholded map displays significant time-frequency cluster (~ 7–12 Hz) after correction for multiple comparisons using cluster size (see methods). Note the absence of a cluster centred in ~4–6 Hz in the thresholded map. (B) 7–12 Hz mean z-score power time traces in the dlHPC (left traces) and non-dlHPC (right traces) hippocampal sites, respectively. 0-time indicates cue presentation. Note that while 7–12 Hz power is recruited in both subregions, condition specificity to water at this frequency range is only observed in non-dlHPC.
Extended Data Fig. 5
Extended Data Fig. 5. 7–12 Hz power time course throughout the entirety of the trial.
7–12 Hz mean z-score power time traces in the dlHPC (left traces) and non-dlHPC (right traces) hippocampal sites, respectively. The time interval displayed includes the pre-cue period (−1.5 to 0 s), cue presentation (0-1 s), fixation cross (1–3 s), solution delivery (3–5 s), fixation cross (5-6 s), and a portion of the remaining duration of solution receipt/consummatory phase (6–7.5 s). Note that increased 7–12 Hz power for water solution is specific to non-dorsolateral contacts during the post-cue fixation period.
Extended Data Fig. 6
Extended Data Fig. 6. Cluster-based permutation testing during a period of anticipation of reward variables from two tasks with different contrasts in the dlHPC.
(A) z-score normalized difference spectrograms between the sweet-fat minus the taste-neutral items in the sweet-fat incentive paradigm. Note, this is a repeat of Fig. 1c included here as a reference. (B-C) z-score normalized difference spectrograms in the Monetary Incentive Delay task (MID; see Fig. S1B), which provided two different contrasts: anticipation of monetary loss minus anticipation of 0-loss (B) and anticipation of monetary gain minus anticipation of 0-gain (C). Normalization for spectral power for the MID task was performed as described for the sweet-fat incentive paradigm. Note that the low frequency power cluster is specific to the sweet-fat cue and is not elicited by other visual cues associated with reward anticipation in the non-feeding domain (loss vs. 0-loss contrast and gain vs. 0-gain contrast).
Extended Data Fig. 7
Extended Data Fig. 7. Power of 4–6 Hz during reward anticipation and receipt periods in two different tasks with different contrasts in the dlHPC hippocampal area.
(A) 4–6 Hz power time traces for sweet-fat and taste-neutral items in the sweet-fat incentive paradigm. Note, this is a repeat of Extended Data Fig. 2, left included here as a reference. (B) 4–6 Hz power time traces for monetary-gain and monetary-loss trials in the MID paradigm. (C) 4–6 Hz power time traces for the gain and loss cues contrasted with their corresponding 0-gain (magenta) and 0-loss cues (cyan), respectively. The time interval displayed for the MID task includes the pre-cue period (−1.5 to 0 s), cue presentation (0–2 s), fixation cross (2–4 s), button-press target (~0.350 s within a 4–6 s interval), and a portion of feedback delivery (6–7.5 s). Note that increased 4–6 Hz power is specific to the sweet-fat vs. taste-neutral contrast.
Extended Data Fig. 8
Extended Data Fig. 8. Cluster-based permutation testing during a period of anticipation of reward variables from two tasks with different contrasts in the non-dorsolateral hippocampal area.
(A) z-score normalized difference spectrograms between the sweet-fat minus the taste-neutral items in the sweet-fat incentive paradigm. Note, this is a repeat of Extended Data Fig. 4a included here as a reference. (B-C) z-score normalized difference spectrograms in the Monetary Incentive Delay task (MID; see Fig. S1B), which provided two different contrasts: anticipation of monetary loss minus anticipation of 0-loss (B) and anticipation of monetary gain minus anticipation of 0-gain (C). Note that the two tasks recruit different spectral profiles in the non-dlHPC, which also differ from the task induced spectral profiles in the dlHPC (a double dissociation).
Extended Data Fig. 9
Manual localization of the post-mortem hippocampal sample in a coronal slice of the MNI 09c brain template.
Extended Data Fig. 10
Extended Data Fig. 10. Connectivity of LH with control regions does not differ between overweight/obese and lean groups.
(A) No significant differences in LH-non-dlHPC rsFC, LH-amygdala rsFC, LH-whole-Hippocampus or LH-motor cortex rsFC were found in overweight/obese compared to lean group (t-test, two-sided, unadjusted). (B) No significant differences in LH-non-dlHPC and LH-whole-Hippocampus structural CI were found in overweight/obese compared to lean group (t-test, two-sided, uncorrected). NS. = non-significant. Source Data

References

    1. Azevedo EP, et al. A role of Drd2 hippocampal neurons in context-dependent food intake. Neuron. 2019;102:873–886. doi: 10.1016/j.neuron.2019.03.011. - DOI - PubMed
    1. Herzog LE, et al. Interaction of taste and place coding in the hippocampus. J. Neurosci. 2019;39:3057–3069. doi: 10.1523/JNEUROSCI.2478-18.2019. - DOI - PMC - PubMed
    1. Davidson TL, Jarrard LE. A role for hippocampus in the utilization of hunger signals. Behav. Neural Biol. 1993;59:167–171. doi: 10.1016/0163-1047(93)90925-8. - DOI - PubMed
    1. Davidson TL, Kanoski SE, Schier LA, Clegg DJ, Benoit SC. A potential role for the hippocampus in energy intake and body weight regulation. Curr. Opin. Pharmacol. 2007;7:613–616. doi: 10.1016/j.coph.2007.10.008. - DOI - PMC - PubMed
    1. Noble EE, et al. Hypothalamus–hippocampus circuitry regulates impulsivity via melanin-concentrating hormone. Nat. Commun. 2019;10:4923. doi: 10.1038/s41467-019-12895-y. - DOI - PMC - PubMed

Publication types