. 2023 Sep;621(7978):389-395.
doi: 10.1038/s41586-023-06466-x. Epub 2023 Aug 30.

Gut microbial carbohydrate metabolism contributes to insulin resistance

Affiliations

Gut microbial carbohydrate metabolism contributes to insulin resistance

Tadashi Takeuchi et al. Nature. 2023 Sep.

Abstract

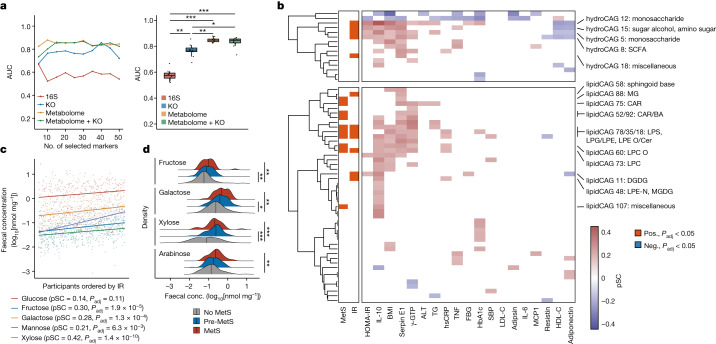
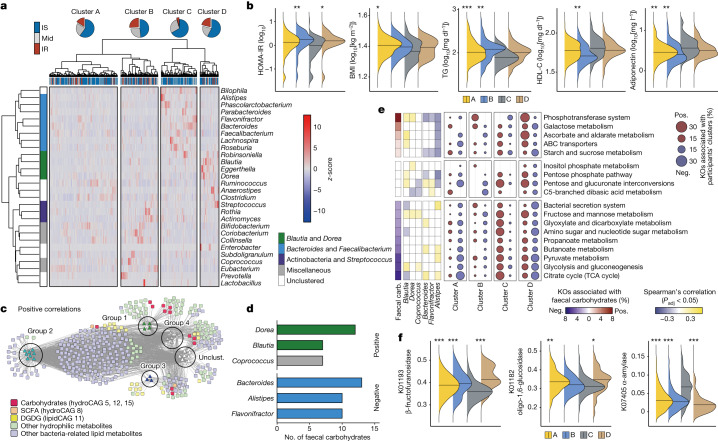
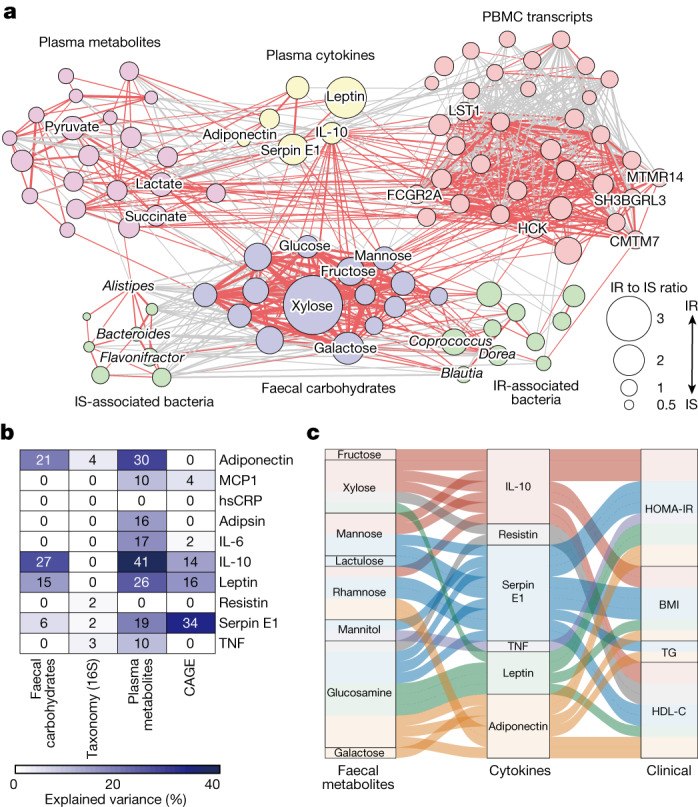
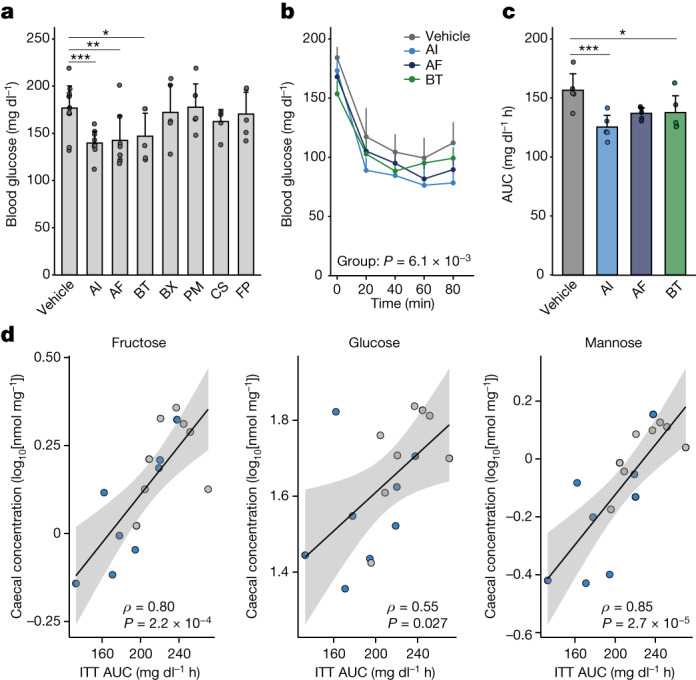
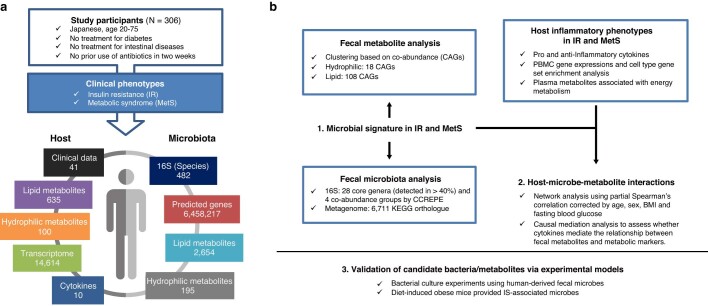
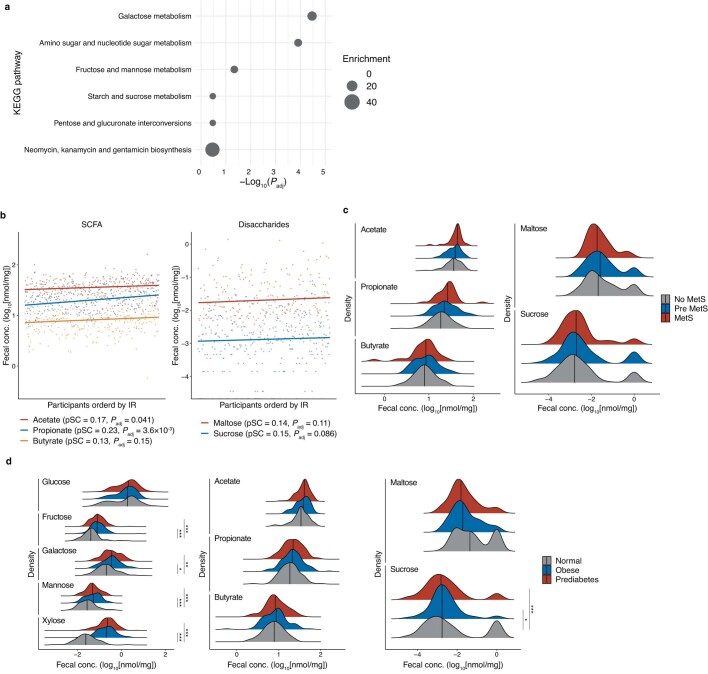
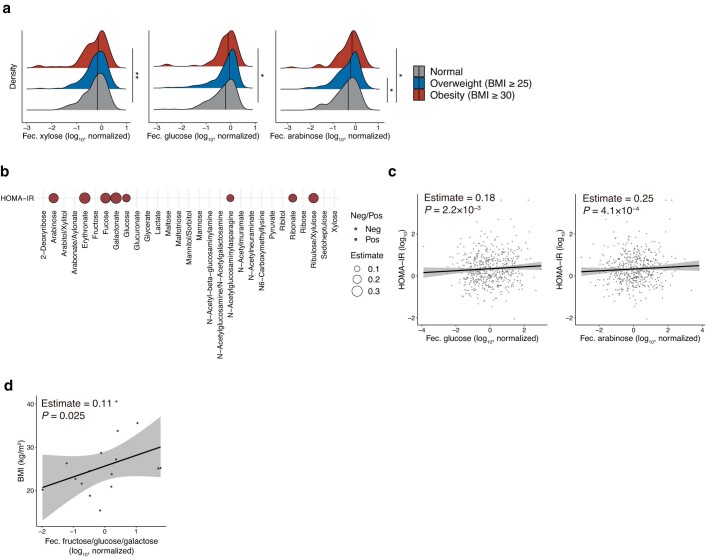
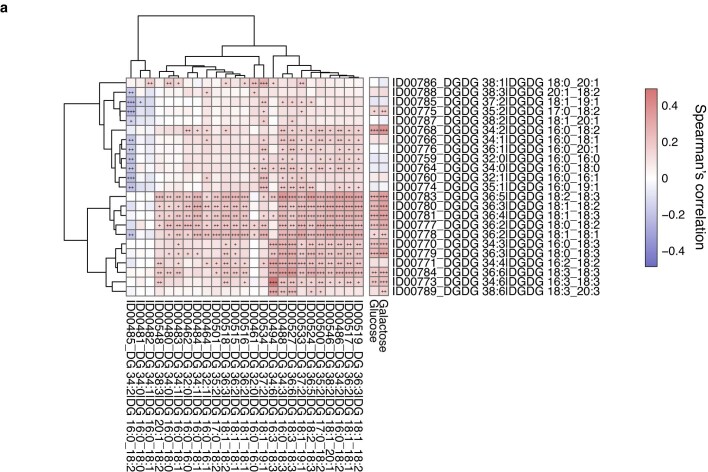
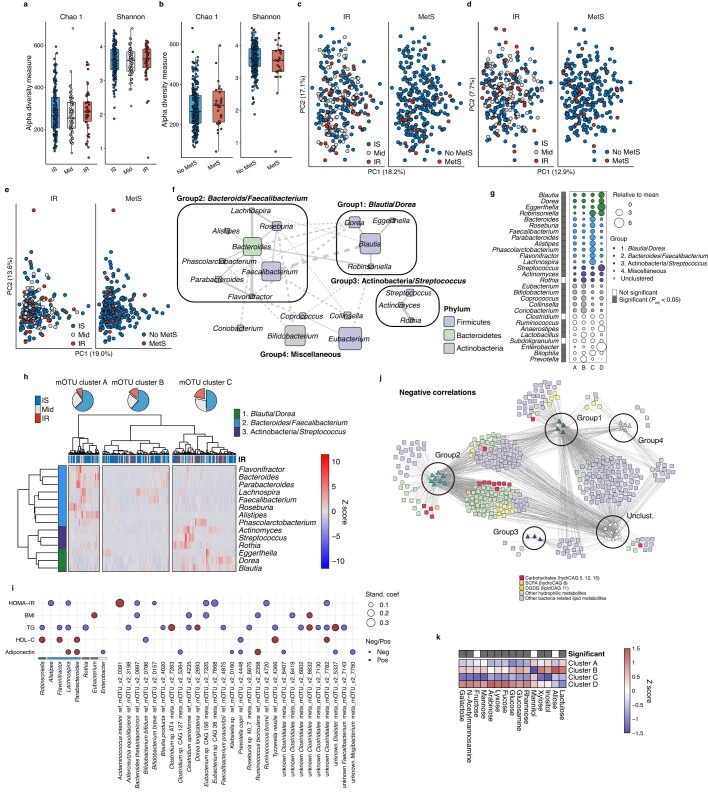
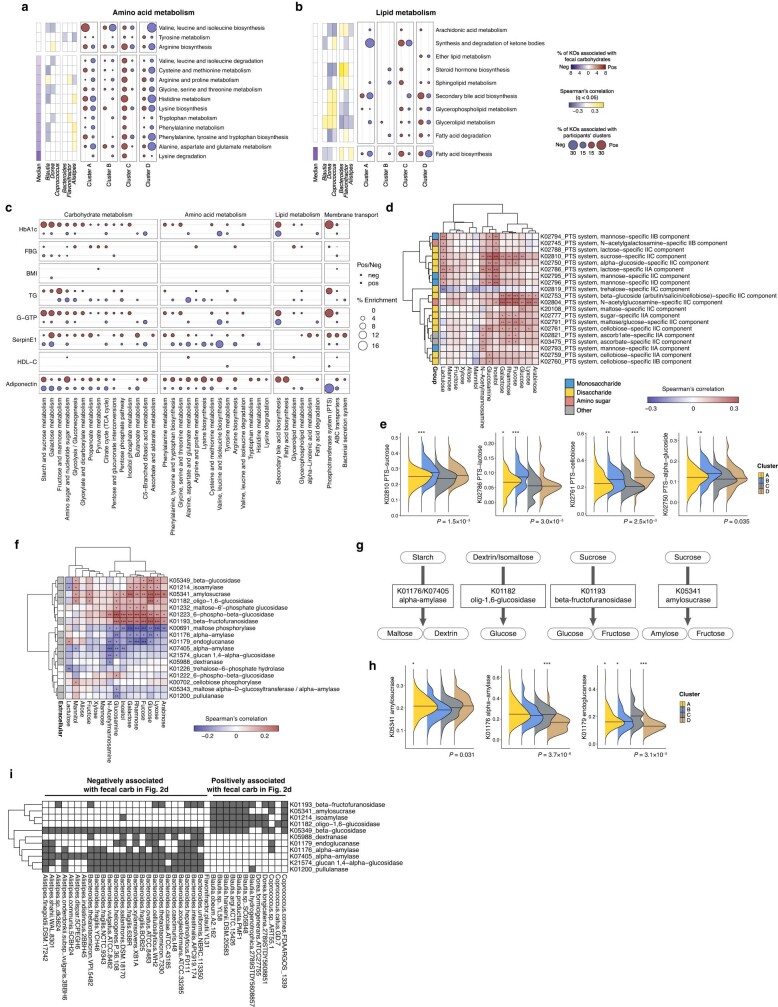
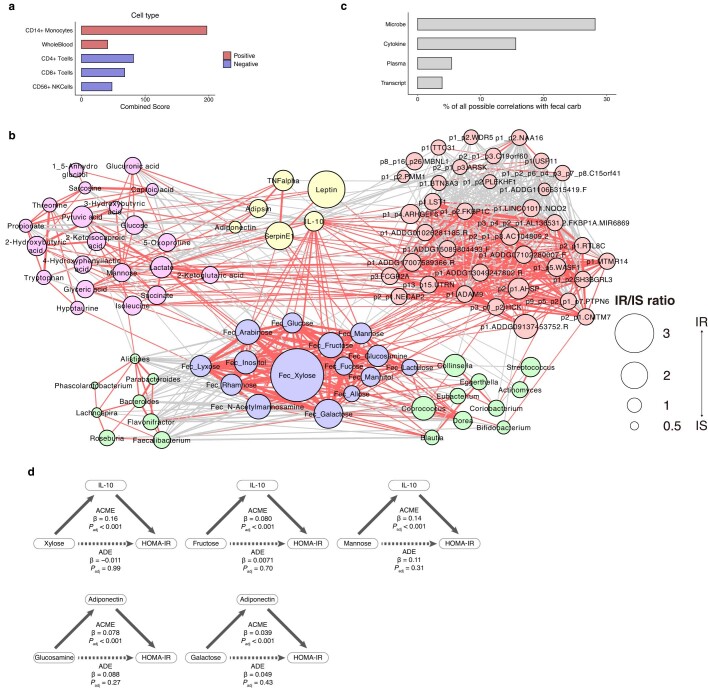
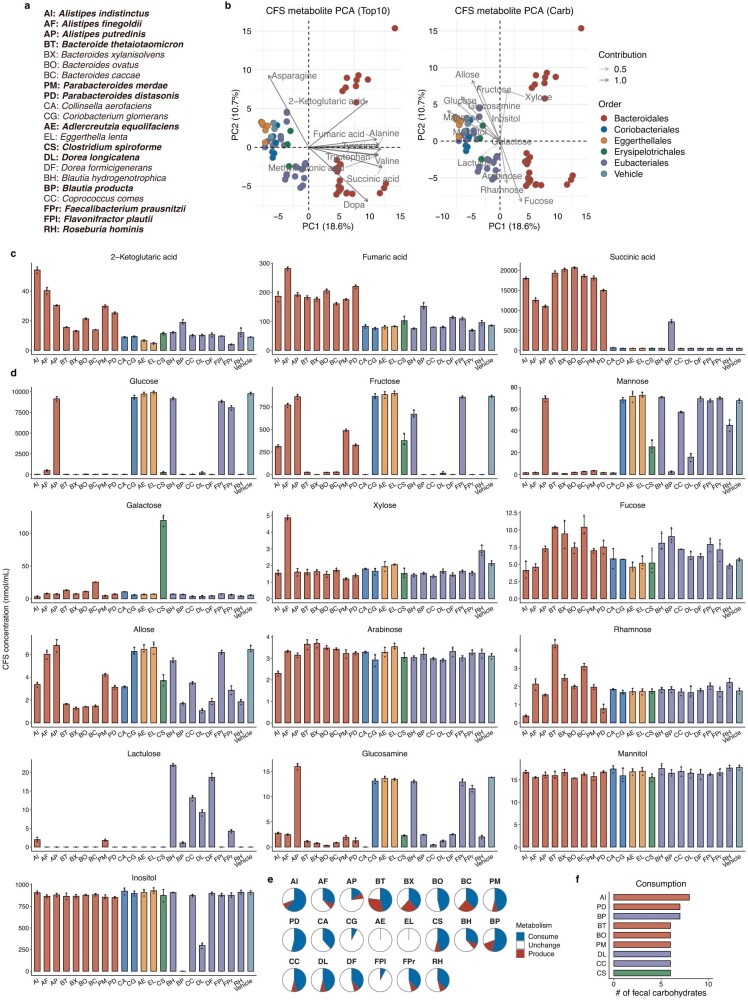
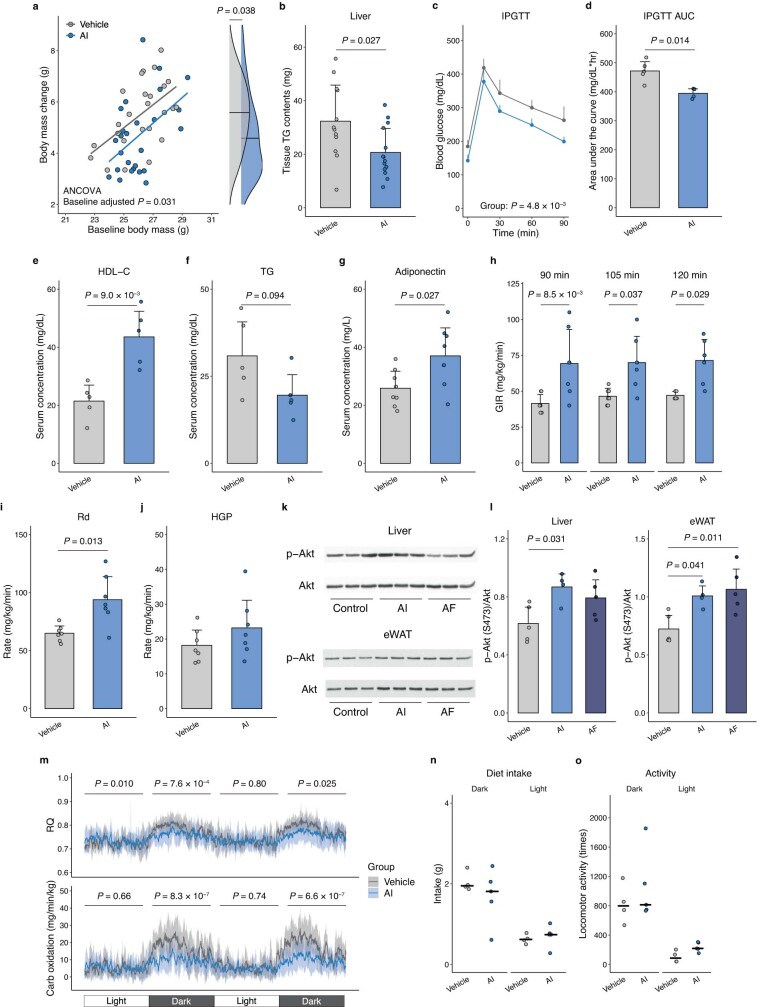
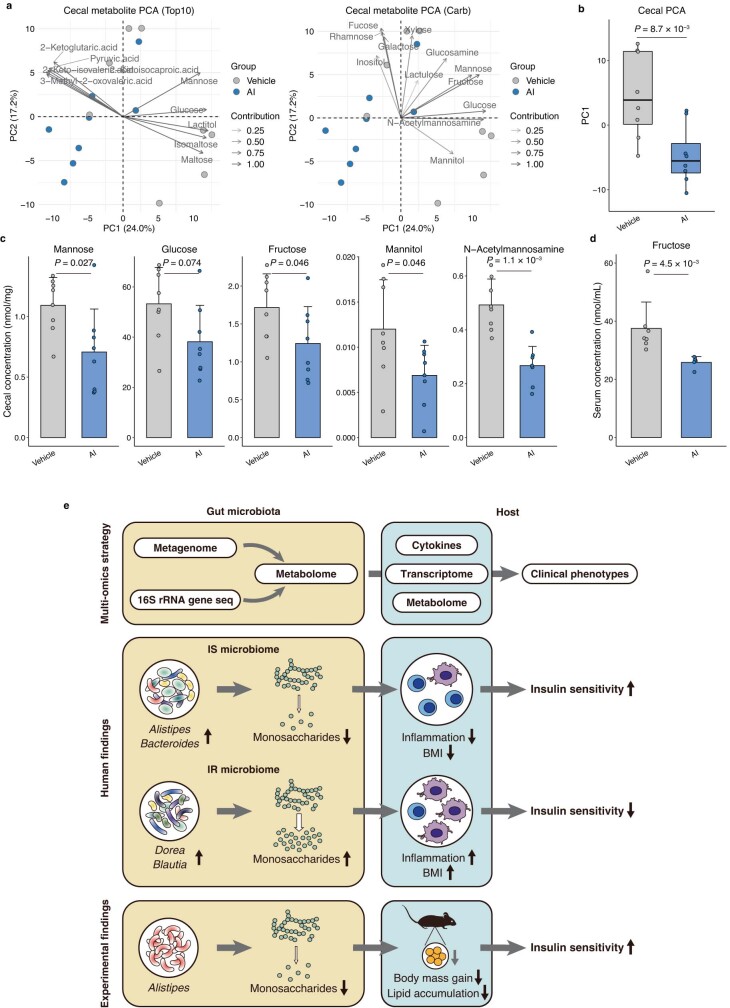
Insulin resistance is the primary pathophysiology underlying metabolic syndrome and type 2 diabetes1,2. Previous metagenomic studies have described the characteristics of gut microbiota and their roles in metabolizing major nutrients in insulin resistance3-9. In particular, carbohydrate metabolism of commensals has been proposed to contribute up to 10% of the host's overall energy extraction10, thereby playing a role in the pathogenesis of obesity and prediabetes3,4,6. Nevertheless, the underlying mechanism remains unclear. Here we investigate this relationship using a comprehensive multi-omics strategy in humans. We combine unbiased faecal metabolomics with metagenomics, host metabolomics and transcriptomics data to profile the involvement of the microbiome in insulin resistance. These data reveal that faecal carbohydrates, particularly host-accessible monosaccharides, are increased in individuals with insulin resistance and are associated with microbial carbohydrate metabolisms and host inflammatory cytokines. We identify gut bacteria associated with insulin resistance and insulin sensitivity that show a distinct pattern of carbohydrate metabolism, and demonstrate that insulin-sensitivity-associated bacteria ameliorate host phenotypes of insulin resistance in a mouse model. Our study, which provides a comprehensive view of the host-microorganism relationships in insulin resistance, reveals the impact of carbohydrate metabolism by microbiota, suggesting a potential therapeutic target for ameliorating insulin resistance.


Conflict of interest statement

T.T., Y.N., W.S. and H.O. are listed as the inventors on a patent regarding the metabolic effects of gut bacteria identified by a human cohort. The other authors declare no competing interests.

Figures

Fig. 1
Fig. 1. Faecal carbohydrate metabolites are distinctly altered in IR.
a, Left, the AUC of random forest classifiers was used to predict IR based on genus-level 16S (n = 282), metagenome at the KEGG orthologue (KO) level (n = 266), faecal metabolome and metagenome (KEGG orthologue) + faecal metabolome (n = 266) data. The number of featured markers selected from the datasets increases along the x axis. Right, the box plots show the AUC obtained by selected features. Each dot represents an AUC value of a random-forest classifier using a given number of selected features as predictor variables. b, CAGs of faecal hydrophilic metabolites (hydroCAG, top) and lipid metabolites (lipidCAG, bottom), and clinical phenotypes and markers (n = 282). The two-column heat map on the left represents the associations with the main clinical phenotypes (IR and MetS) analysed using rank-based linear regression, whereas the main heat map shows the partial Spearman’s correlations (pSC) adjusted by age and sex with representative metabolic markers. Only the CAGs with adjusted P (Padj) < 0.05 are coloured. The category names for CAGs were determined on the basis of the most abundant metabolites in the CAGs. Further details are provided in Supplementary Tables 3–8. FBG, fasting blood glucose; neg., negative; pos., positive. The lipid abbreviations are defined in Supplementary Table 27. c, pSC between HOMA-IR and faecal levels of monosaccharides. The coefficients (pSC) and Padj values are described (n = 282). d, Faecal levels of monosaccharides in MetS (n = 306). For a, the box plots indicate the median (centre line), upper and lower quartiles (box limits), and upper and lower extremes except for outliers (whiskers). conc., concentration. For c, the density plots indicate median and distribution. For a and d, statistical analysis was performed using Kruskal–Wallis tests followed by Dunn’s test (a) and rank-based linear regression adjusted by age and sex (d); *P < 0.05, **P < 0.01, ***P < 0.001. See the Source Data (a) and Supplementary Table 5 (d) for exact P values. Source Data
Fig. 2
Fig. 2. IR-associated faecal metabolites are associated with altered gut microbiota and microbial genetic functions.
a, Co-abundance clusters of bacteria at the genus level and their abundance (n = 282). The participants were classified into four clusters, A to D, according to their taxonomic profiles. The proportion of individuals with IR are shown. Mid, intermediate. b, HOMA-IR, BMI, triglycerides (TG) and HDL-C levels among the participant clusters. c, Bacteria–metabolite networks of co-abundance microbial groups from a and faecal metabolites (n = 282). All faecal hydrophilic and bacteria-related lipid metabolites were included. Only interactions with positive and significant (Padj < 0.05) Spearman’s correlations are shown. The metabolites in CAGs relating to carbohydrates in Fig. 1b are highlighted in red. Unclust., unclustered. d, The number of significant positive and negative correlations between genera and faecal carbohydrates. The top five genera in each correlation are shown. e, KEGG pathways relating to carbohydrate metabolism and membrane transport, faecal carbohydrates, the top three genera positively or negatively correlated with faecal carbohydrates, and the participant clusters. KEGG orthologues significantly (Padj < 0.05) associated with the metabolite (left) and taxonomic abundance (right) are summarized as the percentage enrichment among KEGG pathways. The median percentage of 15 faecal carbohydrates (carb.) is shown in colour (blue to red) on the left, whereas the percentage enrichment is shown as the disk size on the right; the Spearman’s correlations between pathway-level abundance and six genera are shown in colour (blue to yellow) in the middle (n = 266). f, The abundance of representative KEGG orthologues involved in glycosidase among the participant clusters (n = 266). The abundance was transformed by arcsine square root transformation. The density plots in b and f indicate the median and distribution. Statistical analysis was performed using rank-based linear regression adjusted by age and sex (b; Supplementary Table 10), two-sided Wilcoxon rank-sum tests with multiple-testing correction (e; Supplementary Table 16), and Kruskal–Wallis tests with Dunn’s test (f; Supplementary Table 18). *P < 0.05, **P < 0.01, ***P < 0.001 in comparison to cluster C (with the lowest proportion of IR) (b and f).
Fig. 3
Fig. 3. Faecal carbohydrate metabolites are associated with cytokine levels in IR.
a, The networks between faecal carbohydrate metabolites (purple), faecal bacteria (green), plasma hydrophilic metabolites (pink), cytokines (yellow) and PBMC genes (red) constructed on the basis of the IS, intermediate (that is, HOMA-IR >1.6 and <2.5) and IR samples available for all omics information (n = 46, 70 and 275). Host-derived markers significantly associated with IR (Supplementary Tables 19–21), 15 faecal carbohydrates and 20 genera identified in Fig. 1b and Extended Data Fig. 5f, respectively, were included in the analysis. To construct the omics network, pairwise pSC adjusted by age, sex, BMI and FBG were calculated, and the interactions with Padj < 0.05 are shown. The line widths show the absolute values of coefficients, and the red and grey lines show positive and negative correlations, respectively. The disk sizes show the ratio of median abundance in IR over IS (n = 46 and 157). Detailed information with complete annotations is shown in Extended Data Fig. 7c and Supplementary Table 22. b, The explained variance of ten plasma cytokines predicted by each omics dataset using random-forest classifiers. c, An alluvial plot showing the plasma cytokines significantly mediated the in silico effects of faecal carbohydrates on host metabolic markers. The lines show the mediation effects and the colours represent the associations mediated by individual cytokines. Details are provided in Supplementary Table 23.
Fig. 4
Fig. 4. IS-associated bacteria ameliorate IR in experimental models.
a, Postprandial blood glucose in mice fed a high-fat diet at 4 weeks after the initiation of bacterial administration. The abbreviations are defined in Extended Data Fig. 8a. n = 12 (vehicle), n = 10 (A. indistinctus and A. finegoldii) and n = 5 (other groups) mice. b,c, Blood glucose levels during the insulin tolerance test (b) and the AUC (c) (n = 5 per group). d, The correlations between the AUC of the insulin tolerance test and caecal levels of fructose, glucose and mannose in the A. indistinctus (sky blue) or vehicle (grey) groups. Spearman’s coefficients (ρ) and P values are shown. The lines and grey zones show the fitted linear regression lines with 95% confidence intervals. ITT, insulin tolerance test. Representative data of two (a and d) or three (b and c) independent experiments. For ac, data are mean ± s.d. Statistical analysis was performed using Kruskal–Wallis tests with Dunn’s test (a and c) and two-way repeated-measures analysis of variance (ANOVA) (b). *P < 0.05, **P < 0.01, ***P < 0.001 (a and c). Exact P values for a and c are provided in the Source Data. Source Data
Extended Data Fig. 1
Extended Data Fig. 1. Overview of multi-omics analysis and data.
a, Individuals without a prior diagnosis of diabetes, diabetic medications, or intestinal diseases were included (n = 306). Insulin resistance (IR) and metabolic syndrome (MetS) were the main clinical phenotypes. To evaluate the host-microbe relationship, we collected 1) host factors: clinical, plasma metabolome, peripheral blood mononuclear cells (PBMC) transcriptome, and cytokine data, and 2) microbial factors: 16S rRNA pyrosequencing, shotgun metagenome, and faecal metabolome. The numbers of elements after quality filtering are shown for each data set. b, The multi-omics analysis workflow. To identify the microbes that affect metabolic phenotypes, we first analysed the phenotype-associated metabolomic signatures by binning metabolites into co-abundance groups (CAGs). Microbial signatures were determined using the 16S and metagenomic datasets, and their associations with metabolites were analysed. To gain insight into the host-microbe relationship, the associations among faecal metabolites/microbes and host plasma metabolites, cytokines, and PBMC genes were analysed. We also assessed the mediation effects of plasma cytokines on the relationships between faecal metabolites and metabolic markers. Finally, to validate the effects of candidate metabolites/microbes on metabolic phenotypes, we performed bacterial culture and animal experiments. The associations between clinical phenotypes and omics markers were adjusted by age and sex wherever appropriate.
Extended Data Fig. 2
Extended Data Fig. 2. Faecal carbohydrate metabolites are increased in IR and MetS.
a, The KEGG pathway enrichment analysis of the metabolites in hydrophilic CAGs 5, 8, 12, 15, and 18, which were associated with IR in Fig. 1b. The size of disks shows the enrichment (i.e., the ratio of observed numbers and expected numbers of metabolites in each KEGG pathway). The pathways with raw P values < 0.05 are shown in the figure. b, Partial correlations between HOMA-IR and faecal levels of short-chain fatty acids (SCFA) such as acetate, propionate, and butyrate (left panel), and disaccharides such as maltose and sucrose (right panel). The coefficients (pSC) and P values of partial Spearman’s correlations adjusted by age and sex are described (n = 282). c, Faecal levels of SCFA (left panel) and disaccharides (right panel) were compared between no MetS, pre MetS, and MetS (n = 306). d, Faecal levels of monosaccharides (left panel), SCFA (middle panel), and disaccharides (right panel) were compared between healthy, obese, and prediabetes (n = 306). Density plots indicate median and distribution. *Padj < 0.05, **Padj < 0.01, ***Padj < 0.001; hypergeometric test with multiple test corrections (a) and rank-based linear regression adjusted by age and sex (c, d). The detailed statistics are reported in Supplementary Table 5, 6.
Extended Data Fig. 3
Extended Data Fig. 3. Faecal carbohydrate metabolites are associated with IR-related pathologies.
a, The faecal xylose, glucose, and arabinose were compared between individuals with normal weight, overweight, and obesity in the TwinsUK cohort (n = 786). b, The associations between faecal carbohydrates observed in at least 50% samples and HOMA-IR in the TwinsUK cohort (n = 550). The size and colour of the disks represent the estimate and the direction of the associations. Metabolites with Padj < 0.05 are depicted (n = 550). c, The associations between faecal glucose and arabinose and HOMA-IR as analysed in Fig. b. The lines and grey zones show the fitted linear regression lines with 95% confidence intervals. The estimates of metabolites and their P values are described. d, The association between faecal fructose/glucose/galactose and BMI in non-IBD individuals aged > 10 years old in the HMP2 cohort (n = 16). The data were analysed with a generalized linear mixed-effect model with consent age and sex as fixed effects, and the sample collection site as a random effect. The line and grey zone show the fitted linear regression lines with a 95% confidence interval. The estimate and P value are described. The first faecal sampling for metabolomics was used to avoid redundancy. Density plots indicate median and distribution. *P < 0.05, **P < 0.01; rank-based linear regression adjusted by age, sex, and zygosity (a) and generalized linear mixed-effect models with age, sex, zygosity, and BMI as fixed effects, and sample collection year as a random effect (b). The detailed statistics are reported in Supplementary Table 9.
Extended Data Fig. 4
Extended Data Fig. 4. Faecal DGDG and their precursors.
a, The associations between the faecal levels of digalactosyl/glucosyldiacylglycerols (DGDGs) in lipid CAG 11 from Fig. 1b, and their precursor DGs (left panel) and monosaccharides, i.e., glucose and galactose (right panel) (n = 282).
Extended Data Fig. 5
Extended Data Fig. 5. Faecal microbiota in IR.
a, b, Chao1 and Shannon’s alpha diversity indices in IR and MetS (n = 282). c, d, PCoA plots of Bray-Curtis dissimilarity, showing the variations of faecal microbiota at the genus level based on 16S rRNA gene sequencing (c), and at the species (mOTU) level based on shotgun sequencing (d), clustered by IR or MetS (n= 282). Dots represent individual data summarized into PCo1 and PCo2. e, PCA plots showing the variations of KEGG orthologues based on shotgun metagenomic sequencing clustered by IR or MetS (n = 266). Dots represent individual data summarized into PC1 and PC2. f, Co-abundance groups of genus-level microbes and their abundance in the participant clusters defined in Fig. 2a. Co-abundance was determined based on compositionality-corrected Spearman’s correlations, with Padj < 0.05 considered significant. The disk size represents the median abundance in the participants. Three co-abundance groups were determined based on their networks, while the rest of the microbes were named as “miscellaneous”. g, The co-abundance groups of genus-level microbes and their abundance in the participant clusters. Those not clustered by compositionality-corrected Spearman’s correlations in f were shown as “Unclustered”. The size of the disks represents overabundance to the mean in four clusters of participants determined in Fig. 2a. The far-left column shows the genera that exhibit significant differences among the four clusters. h, The co-abundance clusters of microbes at the genus level using the shotgun metagenomic data and their abundance (n = 266). The genera forming distinct groups in f, i.e., groups 1, 2, and 3, were included in this analysis. The participants were clustered into three mOTU clusters A to C based on the heatmap clustering. The proportion of individuals with IS, intermediate, and IR are shown in the pie charts above the heatmap as Fig. 2a. i, The associations between representative metabolic markers and genera (left panel, n = 282) and mOTU (right, n = 266). Only those with significant associations with metabolic markers are depicted. The disk size and colour represent absolute values of standardized coefficient and the direction of associations. The detailed statistics are reported in Supplementary Table 11. j, Microbe-metabolite networks of IR- or and IS-associated co-abundance microbial groups from Fig. 2a and faecal metabolites (n = 282). All faecal hydrophilic metabolites and faecal microbe-related lipid metabolites were included in the analysis. Only those with negative Spearman’s correlation between the genus-level microbial abundance and the metabolites with Padj < 0.05 are shown, which is complementary to Fig. 2c. The metabolites in CAGs relating to carbohydrates shown in Fig. 1b are highlighted in red. k, The relative abundance of IR-associated faecal carbohydrates in the participant clusters. The metabolites significantly different among these four clusters are coloured grey in the top row. a, b, Box plots indicate the median, upper and lower quartiles, and upper and lower extremes except for outliers. Kruskal-Wallis test (g, k). See the Source Data (g) for exact P values. Source Data
Extended Data Fig. 6
Extended Data Fig. 6. Microbial carbohydrate metabolism is altered in IR.
a, b, The associations between the KEGG pathways relating to amino acid metabolism (a) and lipid metabolism (b), faecal carbohydrates, top three genera positively or negatively correlated with faecal carbohydrates in Fig. 2d, and the participant clusters defined in Fig. 2a. KEGG orthologues significantly (Padj < 0.05) associated with the metabolite (left) and taxonomic abundance (right) are summarized as percent enrichment among the KEGG pathways. The median % of 15 faecal carbohydrates are coloured in the left panel whereas % enrichment is depicted as the disk size in the right panel. The Spearman’s correlations between pathway-level abundance and 6 genera were analysed in the middle panel (n = 266). c, The associations between representative metabolic markers and the KEGG pathways relating to carbohydrate metabolism, amino acid metabolism, lipid metabolism, and membrane transport defined in the KEGG orthology database. The pathways with significant associations with metabolic markers are included in the plots. The disk size and colour represent % enrichment and the direction of associations, and only significant (Padj < 0.05) associations are depicted (n = 266). d, Spearman’s correlation between KEGG orthologues associated with phosphotransferase system (PTS) and faecal carbohydrate metabolites. KEGG orthologues significantly (Padj < 0.05) associated with faecal metabolites are coloured red or blue (n = 266). The far-left column shows the type of carbohydrate metabolites that each PTS gene is involved in. e, The abundance of representative KEGG orthologues involved in PTS were compared among four participant clusters (n = 266). The abundance was transformed by arcsine square root transformation. f, Spearman’s correlation between KEGG orthologues significantly associated with glycoside hydrolases in starch and sucrose metabolism (KEGG pathway #00500) and faecal carbohydrate metabolites (n = 266). The far-left column shows whether the genes were predicted to function as extracellular enzymes. g, Representative pathways in starch and sucrose metabolism (KEGG pathway #00500) relating to glycosidase activities to degrade poly- and oligosaccharides into monosaccharides. h, The abundance of representative KEGG orthologues involved in glycosidase were compared among four participant clusters (n = 266). The abundance was transformed by arcsine square root transformation. i, The presence and absence of KEGG orthologues predicted to function as extracellular enzymes in 45 strains. The strains from the top three genera positively or negatively correlated with faecal carbohydrates shown in Fig. 2d, i.e., Bacteroides, Alistipes, Flavonifractor, Dorea, Blautia, and Coprococcus, were included in this analysis. Density plots indicate median and distribution (e, h). *P < 0.05, **P < 0.01, ***P < 0.001 in comparison to cluster C (with the lowest proportion of IR); Kruskal-Wallis test with Dunn’s test (e, h) (Supplementary Table 18).
Extended Data Fig. 7
Extended Data Fig. 7. Cytokine and faecal metabolite interactions in IR.
a, Cell-type gene set enrichment analysis based on the Human Gene Atlas database using Enrichr. Annotated peripheral blood mononuclear cell (PBMC) transcripts positively or negatively associated with IR (Supplementary Table 21) were analysed (n = 275). Red and blue colour scales represent IR and IS-associated cell types, respectively (please refer to Methods for details). b, The cross-omics network shown in Fig. 3a with the annotations. c, The number of correlations between faecal carbohydrates and other omics elements shown in Fig. 3a. The proportion to all possible correlations is shown. d, Representative causal mediation models analysing the effects of IL-10 and adiponectin mediating in silico relationships between faecal carbohydrates and HOMA-IR. Causal mediation analysis with multiple test corrections were used to test significance. Estimates (β) and Padj values of average causal mediation effects (ACME), which are the indirect effects between the metabolites and host markers mediated by cytokines, and average direct effects (ADE), which are the direct effects controlling for cytokines, are described. Age and sex were adjusted in the models. The detailed information is reported in Supplementary Table 23.
Extended Data Fig. 8
Extended Data Fig. 8. Bacteroidales strains distinctly alter metabolites in the culture supernatant.
a, b, PCA plots of metabolites in cell-free supernatants of 22 bacterial strains listed in (a). These strains were selected based on the findings from the genus-level co-occurrence (Fig. 2a, b) and the species-level profiles (Extended Data Fig. 5i). The strains from genera and species relating to IR-related markers shown in Extended Data Fig. 5i are particularly highlighted in boldface. The top 10 metabolites contributing to the PCA separation (left panel) and 13 out of 15 IR-related carbohydrates identified in Fig. 1b (right panel) are biplotted on the PCA plot, respectively (b). c, d, The levels of carbohydrate fermentation products (c) and carbohydrates relating to IR in the human cohort (d) in the cell-free supernatants. e, Pie charts summarizing the consumption and production of carbohydrates shown in (d). Those significantly decreased or increased compared with the vehicle control group were considered as consumption or production. f, The top consumers of carbohydrates, which summarizes the results shown in (e). Representative data of two independent experiments. c, d, Data are mean and s.d. The detailed statistics are reported in Supplementary Table 24 (n = 3 per group).
Extended Data Fig. 9
Extended Data Fig. 9. Alistipes indistinctus ameliorates IR.
a, Body mass change from the baseline. The P value adjusted by baseline body mass by ANCOVA are shown (n = 25 and 26 for control and A. indistinctus (AI) groups, respectively. Pooled data of three independent experiments). b, TG contents in the liver (n = 12 and 14 for control and AI groups, respectively. Pooled data of two independent experiments). c, d, The blood glucose levels (c) and AUC (d) in intraperitoneal glucose tolerance test (IPGTT) (n = 5 and 4 for control and AI groups, respectively). e–g, Serum levels of HDL-cholesterol (HDL-C, e), triglycerides (TG, f), and adiponectin (g) (n = 5 per group in e and f, n = 8 per group in g). h, Glucose infusion rate (GIR) during hyperinsulinemic-euglycemic clamp (n = 7 per group). The rates at 90, 105, and 120 min after the start of insulin infusion were shown as representative of steady-state conditions of euglycemia. i, j, Whole-body glucose disposal rate (Rd, i) and hepatic glucose production (HGP, j) measured with hyperinsulinemic-euglycemic clamp (n = 7 per group). k, l, Representative images of phosphorylated Akt (p-Akt) at S473 and total Akt in the liver and epidydimal fat (eWAT) in mice administered Alistipes indistinctus (AI), Alistipes finegoldii (AF), and PBS as vehicle control (k). The protein expression of p-Akt was normalized to that of total Akt (n = 4 vs 5 vs 5) (l). The raw images of blotting membranes are shown in Supplementary Fig. 1 (n = 3 per group). m–o, Respiratory quotient (RQ) and carbohydrate oxidation rate (m), diet intake (n), and locomotor activity (o) after one-week bacterial administration (n = 4 and 5 for control and AI groups, respectively). P values for interactions between time and group are described in (m). Other metabolic measures are reported in Supplementary Table 25. Representative data of two independent experiments (c–g, k–o). a, Density plots indicate median and distribution. b–j, l, m, Data are mean and s.d. ANCOVA (main panel) with unadjusted linear regression (right panel) (a), two-sided Wilcoxon rank-sum test (b, d–g, i, j), two-way repeated measure ANOVA (c), Two-way ANOVA (h) and one-way ANOVA (l) with Tukey’s test, two-way mixed ANOVA (m), and Kruskal-Wallis test (n, o). Source Data
Extended Data Fig. 10
Extended Data Fig. 10. Alistipes indistinctus reduces intestinal carbohydrates.
a, PCA plots of metabolites in caecal contents of AI-administered mice. The top 10 metabolites contributing to the PCA separation (left panel) and 12 out of 15 IR-related carbohydrates identified in Fig. 1b (right panel) are biplotted on the PCA plot, respectively (n = 8 per group). b, The PC1 of PCA plots in Fig. a (n = 8 per group). c, Caecal levels of representative IR-related carbohydrates observed in AI-administered mice (n = 8 per group). The detailed statistics of all caecal metabolites are reported in Supplementary Table 26. d, Serum levels of fructose in AI-administered mice (n = 7 and 5 for control and AI groups, respectively). e, A schematic summary. In this study, we combined faecal metabolome, 16S rRNA gene sequencing, and metagenome data with host metabolome, transcriptome, and cytokine data to comprehensively delineate the involvement of gut microbiota in IR (upper panel). Carbohydrate degradation products such as monosaccharides are prominently increased in IR (middle panel). Metagenomic findings show that the degradation and utilization of poly- and disaccharides are facilitated in IR and that these microbial functions are strongly associated with faecal monosaccharides. Further analysis also suggests that the effects of these metabolites on host metabolic parameters such as BMI are in part mediated by specific cytokines. Finally, our animal experiments provide evidence showing that oral administration of AI, a candidate strain selected based on human cohort findings, reduces intestinal carbohydrates and lipid accumulation, thereby leading to the amelioration of IR (lower panel). Taken together, our study provides novel insights into the mechanisms of host-microbe interplays in IR. Representative data of two independent experiments. b, Box plots indicate the median, upper and lower quartiles, and upper and lower extremes except for outliers. c, d, Data are mean and s.d. Two-sided Wilcoxon rank-sum test (b–d). Source Data

Comment in

References

    1. Moller DE. New drug targets for type 2 diabetes and the metabolic syndrome. Nature. 2001;414:821–827. doi: 10.1038/414821a. - DOI - PubMed
    1. Després JP, Lemieux I. Abdominal obesity and metabolic syndrome. Nature. 2006;444:881–887. doi: 10.1038/nature05488. - DOI - PubMed
    1. Turnbaugh PJ, et al. An obesity-associated gut microbiome with increased capacity for energy harvest. Nature. 2006;444:1027–1031. doi: 10.1038/nature05414. - DOI - PubMed
    1. Turnbaugh PJ, et al. A core gut microbiome in obese and lean twins. Nature. 2009;457:480–484. doi: 10.1038/nature07540. - DOI - PMC - PubMed
    1. Qin J, et al. A metagenome-wide association study of gut microbiota in type 2 diabetes. Nature. 2012;490:55–60. doi: 10.1038/nature11450. - DOI - PubMed

Publication types

LinkOut - more resources