. 2023 Sep;621(7977):146-153.
doi: 10.1038/s41586-023-06465-y. Epub 2023 Aug 30.

LTP induction by structural rather than enzymatic functions of CaMKII

Affiliations

LTP induction by structural rather than enzymatic functions of CaMKII

Jonathan E Tullis et al. Nature. 2023 Sep.

Abstract

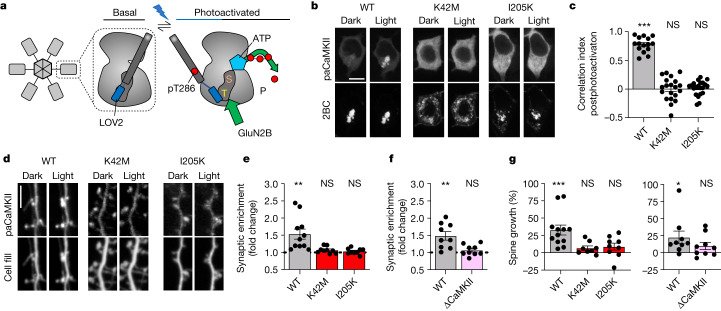
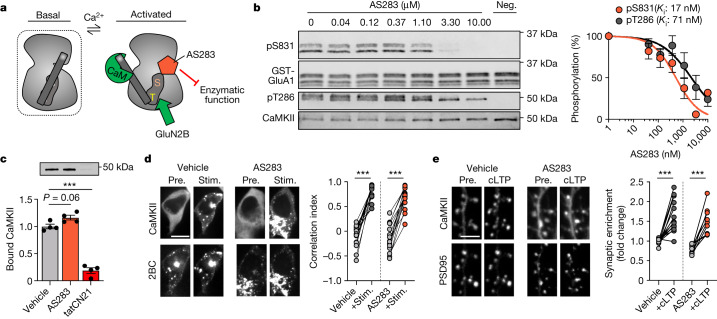
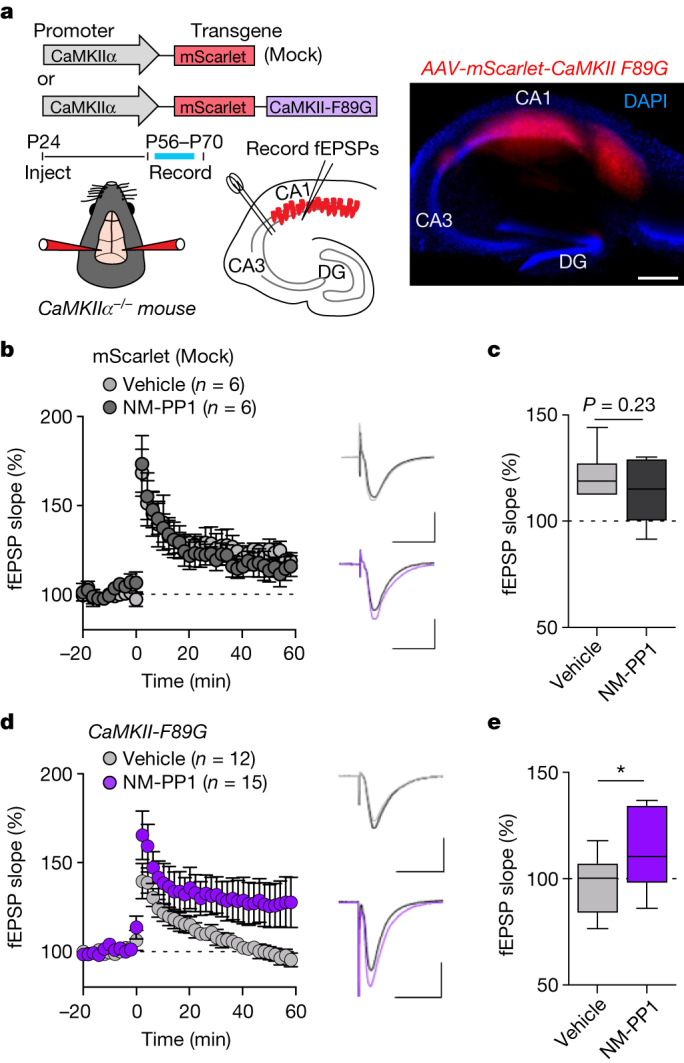
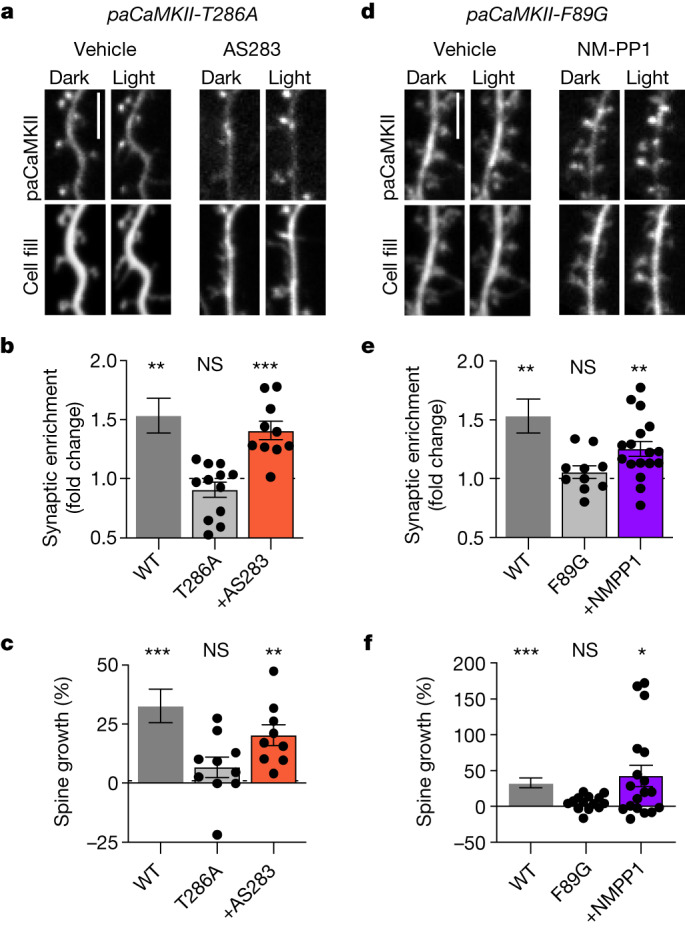
Learning and memory are thought to require hippocampal long-term potentiation (LTP), and one of the few central dogmas of molecular neuroscience that has stood undisputed for more than three decades is that LTP induction requires enzymatic activity of the Ca2+/calmodulin-dependent protein kinase II (CaMKII)1-3. However, as we delineate here, the experimental evidence is surprisingly far from conclusive. All previous interventions inhibiting enzymatic CaMKII activity and LTP4-8 also interfere with structural CaMKII roles, in particular binding to the NMDA-type glutamate receptor subunit GluN2B9-14. Thus, we here characterized and utilized complementary sets of new opto-/pharmaco-genetic tools to distinguish between enzymatic and structural CaMKII functions. Several independent lines of evidence demonstrated LTP induction by a structural function of CaMKII rather than by its enzymatic activity. The sole contribution of kinase activity was autoregulation of this structural role via T286 autophosphorylation, which explains why this distinction has been elusive for decades. Directly initiating the structural function in a manner that circumvented this T286 role was sufficient to elicit robust LTP, even when enzymatic CaMKII activity was blocked.


Conflict of interest statement

The Regents of the University of Colorado have filed a provisional patent application, with inventors J.E.T., M.E.L., N.L.R. and K.U.B., capturing the findings reported in this manuscript. K.U.B. is a co-founder and board member of Neurexis Therapeutics, a company that seeks to develop a CaMKII inhibitor into a therapeutic drug for cerebral ischaemia. The other authors declare no competing interests.

Figures

Fig. 1
Fig. 1. paCaMKII photoactivation-induced sLTP requires GluN2B binding.
Data are presented as mean values ± s.e.m. a, Schematic of how photoactivation of paCaMKII allows access to both S and T sites, thereby enabling both enzymatic CaMKII activity and GluN2B binding. b, Representative confocal microscopy images of HEK293 cells co-expressing GFP–paCaMKII (WT, K42M or I205K) and pDisplay-mCherry-GluN2B-c tail (mCh-2BC) before and after photoactivation. Scale bar, 10 µm. Quantification is shown in panel c. c, Pearson’s correlation (correlation index) of GFP–paCaMKII WT or mutants and mCh-2BC 5 min after photoactivation (n = 15, 20, 21 cells; one-sample t-test). WT P < 0.0001; K42M P = 0.9468; I205K P = 0.5885. ***P < 0.001. d, Representative confocal microscopy images of dissociated rat hippocampal cultures expressing GFP–paCaMKII (WT, K42M or I205K) and mCherry cell fill before and after photoactivation. Scale bar, 5 µm. Quantification is shown in panel e. e, Fold change of paCaMKII WT and mutant synaptic enrichment values 15 min after photoactivation (n = 11, 9, 9 cells; one-sample t-test). WT P = 0.0042; K42M P = 0.0568; I205K P = 0.3523. **P < 0.01; f, Fold change of paCaMKII synaptic enrichment values 15 min after photoactivation in WT and GluN2BΔCaMKII mice (n = 9, 9 cells; one-sample t-test). WT P = 0.0038; GluN2BΔCaMKII P = 0.2172. **P < 0.01. g, Changes in the dendritic spine area were measured after paCaMKII photoactivation via mCherry cell fill fluorescence intensity within a spine (n = 12, 8, 9, 9, 9 cells; one-sample t-test). In the left panel, WT P = 0.008; K42M P = 0.0692; and I205K P = 0.1236. In the right panel, WT P = 0.0481 and GluN2BΔCaMKII P = 0.1406. *P < 0.05, ***P < 0.001. NS, not significant. Source data
Fig. 2
Fig. 2. AS283 inhibits CaMKII enzymatic function but does not impair GluN2B binding or synaptic localization.
Data are presented as mean values ± s.e.m. a, Schematic of the AS283 inhibitor mechanism of action: ATP-competitive inhibition blocks enzymatic activity while mimicking the nucleotide binding requirement to allow interaction with GluN2B. b, Representative immunoblot and quantification of in vitro kinase reactions at 30 °C in 1 mM ATP measuring purified CaMKIIα phosphorylation of GST–GluA1 S831 with varying concentrations of AS283 (0.41–10 μM; n = 4 independent concentration curves). For a negative control (Neg.), ATP was omitted. Ki values were derived from half-maximal inhibitory concentration (IC50) values of AS283-mediated inhibition of CaMKII phosphorylation of S831 and T286 using an experimentally derived Km value of 33.3 μM (Extended Data Fig. 2b). c, Binding of purified CaMKIIα to immobilized GST–GluN2B-c was induced by Ca2+/CaM in the presence of 1 mM ADP alone or with 10 μM AS283 or 5 μM tatCN21 (n = 4 independent samples; one-way analysis of variance (ANOVA) with Tukey’s multiple comparisons test). ADP:AS283 P = 0.0697; ADP:tatCN21 P < 0.0001. ***P < 0.001. d, Confocal microscopy images of HEK293 cells co-expressing GFP–CaMKII and mCherry-2BC. Correlation indices before (Pre.) and after (Stim.) ionomycin-induced colocalization of GFP–CaMKII and mCherry-2BC under vehicle or 10 μM AS283 conditions (n = 18, 16 cells; repeated measures (RM) two-way ANOVA with Šídák’s multiple comparisons test). Scale bar, 10 μm. Vehicle P < 0.0001; AS283 P < 0.0001. ***P< 0.001. e, Confocal microscopy images of dissociated rat hippocampal cultures expressing GFP–CaMKII and mCh-PSD95 intrabody in the presence of 10 μM AS283 before and after cLTP (100 μM glutamate, 10 μM glycine; 45 s). CaMKII synaptic enrichment was measured before and after cLTP (n = 14,9 cells; RM two-way ANOVA with Šídák’s multiple comparisons test). Scale bar, 5 μm. Vehicle P < 0.0001; AS283 P < 0.0001. ***P  < 0.001. Source data
Fig. 3
Fig. 3. AS283 does not inhibit LTP in WT mice and enables LTP in T286A mice.
Data are presented as mean values ± s.e.m. a, Two times HFS potentiates the CA3–CA1 Schaffer collateral pathway in WT mice. LTP was additionally measured after inhibition of CaMKII with 10–30 μM AS283 or 5 μM tatCN21 (incubated for 15 min before HFS and washed out 5 min after LTP induction; n = 10, 10, 4 animals). Scale bar, 0.5 mV by 20 ms. b, Quantification of LTP in WT mice after vehicle, AS283 or tatCN21 treatments (n = 10, 10, 4 animals; one-way ANOVA, Tukey’s multiple comparisons test). Vehicle:AS283 P = 0.1292; vehicle:tatCN21 P = 0.0097; AS283:tatCN21 P = 0.009. **P < 0.01. c, LTP was measured by field excitatory post-synaptic potentials (fEPSP) in T286A mice after two times HFS under vehicle conditions and after inhibition of CaMKII by 10 μM AS283 during LTP induction (n = 3, 4 animals). Scale bar, 0.5 mV by 20 ms. d, Quantification of LTP in T286A mice after vehicle or AS283 treatment (n = 3, 4 animals; two-tailed Student’s t-test). Vehicle:AS283 P = 0.0048. **P < 0.01. e,f, Binding of purified CaMKIIα to immobilized GST–GluN2B-c WT (e) or S1303A (f) was induced by Ca2+/CaM without nucleotide, with 1 mM ATP or with 10 μM AS283. e, n = 4, 4, 4. f, n = 3, 4, 3. One-way ANOVA with Tukey’s multiple comparisons test. e, –:ATP P < 0.0001; –:AS283 P < 0.0001; ATP:AS283 P = 0.0018. f, –:ATP P = 0.0082; –:AS283 P = 0.0150; ATP:AS283 P = 0.9735. **P < 0.01, ***P < 0.001. Source data
Fig. 4
Fig. 4. The CaMKII mutation F89G impairs ATP binding but binds the ATP-competitive inhibitor NM-PP1 that restores GluN2B binding and LTP-induced synaptic translocation.
Data are presented as mean values ± s.e.m. a, Schematic of the pharmacogenetic method of ATP-competitive CaMKII inhibition; enlargement of the CaMKII ATP-binding pocket by the F89G mutation allows for selective binding of the ATP-competitive inhibitor NM-PP1. b, Immunoblots of in vitro kinase reactions at 30 °C including GFP–CaMKII WT, K42M and F89G with GST–GluA1-c tail. Reactions were performed either with vehicle control or with 10 μM NM-PP1 (n = 1) (related independent experiments are in Extended Data Fig. 4a). c, Confocal microscopy images of HEK293 cells co-expressing GFP–CaMKII F89G and mCherry-2BC in the presence of vehicle or 10 μM NM-PP1 before and after ionomycin stimulation. Correlation indices were measured before and after Ionomycin-induced colocalization of GFP–CaMKII (WT, K42M and F89G) with mCherry-2BC, represented as change in the correlation index (vehicle: n = 22, 17, 12 cells; NM-PP1: n = 20, 24, 13 cells; one-way ANOVA, Tukey’s multiple comparisons test). Scale bar, 10 μm. For vehicle, WT:F89G P < 0.0001, WT:K42M P < 0.0001 and F89G:K42M P = 0.7333. For NM-PP1, WT:F89G P = 0.7771, WT:K42M P = 0.0009 and F89G:K42M P < 0.0001. ***P < 0.001. d, Confocal microscopy images of dissociated rat hippocampal cultures expressing GFP–CaMKII (WT, K42M or F89G) and mCh-PSD95 intrabody before and after cLTP. CaMKII synaptic enrichment was measured before and after cLTP (n = 13, 14, 14 cells; RM two-way ANOVA with Šídák’s multiple comparisons test). Scale bar, 5 μm. For basal, WT:K42M P = 0.0022, WT:F89G P = 0.0655 and K42M:F89G P = 0.5478. For cLTP, WT:K42M P < 0.0001, WT:F89G P = 0.0004 and K42M:F89G P = 0.9562. **P < 0.01, ***P < 0.001. e, Confocal microscopy images before and after cLTP as in panel d but in the presence of 10 μM NM-PP1. CaMKII synaptic enrichment was measured before and after cLTP (n = 7, 6, 7 cells; RM two-way ANOVA with Šídák’s multiple comparisons test). Scale bar, 5 μm. For basal, WT:K42M P = 0.0079, WT:F89G P = 0.6909 and K42M:F89G P = 0.0009. For cLTP, WT:K42M P < 0.0001, WT:F89G P = 0.9582 and K42M:F89G P < 0.0001. **P < 0.01, ***P < 0.001. Source data
Fig. 5
Fig. 5. Pharmacogenetic restoration of CaMKII binding to GluN2B restores LTP in hippocampal slices.
a, Schematic illustration of the molecular replacement approach (top and middle) and representative image of an acute hippocampal slice expressing AAV-mScarlet-CaMKII F89G (red) and stained with DAPI to label nuclei (blue; bottom). Scale bar, 500 μm. This experiment was repeated independently at least four times with similar results. b, fEPSPs were measured in slices from CaMKIIα KO mice injected with AAV-mScarlet (mock) after two times HFS stimulation. Slices were treated either with vehicle or 10 μM NM-PP1 for 15 min before HFS and for 5 min post-LTP induction. Scale bar, 0.5 mV by 20 ms. Data are presented as mean values ± s.e.m. c, Quantification of the synaptic response 60 min following LTP induction in AAV-mScarlet (mock)-expressing slices after vehicle or NM-PP1 (n = 6 slices from six animals; two-tailed Student’s t-test). The box plots show the medians (centre lines) and quartiles (box limits) with Tukey whiskers. P = 0.2340. d, fEPSPs were measured in slices from CaMKIIα KO mice injected with AAV-mScarlet-CaMKII-F89G after two times HFS stimulation. Slices were treated either with vehicle or 10 μM NM-PP1 for 15 min before and for 5 min post-HFS. Scale bar, 0.5 mV by 20 ms. Data are presented as mean values ± s.e.m. e, Quantification of synaptic response 60 min following LTP induction in AAV-mScarlet-CaMKII-F89G-expressing slices after vehicle or NM-PP1 (n = 12; 15 slices from 13 animals; one-tailed Student’s t-test with Welch’s correction). The box plots show the medians (centre lines) and quartiles (box limits) with Tukey whiskers. P = 0.0235. *P< 0.05. Source data
Fig. 6
Fig. 6. Photoinduction of CaMKII binding to GluN2B is sufficient to induce spine growth in hippocampal neurons.
Data are presented as mean values ± s.e.m. a, Representative images of GFP–paCaMKII T286A and mCherry cell fill expressed in cultured hippocampal neurons before and after blue-light stimulation. Cells treated with 10 μM AS283 are marked. Scale bar, 5 μm. b, Fold change of paCaMKII T286A (±10 μM AS283) synaptic enrichment values 15 min after photoactivation compared with paCaMKII WT (from Fig. 1e) (n = 11, 12, 10 cells; one-sample t-test). WT P = 0.0042; T286A P = 0.1773; T286A + AS283 P = 0.0005. **P < 0.01, ***P < 0.001. c, Changes in dendritic spine area were measured after photoactivation of paCaMKII T286A (10 μM AS283) compared with paCaMKII WT (from Fig. 1f) (n = 12, 10, 9 cells; one-sample t-test). WT P = 0.0008; T286A P = 0.1519; T286A + AS283 P = 0.0018. **P< 0.01, ***P< 0.001. d, Representative images of GFP–paCaMKII F89G and mCherry cell fill expressed in cultured hippocampal neurons before and after blue-light stimulation. Cells treated with 10 μM NM-PP1 are marked. Scale bar, 5 μm. e, Fold change of paCaMKII F89G (10 μM NM-PP1) synaptic enrichment values 15 min after photoactivation compared with paCaMKII WT (from Fig. 1e) (n = 11, 10, 17 cells; one-sample t-test). WT P = 0.0042; F89G P = 0.2924; F89G + NM-PP1 P = 0.0010. **P < 0.01. f, Changes in dendritic spine area were measured after photoactivation of paCaMKII F89G (±10 μM NM-PP1) compared with paCaMKII WT (from Fig. 1f) (n = 12, 14, 18 cells; one-sample t-test). WT P = 0.0008; F89G P = 0.0537; F89G + NM-PP1 P = 0.0101. *P < 0.05, ***P < 0.001. Source data
Extended Data Fig. 1
Extended Data Fig. 1. paCaMKII photoactivation-induced sLTP requires GluN2B binding. Data are presented as mean values +/− SEM.
a, Representative images of GFP-paCaMKII WT and mCherry-2BC expressed in cultured hippocampal neurons before and after blue light stimulation. Time course of correlation indices of GFP-paCaMKII and mCh-2BC after photoactivation. Images were acquired in a single plane ever 10 s (n = 4 cells). Scale bar indicates 10 µm. b, Schematic of blue light-induced paCaMKII pulldown to immobilized GST-2BC. c, Binding of CaMKII-F89G to immobilized GST-2BC was induced by blue light in the presence of either 100 ADP µM alone or without nucleotide. (n = 4 independent samples; *p < 0.05; one-way Kruskal Wallis with Dunn’s comparison test). Dark:Light+ADP p = 0.0132; Dark:Light-ADP p = 0.1860; Light+ADP:Light-ADP p = 0.9779. d, Schematic of how K42M and I205K CaMKII mutations affect enzymatic activity and the induction of GluN2B binding. e, Representative images of dissociated mouse WT and GluN2BΔCaMKII hippocampal cultures expressing GFP-paCaMKII WT and mCherry cell fill before and after photoactivation. Scale bar indicates 5 µm. n = 9, 9 cells; See Fig. 1f, g (right) for quantification. Source data
Extended Data Fig. 2
Extended Data Fig. 2. AS105 inhibits CaMKII enzymatic function but does not impair GluN2B binding or synaptic localization. Data are presented as mean values +/− SEM.
a, Comparison of AS105 vs AS283 structure. b, Representative Immunoblots and quantification of in vitro kinase reactions at 30 °C with increasing ATP concentration measuring purified CaMKIIα phosphorylation of GST-GluA1 S831. Quantification shown in panel c. c, The Km value of CaMKII for ATP of 33.3 μM was derived from the concentration of ATP that achieved a half-maximal response in 4 independent experiments (95% confidence interval: 4.59 to 52.06). d, Binding of purified CaMKIIα to immobilized GST-GluN2B-c was induced by Ca2+/CaM without nucleotide, or in the presence of either 4 mM ADP or with 10 μM AS105 (n = 3 independent samples; *p < 0.05; one-way ANOVA with Tukey’s multiple comparisons test). –:ADP p = 0.0394; –:AS105 p = 0.0349. e, Confocal microscopy images of HEK293 cells co-expressing GFP-CaMKII and mCherry-2BC. Correlation indices before and after ionomycin-induced colocalization of GFP-CaMKII and mCherry-2BC under vehicle or 10 μM AS105 conditions (n = 23,18 cells; ***p < 0.001, RM two-way ANOVA with Šídák’s multiple comparisons test). Scale bar indicates 10 μm. Vehicle p < 0.0001; AS105 p < 0.0001. f, Confocal microscopy images of dissociated rat hippocampal cultures expressing GFP-CaMKII and mCh-PSD95 intrabody in the presence of 10 μM AS105 before and after cLTP. CaMKII synaptic enrichment was measured before and after cLTP (n = 11,10 cells; *p < 0.05; RM two-way ANOVA with Šídák’s multiple comparisons test). Scale bar indicates 5 μm. Vehicle p = 0.0376; AS105 p = 0.0330. Source data
Extended Data Fig. 3
Extended Data Fig. 3. No difference in LTP in WT mice when CaMKII is inhibited by either 10 or 30 μM AS283. Data are presented as mean values +/− SEM.
a, 2x HFS potentiates the CA3-CA1 Schaffer collateral pathway in WT mice when CaMKII enzymatic activity is inhibited by 10 or 30 μM AS283 (incubated for 15 min prior to HFS, and washed out 5 min after). b, Quantification of LTP in WT mice after 10 or 30 μM AS283 (n = 3,7 hippocampal slices; Mann-Whitney test). p = 0.3833. c, Representative immunoblot and quantification of CaMKII T286 phosphorylation in dissociated hippocampal cultures after cLTP and inhibition by 10 μM AS283 (n = 4 independent cell preparations; one-way ANOVA, Tukey’s multiple comparisons test). The inhibition of T286p in seen hippocampal cultures matches the inhibition seen in vitro (see Fig. 2b). Vehicle:cLTP p < 0.0001; Vehicle:cLTP+AS283 p = 0.0368; cLTP:cLTP+AS283 p = 0.0009. d, Representative immunoblot and quantification of in vitro kinase reactions at 30 °C with purified CaMKII and GST-2BC measuring S1303 phosphorylation and inhibition by 10 μM AS283 (n = 4 independent samples; one-way ANOVA, Tukey’s multiple comparisons test). –:ATP p < 0.0001; –:ATP+AS283 p = 0.0363; ATP:ATP+AS283 p = 0.0002. The inhibition seen for S1303 here matches the inhibition seen for T286 in hippocampal neurons in panel c. Source data
Extended Data Fig. 4
Extended Data Fig. 4. CaMKII WT and K42M are unaffected by NM-PP1 in HEK cells.
Data are presented as mean values +/− SEM. a, Representative immunoblot and quantification of in vitro kinase reactions at 30 °C in 1 mM ATP measuring CaMKIIα WT and F89G phosphorylation of T286 (n = 4 independent samples, **p < 0.01, ***p < 0.001; two-way ANOVA with Šídák’s multiple comparisons test). WT) –:ATP p = 0.0012; –:ATP+NM-PP1 p = 0.0002; ATP:ATP+NM-PP1 p = 0.7989. F89G) –:ATP p = 0.8920; –:ATP+NM-PP1 p = 0.8946; ATP:ATP+NM-PP1 p > 0.9999. b, Confocal microscopy images of HEK293 cells co-expressing GFP-CaMKII WT (top) or GFP-CaMKII K42M (bottom) and mCherry-2BC in the presence of vehicle or 10 μM NM-PP1 before and after ionomycin stimulation. Scale bar indicates 10 μm. n = 22, 17 cells; see Fig. 4c for quantification. c, Binding of CaMKII-F89G to immobilized GST-GluN2B-c was induced by Ca2+/CaM in the presence of either 1 mM ADP or 10 μM NM-PP1. The wash buffer also contained AD or NM-PP1, Ca2+/CaM was replaced with EGTA (n = 4 independent samples; ***p < 0.001; two-tailed student’s t-test). p = 0.0002. Source data
Extended Data Fig. 5
Extended Data Fig. 5. Pharmacogentic restoration of CaMKII binding to GluN2B enables LTP in hippocampal slices.
Data are presented as mean values +/− SEM. a, Schematic illustration of the molecular replacement approach (top) and representative image of acute hippocampal slice expressing AAV-mScarlet (Mock) (red) and labelled with DAPI (blue) (bottom). Scale bar indicates 500 μm. This experiment was repeated independently at least 4 times with similar results. b, Representation of the data shown in Fig. 5c as a scatter plot. (n = 6 slices; p = 0.2340, two-tailed student’s t-test). c, Representation of the data shown in Fig. 5e as a scatter plot (n = 12,15 slices; *p < 0.05, one-tailed student’s t-test with Welch’s correction). p = 0.0235. Significant even with removal of two higher data points for F89G + NM-PP1 (p = 0.0320; one-tailed student’s t-test). d, fEPSPs were measured in slices from CaMKIIα KO mice injected with AAV-mScarlet-CaMKII-F89G after 2x HFS stimulation. The paired vehicle and NM-PP1-treated slices that were available from the same mouse were paired in statistical comparison. e, Quantification of synaptic response 60 min following LTP induction in AAV-mScarlet-CaMKII-F89G-expressing paired slices from the same animal that were treated either with vehicle or NM-PP1 (n = 11 slices from 9 mice; *p < 0.05, one-tailed student’s t-test). p = 0.0304. Source data
Extended Data Fig. 6
Extended Data Fig. 6. Schematic of primary conclusions.
Illustration of CaMKII enzymatic and structural functions and their roles in LTP induction. (1) CaMKII structural functions are required and sufficient to induce LTP. (2) CaMKII autophosphorylation at T286 is required to induce structural functions, but can be circumvented with ATP-competitive inhibitors that enhance GluN2B binding. (3) CaMKII phosphorylation of external substrates is not required to induce LTP.

Comment in

  • A structural function for CaMKII.
    Yates D. Yates D. Nat Rev Neurosci. 2023 Nov;24(11):654. doi: 10.1038/s41583-023-00754-1. Nat Rev Neurosci. 2023. PMID: 37770621 No abstract available.

References

    1. Lisman J, Yasuda R, Raghavachari S. Mechanisms of CaMKII action in long-term potentiation. Nat. Rev. Neurosci. 2012;13:169–182. doi: 10.1038/nrn3192. - DOI - PMC - PubMed
    1. Bayer KU, Schulman H. CaM kinase: still inspiring at 40. Neuron. 2019;103:380–394. doi: 10.1016/j.neuron.2019.05.033. - DOI - PMC - PubMed
    1. Yasuda R, Hayashi Y, Hell JW. CaMKII: a central molecular organizer of synaptic plasticity, learning and memory. Nat. Rev. Neurosci. 2022;23:666–682. doi: 10.1038/s41583-022-00624-2. - DOI - PubMed
    1. Malinow R, Schulman H, Tsien RW. Inhibition of postsynaptic PKC or CaMKII blocks induction but not expression of LTP. Science. 1989;245:862–866. doi: 10.1126/science.2549638. - DOI - PubMed
    1. Buard I, et al. CaMKII “autonomy” is required for initiating but not for maintaining neuronal long-term information storage. J. Neurosci. 2010;30:8214–8220. doi: 10.1523/JNEUROSCI.1469-10.2010. - DOI - PMC - PubMed

MeSH terms

Substances