. 2023 Sep;621(7977):188-195.
doi: 10.1038/s41586-023-06482-x. Epub 2023 Aug 30.

CRISPR screens decode cancer cell pathways that trigger γδ T cell detection

Affiliations

CRISPR screens decode cancer cell pathways that trigger γδ T cell detection

Murad R Mamedov et al. Nature. 2023 Sep.

Abstract

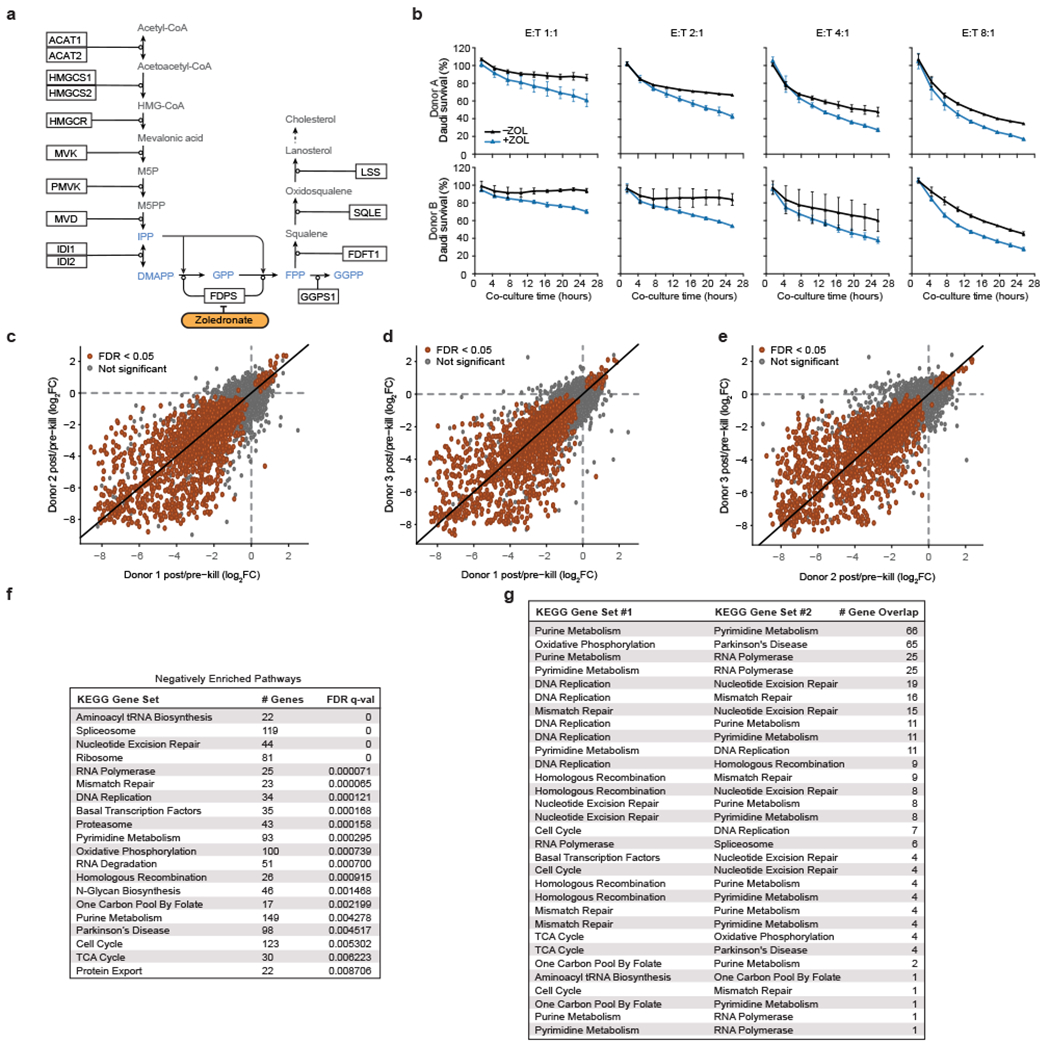
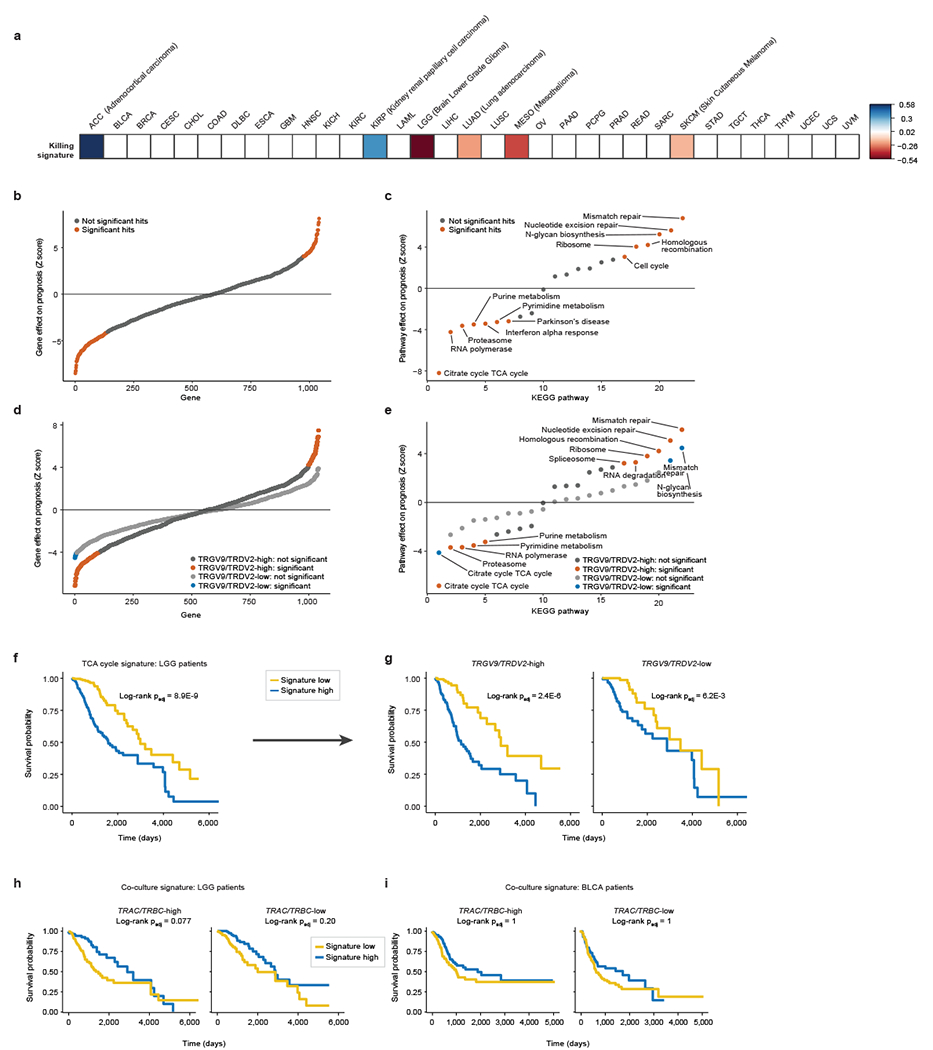
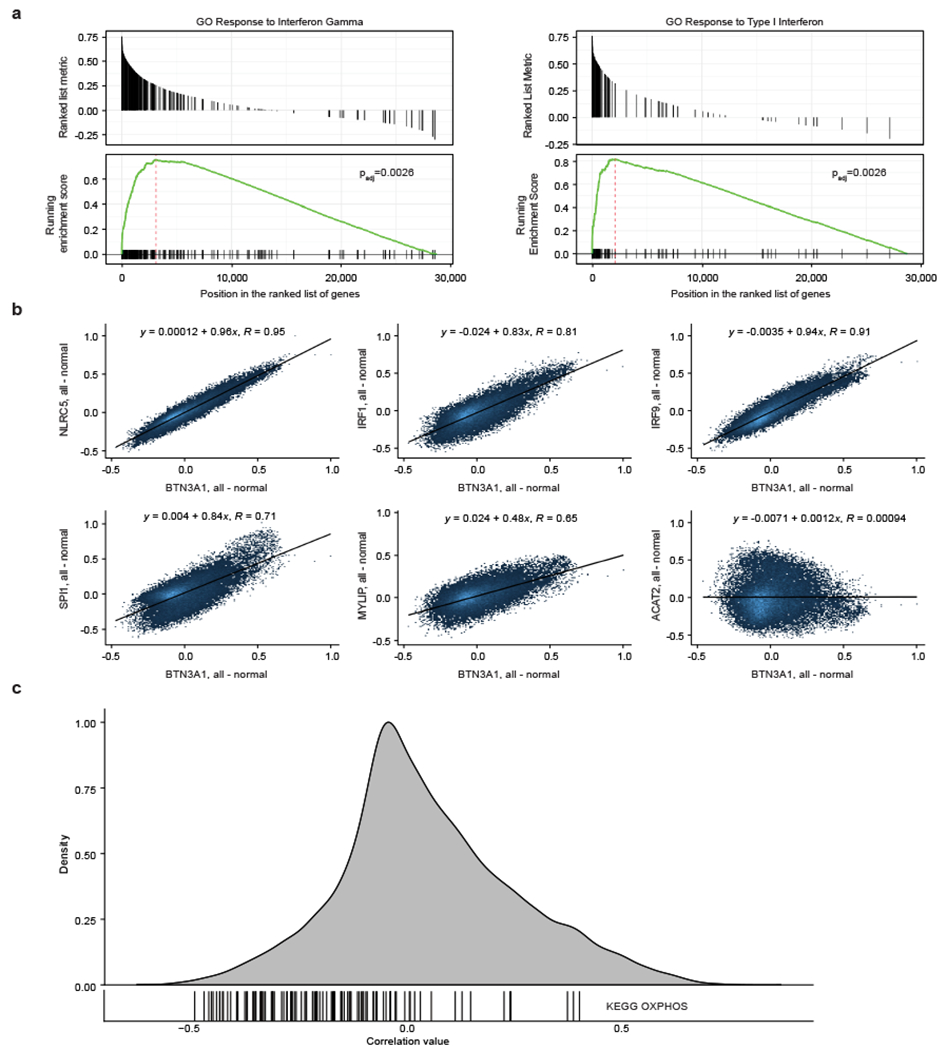
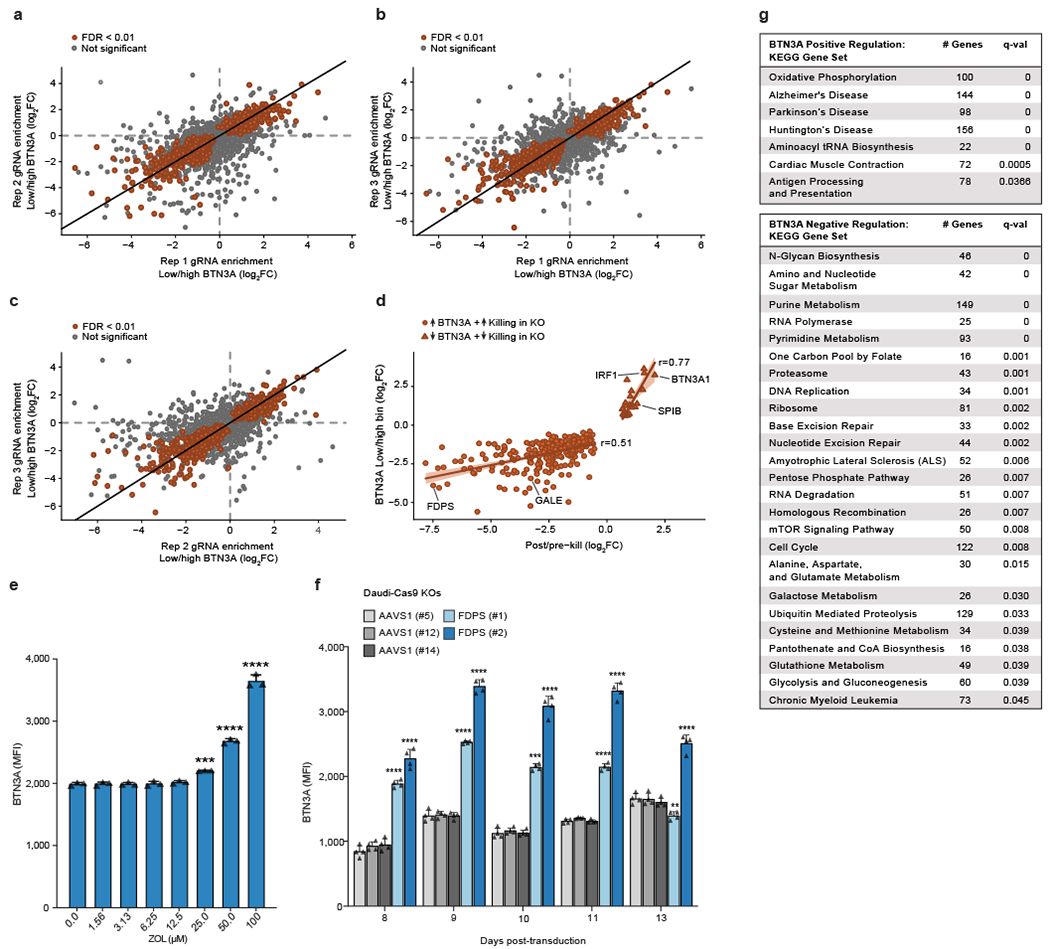
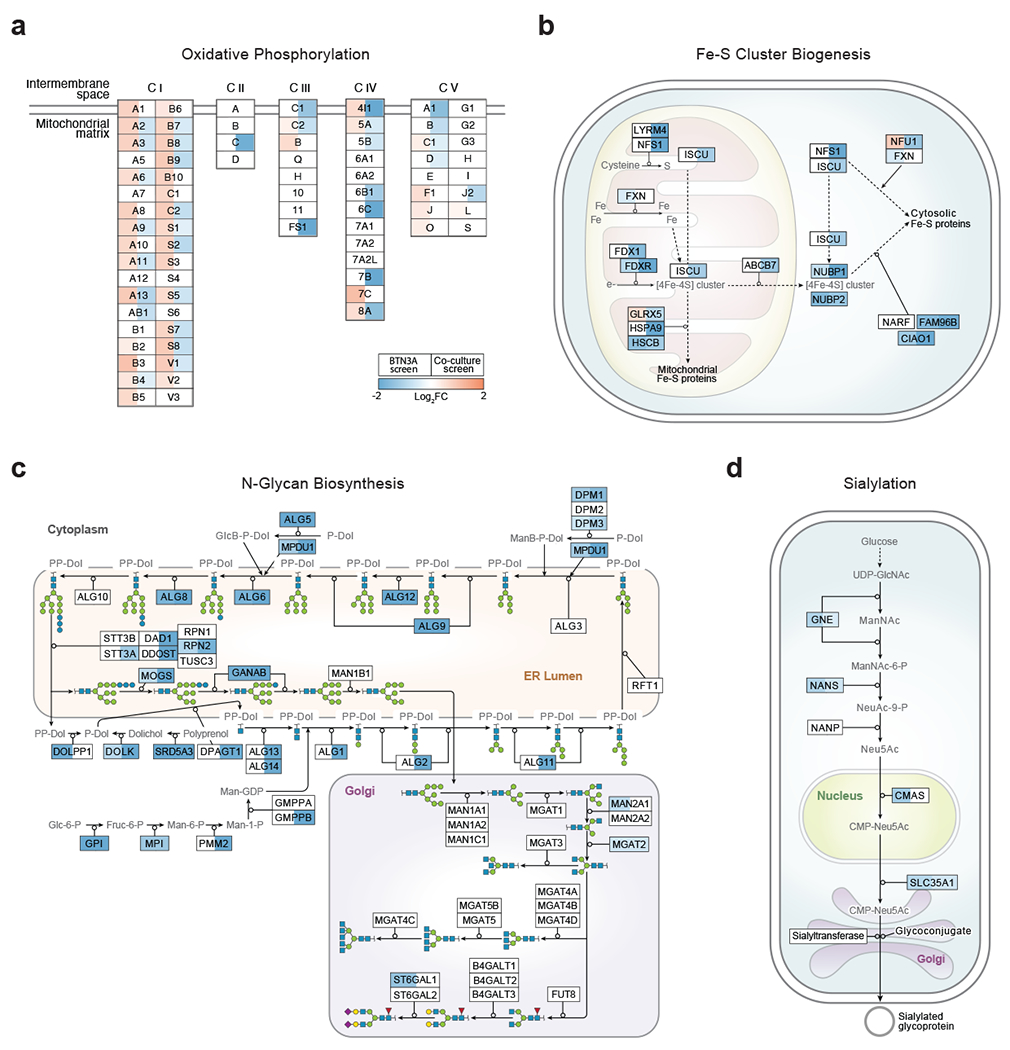
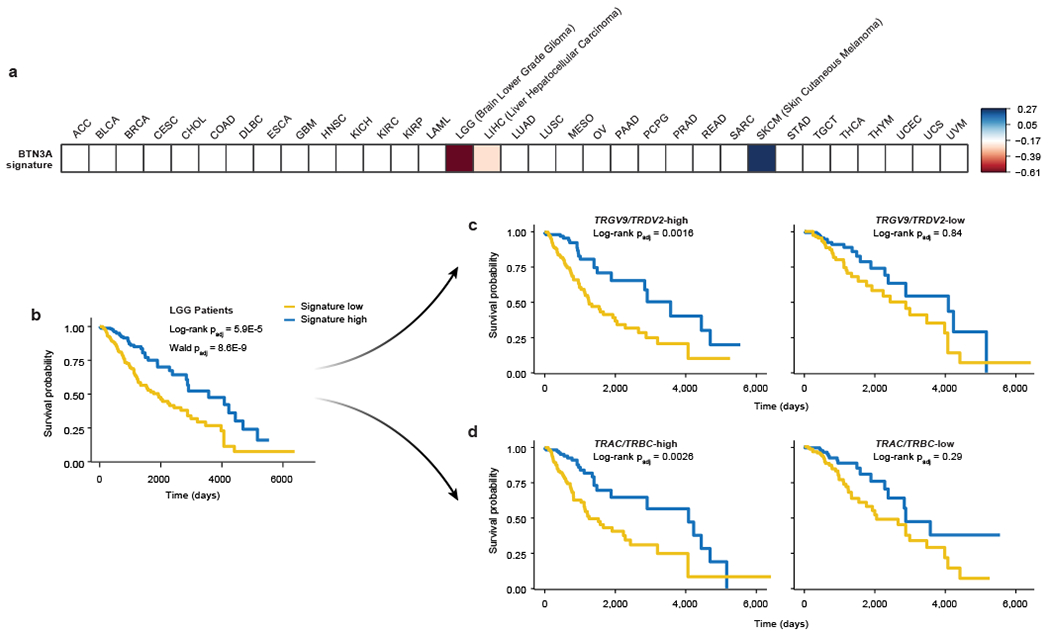
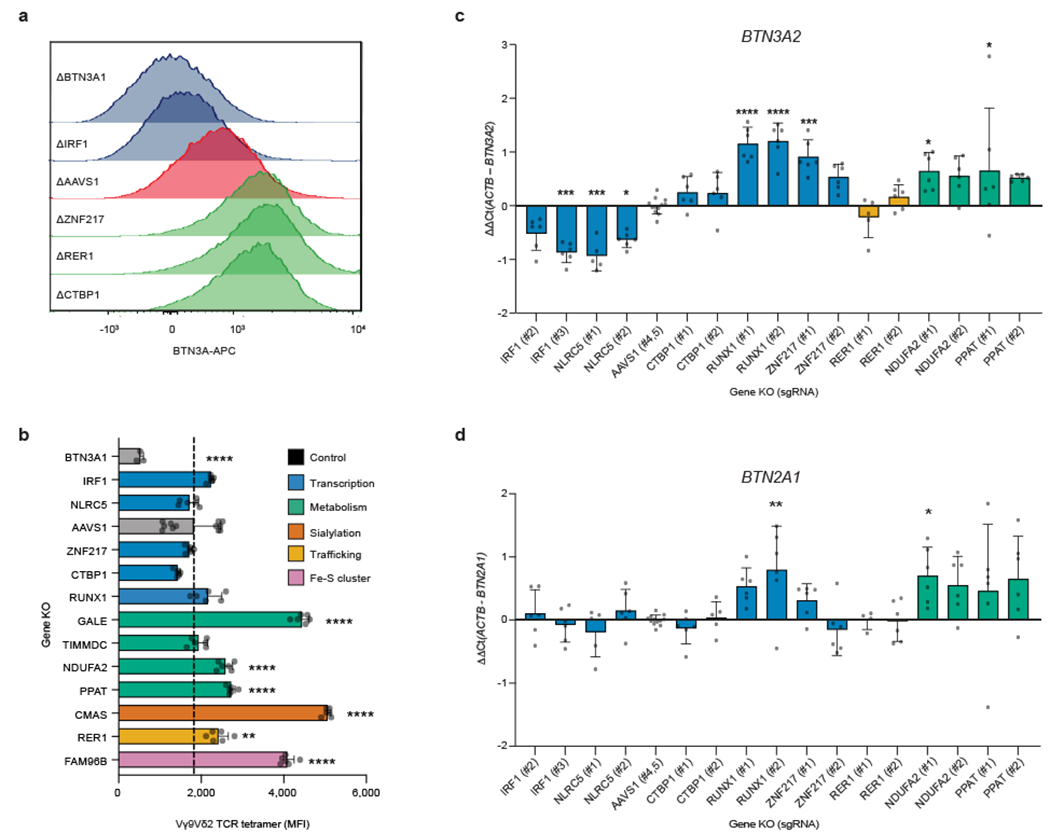
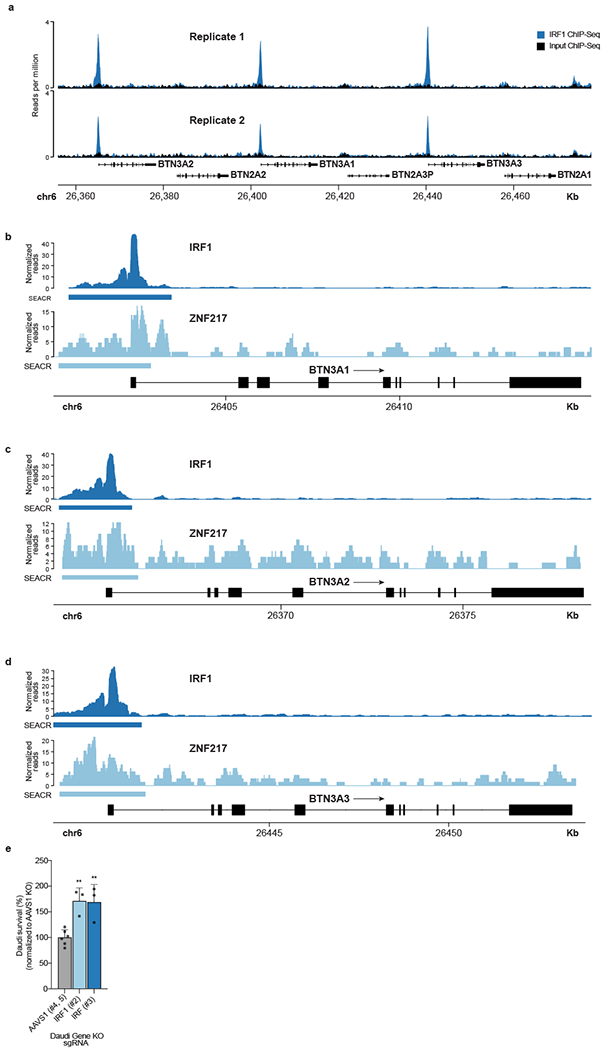
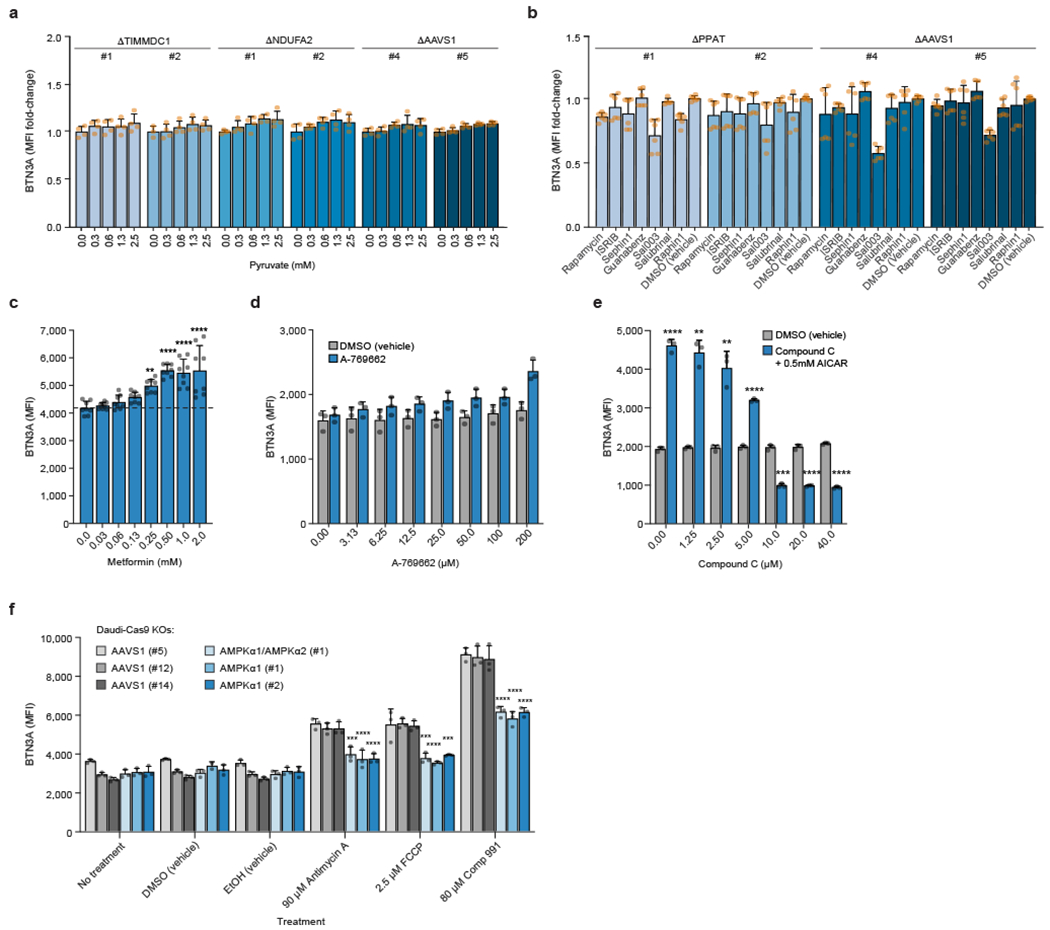
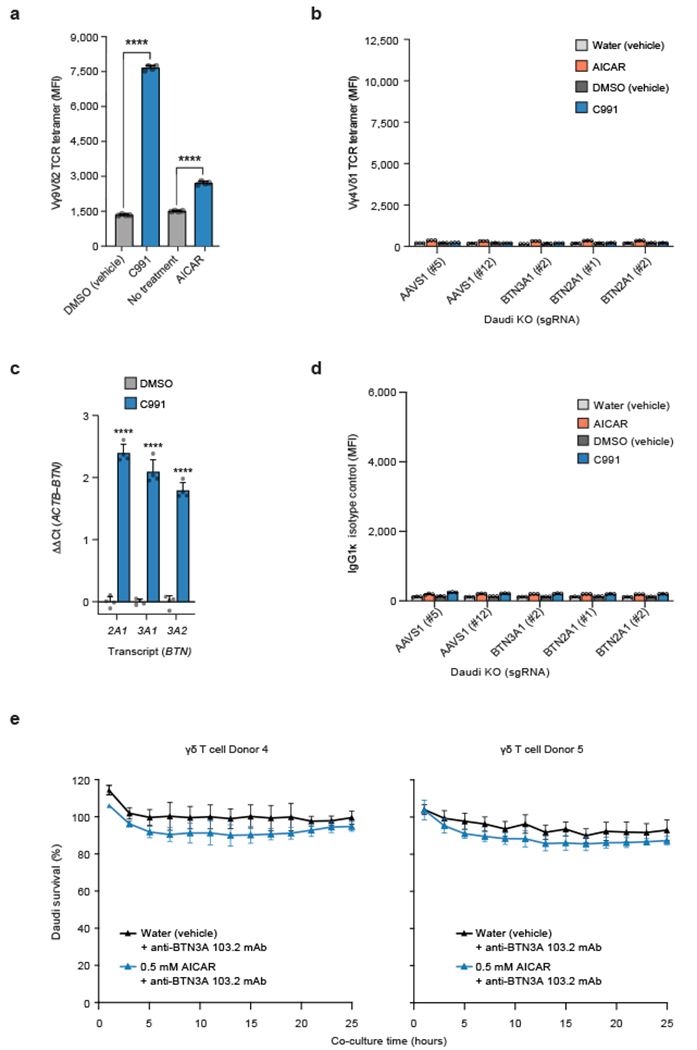
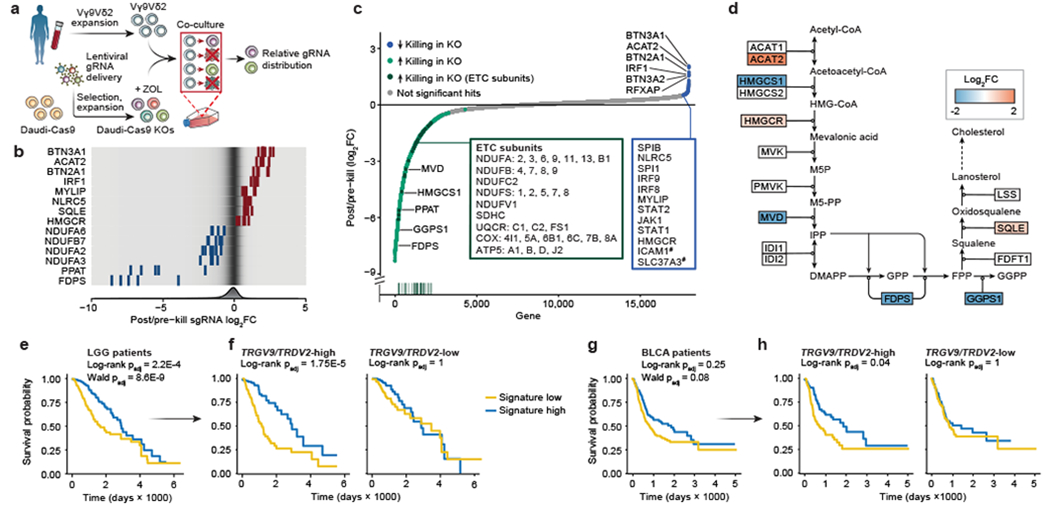
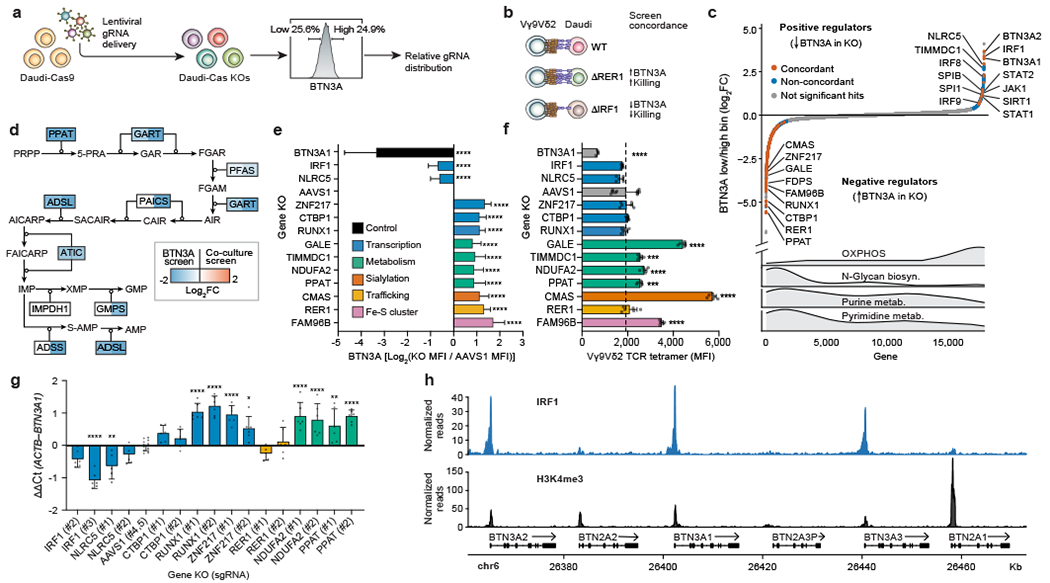
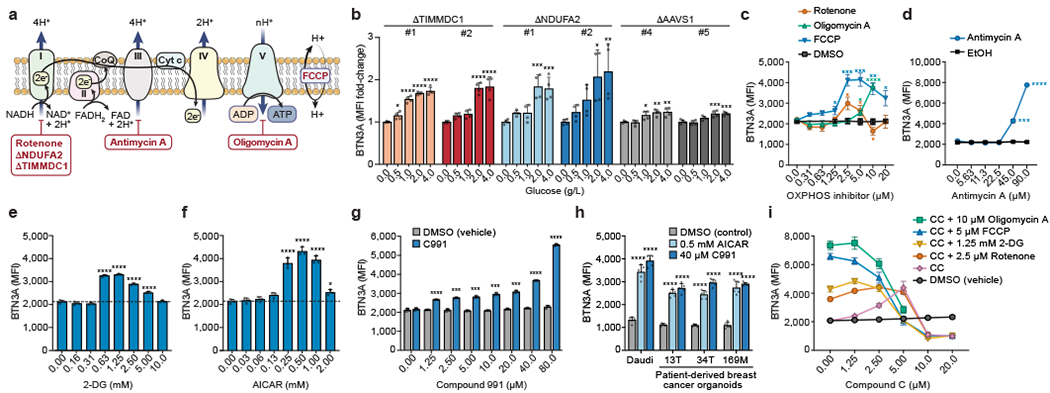
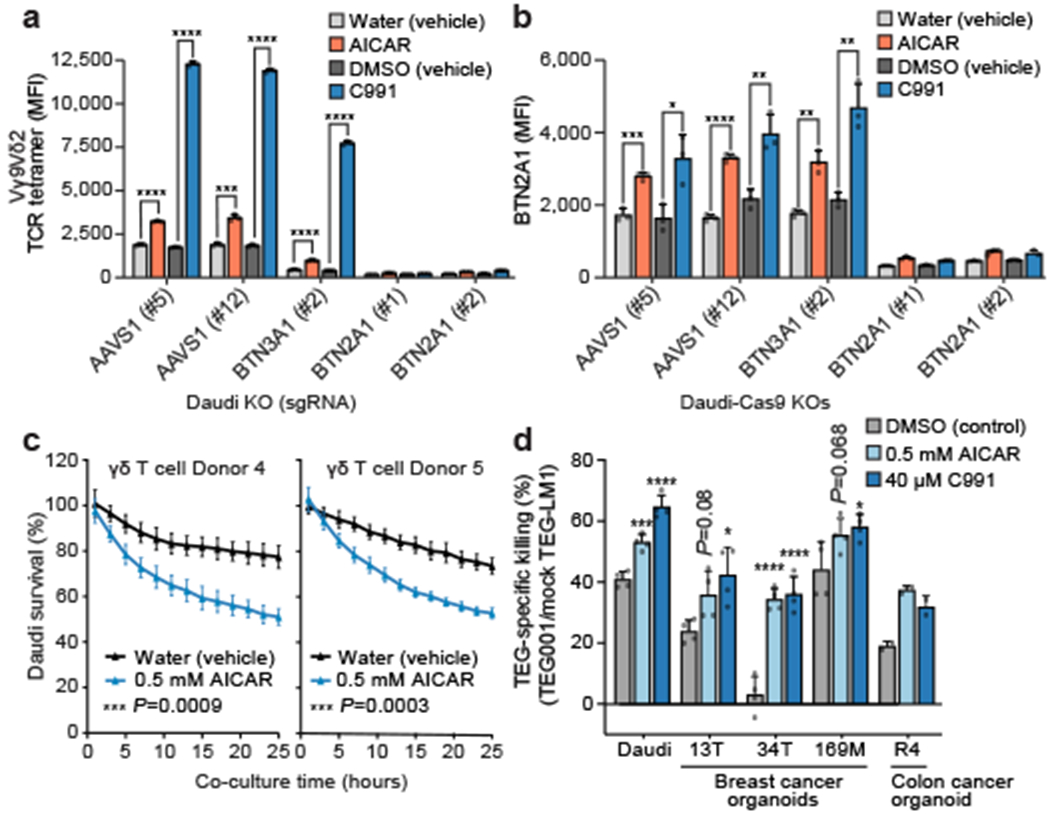
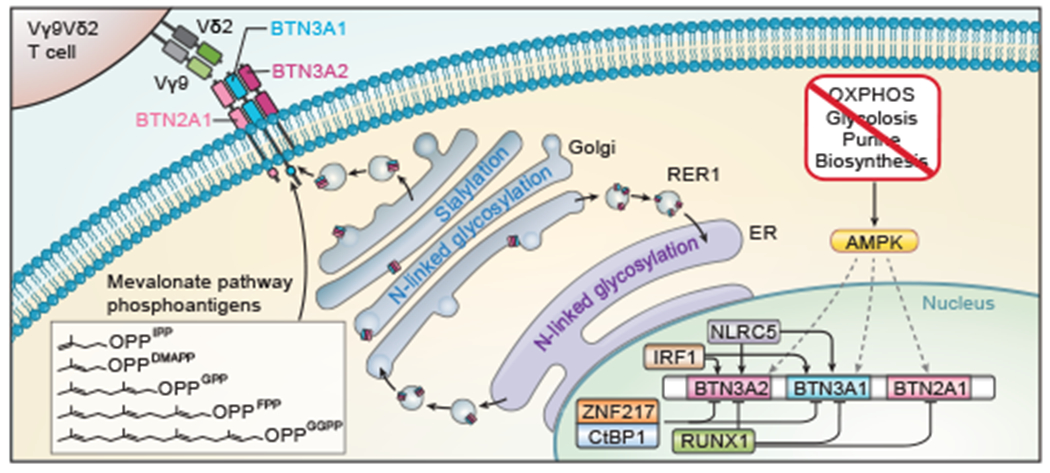
γδ T cells are potent anticancer effectors with the potential to target tumours broadly, independent of patient-specific neoantigens or human leukocyte antigen background1-5. γδ T cells can sense conserved cell stress signals prevalent in transformed cells2,3, although the mechanisms behind the targeting of stressed target cells remain poorly characterized. Vγ9Vδ2 T cells-the most abundant subset of human γδ T cells4-recognize a protein complex containing butyrophilin 2A1 (BTN2A1) and BTN3A1 (refs. 6-8), a widely expressed cell surface protein that is activated by phosphoantigens abundantly produced by tumour cells. Here we combined genome-wide CRISPR screens in target cancer cells to identify pathways that regulate γδ T cell killing and BTN3A cell surface expression. The screens showed previously unappreciated multilayered regulation of BTN3A abundance on the cell surface and triggering of γδ T cells through transcription, post-translational modifications and membrane trafficking. In addition, diverse genetic perturbations and inhibitors disrupting metabolic pathways in the cancer cells, particularly ATP-producing processes, were found to alter BTN3A levels. This induction of both BTN3A and BTN2A1 during metabolic crises is dependent on AMP-activated protein kinase (AMPK). Finally, small-molecule activation of AMPK in a cell line model and in patient-derived tumour organoids led to increased expression of the BTN2A1-BTN3A complex and increased Vγ9Vδ2 T cell receptor-mediated killing. This AMPK-dependent mechanism of metabolic stress-induced ligand upregulation deepens our understanding of γδ T cell stress surveillance and suggests new avenues available to enhance γδ T cell anticancer activity.


Conflict of interest statement

A.M. is a co-founder of Arsenal Biosciences, Spotlight Therapeutics, and Survey Genomics, serves on the boards of directors at Spotlight Therapeutics and Survey Genomics, is a board observer (and former member of the board of directors) at Arsenal Biosciences, is a member of the scientific advisory boards of Arsenal Biosciences, Spotlight Therapeutics, Survey Genomics, NewLimit, Amgen, Lightcast, and Tenaya, owns stock in Arsenal Biosciences, Spotlight Therapeutics, NewLimit, Survey Genomics, PACT Pharma, Lightcast, and Tenaya, and has received fees from Arsenal Biosciences, Spotlight Therapeutics, NewLimit, Survey Genomics, Tenaya, Lightcast, 23andMe, PACT Pharma, Juno Therapeutics, Trizell, Vertex, Merck, Amgen, Genentech, AlphaSights, Rupert Case Management, Bernstein, and ALDA. A.M. is an investor in and informal advisor to Offline Ventures and a client of EPIQ. J.W.F. was a consultant for NewLimit, is an employee of Genentech, and has equity in Roche. The Marson laboratory has received research support from Juno Therapeutics, Epinomics, Sanofi, GlaxoSmithKline, Gilead, and Anthem. J.K. is a shareholder of Gadeta B.V.. J.K. and Z.S. are inventors on patents with γδTCR related topics. A.M. and M.R.M. are inventors on patent applications that have been filed based on the findings described here.

Figures

Extended Data Figure 1.
Extended Data Figure 1.. Mevalonate pathway effects, co-culture screen consistency, and gene set enrichment analysis (GSEA).
(a) Schematic of the mevalonate pathway, adapted from WikiPathways. Phosphoantigens highlighted in blue. (b) Survival of eGFP+ Daudi cells co-cultured with primary Vγ9Vδ2 T cells at different effector-to-target (E:T) ratios with or without zoledronate (ZOL). Cells were quantified using real-time quantitative live-cell imaging (Incucyte). Survival was normalized to Daudi cells cultured without T cells. Mean ± SD. n=3 per condition. (c-e) Pairwise comparisons of log2(fold change [FC]) of screen results among the three healthy human PBMC donors. (f) Number of genes contained within each negatively enriched KEGG gene set after filtering out genes that were not in the screen dataset, FDR q-values, and (g) number of genes found in two KEGG gene sets.
Extended Data Figure 2.
Extended Data Figure 2.. Gene, gene set, and signature TCGA analysis.
(a) Heatmap of the hazard ratios (natural log-transformed) associated with the co-culture screen gene signature in TCGA patients for 33 cancer types (a positive log-ratio indicates a worse prognosis and a negative one indicates a protective effect of the gene signature). The co-culture screen gene signature was scaled to mean=0, SD=1. Values shown only for cancer types with significant survival and signature association in patient tumours, as determined by a Wald test with Benjamini-Hochberg multiple comparisons correction (two-sided padj < 0.05). (b, d) Correlation of tumour gene expression and survival in the low-grade glioma (LGG) patient cohort, (b) with the entire cohort and (d) with the cohort split according to TRGV9/TRDV2 tumour transcript abundance. Patients with high and low expression of every given gene were compared across the 1040 genes in the co-culture screen signature. Positive Wald test Z score indicates a positive correlation with survival, and negative Z score indicates a negative correlation with survival. (c, e) Correlation of KEGG pathway-derived and type I interferon response pathway-derived signature scores and survival in the low-grade glioma (LGG) patient cohort, (c) with the entire cohort and (e) with the cohort split according to TRGV9/TRDV2 tumour transcript abundance. Patients with high and low pathway signature scores were compared. (f, g) Survival of (f) all LGG patients and (g) TRGV9/TRDV2-high or TRGV9/TRDV2-low LGG patients split by high and low expression of the TCA cycle pathway signature. (h, i) Survival of TRAC/TRBC-high/low (h) LGG and (i) BLCA patients split by high and low expression of the co-culture screen gene signature. (b-e) Significance was determined by a Wald test (Cox regression) with Bonferroni multiple comparisons correction (two-sided padj<0.05). (f-i) Log-rank test (Kaplan-Meier survival analysis), adjusted (padj) with Benjamini-Hochberg multiple comparisons correction. (c, e-g) Pathway signature levels were estimated by limiting the comparison to genes that overlapped between the co-culture screen hits signature and the pathway.
Extended Data Figure 3.
Extended Data Figure 3.. Correlation of expression between BTN3A1 and screen hits across thousands of samples.
(a) BTN3A1 expression correlation with gene ontology (GO) pathways across thousands of healthy samples (all tissues combined) collated by Correlation AnalyzeR. To determine pathways that correlate with BTN3A1, genome-wide Pearson correlations for BTN3A1 are used as a ranking metric in the GSEA algorithm, which determines the padj-value. (b) Pairwise correlations between expression of BTN3A1 and shown genes across thousands of healthy samples (all tissues combined) (Correlation AnalyzeR). (c) Each vertical line indicates the correlation between expression of BTN3A1 and one of the genes in the KEGG oxidative phosphorylation (OXPHOS) gene set, overlaid over a density plot of the BTN3A1 pairwise correlations with genes across the entire human genome. Data from healthy immune tissues (Correlation AnalyzeR).
Extended Data Figure 4.
Extended Data Figure 4.. BTN3A expression screen consistency, cross-screen correlation, FDPS validation, and GSEA.
(a-c) Pairwise comparisons of significant (FDR<0.01) and not significant results among the three replicates (Rep) of Daudi-Cas9 cell populations used for the BTN3A expression screen. (d) Correlation of screen effect sizes (LFC) among concordant hits separated into positive and negative regulators of BTN3A surface expression. Linear regression line with a 95% confidence interval is shown. (e) Surface BTN3A staining on live Daudi-Cas9 cells treated for 72 hours with zoledronate (ZOL), an inhibitor of FDPS. n=3 per ZOL dose, representative data from one of three independent experiments. One-way ANOVA comparison to no treatment with Dunnett’s multiple comparisons test. (f) Surface BTN3A staining on live Daudi-Cas9 FDPS KO or control AAVS1 KO cells at indicated days after lentiviral sgRNA transduction. n=4 for each KO. One-way ANOVA comparison to Daudi-Cas9 AAVS1 (#5) KO cells with Dunnett’s multiple comparisons test. (e, f) Mean ± SD. p<0.0001 (****), p<0.001 (***), p<0.01 (**). (g) GSEA of KEGG gene sets that positively or negatively regulate surface BTN3A expression. Number of genes contained within each KEGG gene set after filtering out genes that were not in the screen dataset and FDR q-values are shown.
Extended Data Figure 5.
Extended Data Figure 5.. Pathway Enrichment Visualization.
(a-d) Schematics of the depletion and enrichment of KOs within the (a) oxidative phosphorylation, (b) iron-sulphur (Fe-S) cluster biogenesis, (c) N-glycan biosynthesis, (d) and sialylation pathways across both screens. Shading indicating log2FC shown only for significant hits (FDR<0.05). All pathways were adapted from WikiPathways. (a) OXPHOS subunits are shown with abridged names without accompanying prefixes (C I: NDUF; C II: SDH; C III: UQCR, C IV: COX; C V: ATP5) (e.g., B4 in CI is NDUFB4). Subunits encoded by mitochondrial genes are not included in the visualization.
Extended Data Figure 6.
Extended Data Figure 6.. BTN3A expression screen gene signature.
(a) Heatmap of the hazard ratios (natural log-transformed) associated with the BTN3A screen gene signature in TCGA patients for 33 cancer types (a positive log-ratio indicates a worse prognosis and a negative one indicates a protective effect of the gene signature). The BTN3A screen gene signature was scaled to mean=0, SD=1. Values shown only for cancer types with significant survival and signature association in patient tumours, as determined by a Wald test with Benjamini-Hochberg multiple comparisons correction (two-sided padj < 0.05). (b-d) Survival of (b) total, (c) TRGV9/TRDV2-high/low, or (d) TRAC/TRBC-high/low LGG patients split by high and low expression of the BTN3A expression screen gene signature. Log-rank test (Kaplan-Meier survival analysis) and Wald test (Cox regression), adjusted (padj) with Benjamini-Hochberg multiple comparisons correction.
Extended Data Figure 7.
Extended Data Figure 7.. Effects of screen hit KOs on Vγ9Vδ2 TCR tetramer staining and BTN3A2 and BTN2A1 expression.
(a) Representative histograms of surface BTN3A fluorescence for a subset of single gene Daudi-Cas9 KOs and the AAVS1 control. (b) G115 clone Vγ9Vδ2 TCR tetramer staining fluorescence (MFI) at 14 days after lentiviral sgRNA transduction. Data from one experiment. AAVS1 KO n=12, BTN3A1 KO n=3, all other deletions n=6. (c, d) qPCR data for (c) BTN3A2 and (d) BTN2A1 transcripts normalized to ACTB transcripts. n=5-6 (except RER (#1) KO n=4 for BTN2A1), AAVS1 KO n=12, data combined from two independent experiments. (b-d) One-way ANOVA with Dunnett’s multiple comparisons test. Mean ± SD. p<0.0001 (****), p<0.001 (***), p<0.01 (**), p<0.05 (*).
Extended Data Figure 8.
Extended Data Figure 8.. IRF1 and ZNF217 CUT&RUN, ChIP-Seq, and Vγ9Vδ2 T cell killing.
(a) Publicly available IRF1 ChIP-Seq for the butyrophilin locus in K562 cells stably expressing C-terminal eGFP-tagged IRF1 (ENCODE). (b-d) CUT&RUN data for IRF1 and ZNF217 binding at promoters in (b) BTN3A1, (c) BTN3A2, and (d) BTN3A3 loci in WT Daudi-Cas9 cells. n=3 per condition. The algorithm SEACR calls peaks and verifies them above a stringent background signal threshold. (e) Daudi-Cas9 KO survival after 24-hour co-culture with expanded Vγ9Vδ2 T cells in the presence of ZOL at an E:T ratio of 2:1. For each γδ T cell donor, Daudi survival is calculated relative to Daudi cells cultured without T cells and normalized to the Daudi-Cas9 AAVS1 KO control cell survival. Combined data from three donors and two independent experiments. AAVS1 KO n=6, IRF1 KO n=3. One-way ANOVA comparison to AAVS1 KO cells with Dunnett’s multiple comparisons test. Mean ± SD. p<0.01 (**).
Extended Data Figure 9.
Extended Data Figure 9.. Metabolic effects on surface BTN3A expression.
(a) Surface BTN3A MFI in Daudi-Cas9 KOs cultured in different pyruvate concentrations for 3 days in RPMI (no glucose, no pyruvate). Normalized to cells grown without pyruvate (0 mM). (b-d, f) Surface BTN3A MFI in Daudi-Cas9 cells treated for 72 hours with (b) an mTOR inhibitor (rapamycin), an ISR inhibitor (ISRIB), ISR agonists (guanabenz, Sal003, salubrinal, raphin1, sephin1), and DMSO (vehicle) (KO cells); (c) metformin (WT cells); (d) A-769662 compared to equivalent amounts of DMSO (vehicle) (WT cells); or (f) the shown compounds (KO cells). (e) Surface BTN3A MFI in WT Daudi-Cas9 cells co-treated with AICAR and increasing amounts of Compound C (AMPK inhibitor) or DMSO (vehicle). (a) n=4 per condition (n=3, TIMMDC1 (#2) at 0 mM), data combined from two independent experiments, each individually normalized. (b) n=6 per condition (except n=5 for AAVS1 (#5) with guanabenz and for PPAT (#1) with salubrinal) , data combined from two independent experiments, each individually normalized to DMSO (vehicle)-treated cells. (c) n=8 per condition, data combined from two independent experiments. One-way ANOVA comparison to cells that received no treatment with Dunnett’s multiple comparisons test. (d) n=3 per condition, representative data from one of two independent experiments. (e) n=3 per conditions, representative data from one of two independent experiments. Two-tailed unpaired Student’s t test with Bonferroni correction. (f) n=3 per condition (n=2 for AMPKα1 (#1) treated with DMSO), representative data from one of two independent experiments. One-way ANOVA comparison to AAVS1 (#5) KO cells with Dunnett’s multiple comparisons test. (a-f) Mean ± SD. p<0.0001 (****), p<0.001 (***), p<0.01 (**), p<0.05 (*), p>0.05 (N.S.).
Extended Data Figure 10.
Extended Data Figure 10.. Isotype Control Staining and BTN3A1 blocking.
(a) G115 clone Vγ9Vδ2 TCR tetramer staining MFI of WT Daudi-Cas9 cells treated with 80 μM C991 (DMSO), DMSO (vehicle), 0.5 mM AICAR (aqueous), or without treatment for 72 hours. Two-tailed unpaired Student’s t test. (b) Vγ4Vδ1 TCR (clone DP10.7) tetramer staining fluorescence (MFI) of Daudi-Cas9 KO cells treated with 80 μM C991 (DMSO), DMSO (vehicle), 0.5 mM AICAR (aqueous), or water for 72 hours. This staining with a tetramer of an irrelevant γδTCR clone defines the background for Vγ9Vδ2 TCR tetramer staining in Figure 4a. (c) qPCR data for BTN2A1, BTN3A1, and BTN3A2 transcripts in Daudi-Cas9 cells treated with C991, internally normalized to ACTB transcripts and normalized to DMSO (vehicle)-treated cells. Two-tailed unpaired Student’s t test. (d) IgG1κ isotype control staining in Daudi-Cas9 KO cells treated with 80 μM Compound 991 (DMSO), DMSO (vehicle), 0.5 mM AICAR (aqueous), or water (vehicle) treatment for 72 hours. (e) Survival of eGFP+ Daudi cells treated for 3 days with AICAR or water prior to co-culture (E:T 2:1) with primary Vγ9Vδ2 T cells in the presence of an anti-BTN3A antibody (clone 103.2). Cells were quantified using real-time quantitative live-cell imaging (Incucyte). Survival was normalized to Daudi cells cultured without T cells. (a) n=4 per condition, representative data from one of two independent experiments. (b) n=3 per condition, representative data from one of two independent experiments. (c) n=4 per condition, representative data from one of three independent experiments. (d) n=3, representative data from one of two independent experiments. (e) n=4 per condition. (a-e) Mean ± SD. p<0.0001 (****). Source Data files provided for Figures 2, 3, 4, and Extended Data Figures 1, 4, 7, 8, 9, and 10.
Figure 1.
Figure 1.. Vγ9Vδ2 T cell co-culture with genome-wide KO library of Daudi cells reveals killing-evasion and -enhancement KOs.
(a) Vγ9Vδ2 T cell co-culture screen with a genome-wide KO library of Daudi-Cas9 cells (ZOL = zoledronate). (b) Enrichment or depletion of individual single guide RNAs (sgRNA) for a selection of significant hits, overlaid on a gradient showing distribution of all sgRNAs (fold change [FC]). (c) All 18,010 genes ranked from negative to positive enrichment of Daudi-Cas9 KOs that change killing. Boxes show a subset of significant hits. Vertical line plot shows rank positions of electron transport chain (ETC) subunits listed in the green box. False-discovery rate (FDR) < 0.05, except #FDR<0.1. (d) Schematic of the enrichment and depletion of mevalonate pathway KOs. Shading indicating log2FC shown only for significant hits (FDR<0.05). (e-h) Survival of (e) low grade-glioma (LGG) (n=529) and (g) bladder urothelial carcinoma (BLCA) patients (n=433) split by the co-culture screen gene signature expression levels, (f, h) including after splitting each patient cohort by TRGV9/TRDV2 expression levels. (a-c) n=3 human PBMC donors; enrichment and statistics calculated by the MAGeCK algorithm. (e-h) Log-rank test (Kaplan-Meier survival analysis) and (e, g) Wald test (Cox regression), adjusted (padj) with Benjamini-Hochberg multiple comparisons correction.
Figure 2.
Figure 2.. Systematic discovery of BTN3A surface expression regulators.
(a) Genome-wide KO screen for surface expression of BTN3A. Top and bottom 25% based on BTN3A surface staining were sorted for downstream analysis. (b) Screen concordance with examples of hits concordant between the two screens. (c) All 18,010 genes ranked from negative to positive enrichment of Daudi-Cas9 KOs in BTN3Alow relative to BTN3Ahigh cells. Concordant and non-concordant hits highlighted (BTN3A screen FDR<0.01, co-culture screen FDR<0.05). Distribution of selected KEGG gene sets shown below. (d) Depletion of purine biosynthesis pathway KOs across both screens. Shading indicating log2FC shown only for significant hits (FDR<0.05). (e) Surface BTN3A median fluorescence intensity (MFI) at 13 days post-transduction, normalized to BTN3A MFI in AAVS1 controls and log2-transformed. Two distinct KOs per gene deletion, except BTN3A1 (one KO). Combined data from three separate experiments, each individually normalized. AAVS1 n=36, BTN3A1 n=9, all other deletions n=18. (f) Vγ9Vδ2 TCR tetramer staining fluorescence (MFI) at 13 days post-transduction. Data from one experiment. AAVS1 n=12, BTN3A1 n=3, all other deletions n=6. (g) qPCR data for BTN3A1 transcripts normalized to ACTB transcripts. n=5-6, AAVS1 n=12, data combined from two independent experiments. (h) CUT&RUN data for IRF1 binding and H3K4me3 chromatin modification at the butyrophilin locus. n=3 per condition. (e-g) One-way ANOVA with Dunnett’s multiple comparisons test. Mean ± SD. p<0.0001 (****), p<0.001 (***), p<0.01 (**), p<0.05 (*).
Figure 3.
Figure 3.. Metabolic regulation of BTN3A.
(a) Schematic of OXPHOS, inhibitor targets, and genetic KOs. (b) Surface BTN3A MFI in Daudi-Cas9 KOs cultured in different glucose concentrations for 3 days in RPMI (no glucose, no pyruvate). Normalized to cells grown without glucose (0 g/L). (c, d) Surface BTN3A MFI in WT Daudi-Cas9 cells cultured with vehicles (DMSO, ethanol) or OXPHOS inhibitors of (c) Complex I (rotenone), Complex V (oligomycin A), mitochondrial membrane potential (FCCP), and (d) Complex III (antimycin A) for 72 hours in complete RPMI. (e-g) Surface BTN3A MFI in WT Daudi-Cas9 cells cultured with (e) 2-DG, (f) AICAR, and (g) Compound 991 (C991) or equivalent amount of DMSO (vehicle) for 72 hours in complete RPMI. (h) Surface BTN3A MFI in patient-derived breast cancer organoids and Daudi cells cultured for 3 days with pamidronate and AICAR, C991, or DMSO. (i) Surface BTN3A MFI in WT Daudi-Cas9 cells co-treated with an OXPHOS/glycolysis inhibitor and increasing amounts of Compound C (CC, AMPK inhibitor). (b) n=4 per condition, data combined from two independent experiments, each individually normalized. (c) n=4 per condition, data combined from two independent experiments. (d) n=3 per condition, representative data from one of two experiments. (e, f) n=3 per condition, representative data from one of three independent experiments. (g) n=3 per condition, representative data from one of two independent experiments. (h) n=5, data combined from two independent experiments. (i) n=3 per condition, representative data from one of three independent experiments. (b, e, f, h) One-way ANOVA comparison to the zero or control treatment condition with Dunnett’s multiple comparisons test. (c) Two-tailed unpaired Student’s t test with FDR adjustment for the tested concentrations (1.25-20 μM). (d, g) Two-tailed unpaired Student’s t test with Bonferroni correction. (b-i) Mean ± SD. p<0.0001 (****), p<0.001 (***), p<0.01 (**), p<0.05 (*).
Figure 4.
Figure 4.. Regulation of BTN2A1 and Vγ9Vδ2 TCR-mediated killing of cancer cells.
(a, b) (a) Vγ9Vδ2 TCR tetramer staining MFI and (b) surface BTN2A1 MFI for Daudi-Cas9 KOs treated with 80 μM C991 (DMSO), DMSO (vehicle), 0.5 mM AICAR (aqueous), or water (vehicle) for 72 hours. (c) Survival of eGFP+ Daudi cells treated for 3 days with AICAR or water prior to co-culture (E:T 1:1) with primary Vγ9Vδ2 T cells, normalized to Daudi cells cultured without T cells. Measured by real-time quantitative live-cell imaging. (d) TEG-mediated killing of patient-derived cancer organoids and Daudi cells after 4 days of treatment with 10 μM pamidronate and AICAR, C991, or DMSO. Cancer cells were co-cultured with TEG001 or mock TEG-LM1 and 10 μM pamidronate for 2 days. (a) n=3 per condition, representative data from one of four independent experiments. Two-tailed unpaired Student’s t test. (b) n=3, representative data from one of two independent experiments. Two-tailed unpaired Student’s t test. (c) n=4 per condition, representative data from one of two independent experiments. Repeated measure two-way ANOVA with Geisser-Greenhouse correction. (d) n=4 per condition, data combined from two independent experiments (R4 organoid: n=2 per condition, data from one experiment, no statistical significance tests provided). One-way ANOVA comparison to the DMSO treatment condition with Dunnett’s multiple comparisons test. (a-d) Mean ± SD. p<0.0001 (****), p<0.001 (***), p<0.01 (**), p<0.05 (*).
Figure 5.
Figure 5.. Schematic of the BTN2A1-BTN3A1-BTN3A2 complex regulation.
Model of the butyrophilin complex regulation uncovered in context of known activity by the mevalonate pathway and NLRC5.

Comment in

References

    1. Silva-Santos B, Serre K & Norell H γδ T cells in cancer. Nat. Rev. Immunol 15, 683–691 (2015). - PubMed
    1. Sebestyen Z, Prinz I, Déchanet-Merville J, Silva-Santos B & Kuball J Translating gammadelta (γδ) T cells and their receptors into cancer cell therapies. Nat. Rev. Drug Discov 19, 169–184 (2020). - PubMed
    1. Raverdeau M, Cunningham SP, Harmon C & Lynch L γδ T cells in cancer: a small population of lymphocytes with big implications. Clin. Transl. Immunol 8, e01080 (2019). - PMC - PubMed
    1. Silva-Santos B, Mensurado S & Coffelt SB γδ T cells: pleiotropic immune effectors with therapeutic potential in cancer. Nat. Rev. Cancer 19, 392–404 (2019). - PMC - PubMed
    1. Mensurado S, Blanco-Domínguez R & Silva-Santos B The emerging roles of γδ T cells in cancer immunotherapy. Nat. Rev. Clin. Oncol 20, 178–191 (2023). - PubMed

Methods References

    1. Tzelepis K et al. A CRISPR Dropout Screen Identifies Genetic Vulnerabilities and Therapeutic Targets in Acute Myeloid Leukemia. Cell Rep. 17, 1193–1205 (2016). - PMC - PubMed
    1. Shifrut E et al. Genome-wide CRISPR Screens in Primary Human T Cells Reveal Key Regulators of Immune Function. Cell 175, 1958–1971.e15 (2018). - PMC - PubMed
    1. Li W et al. MAGeCK enables robust identification of essential genes from genome-scale CRISPR/Cas9 knockout screens. Genome Biol. 15, 554 (2014). - PMC - PubMed
    1. Ma Y et al. CRISPR/Cas9 Screens Reveal Epstein-Barr Virus-Transformed B Cell Host Dependency Factors. Cell Host Microbe 21, 580–591.e7 (2017). - PMC - PubMed
    1. Jiang S et al. CRISPR/Cas9-Mediated Genome Editing in Epstein-Barr Virus-Transformed Lymphoblastoid B-Cell Lines. Curr. Protoc. Mol. Biol 121, 31.12.1–31.12.23 (2018). - PubMed

MeSH terms

Substances