. 2023 Sep;621(7979):592-601.
doi: 10.1038/s41586-023-06487-6. Epub 2023 Aug 30.

Neutralization, effector function and immune imprinting of Omicron variants

Amin Addetia #  1 Luca Piccoli #  2 James Brett Case #  3 Young-Jun Park #  1 Martina Beltramello  2 Barbara Guarino  2 Ha Dang  4 Guilherme Dias de Melo  5 Dora Pinto  2 Kaitlin Sprouse  1 Suzanne M Scheaffer  3 Jessica Bassi  2 Chiara Silacci-Fregni  2 Francesco Muoio  2 Marco Dini  2 Lucia Vincenzetti  2 Rima Acosta  4 Daisy Johnson  4 Sambhavi Subramanian  4 Christian Saliba  2 Martina Giurdanella  2 Gloria Lombardo  2 Giada Leoni  2 Katja Culap  2 Carley McAlister  4 Anushka Rajesh  4 Exequiel Dellota Jr  4 Jiayi Zhou  4 Nisar Farhat  4 Dana Bohan  4 Julia Noack  4 Alex Chen  4 Florian A Lempp  4 Joel Quispe  1 Lauriane Kergoat  5 Florence Larrous  5 Elisabetta Cameroni  2 Bradley Whitener  3 Olivier Giannini  6   7 Pietro Cippà  6   7   8 Alessandro Ceschi  6   9   10   11 Paolo Ferrari  6   8   12 Alessandra Franzetti-Pellanda  13 Maira Biggiogero  13 Christian Garzoni  14 Stephanie Zappi  15 Luca Bernasconi  16 Min Jeong Kim  15 Laura E Rosen  4 Gretja Schnell  4 Nadine Czudnochowski  4 Fabio Benigni  2 Nicholas Franko  17 Jennifer K Logue  17 Courtney Yoshiyama  1 Cameron Stewart  1 Helen Chu  17 Hervé Bourhy  5 Michael A Schmid  2 Lisa A Purcell  4 Gyorgy Snell  4 Antonio Lanzavecchia  2 Michael S Diamond  18   19   20   21   22 Davide Corti  23 David Veesler  24   25
Affiliations

Neutralization, effector function and immune imprinting of Omicron variants

Amin Addetia et al. Nature. 2023 Sep.

Abstract

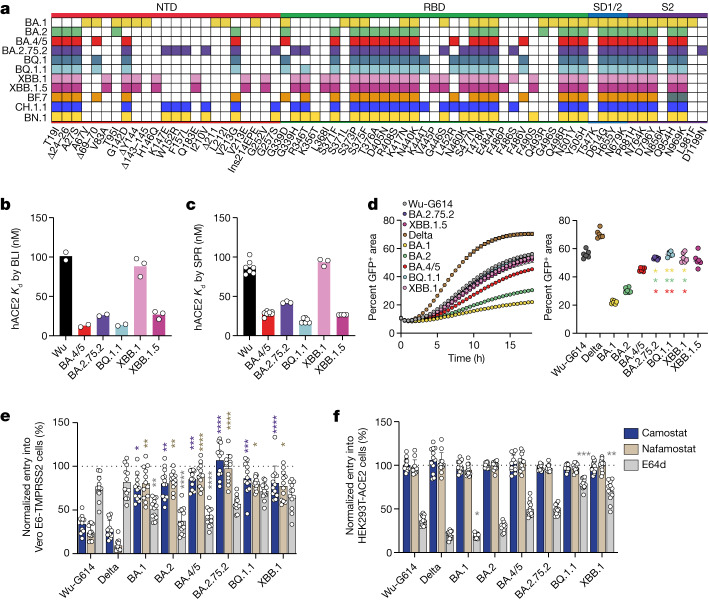
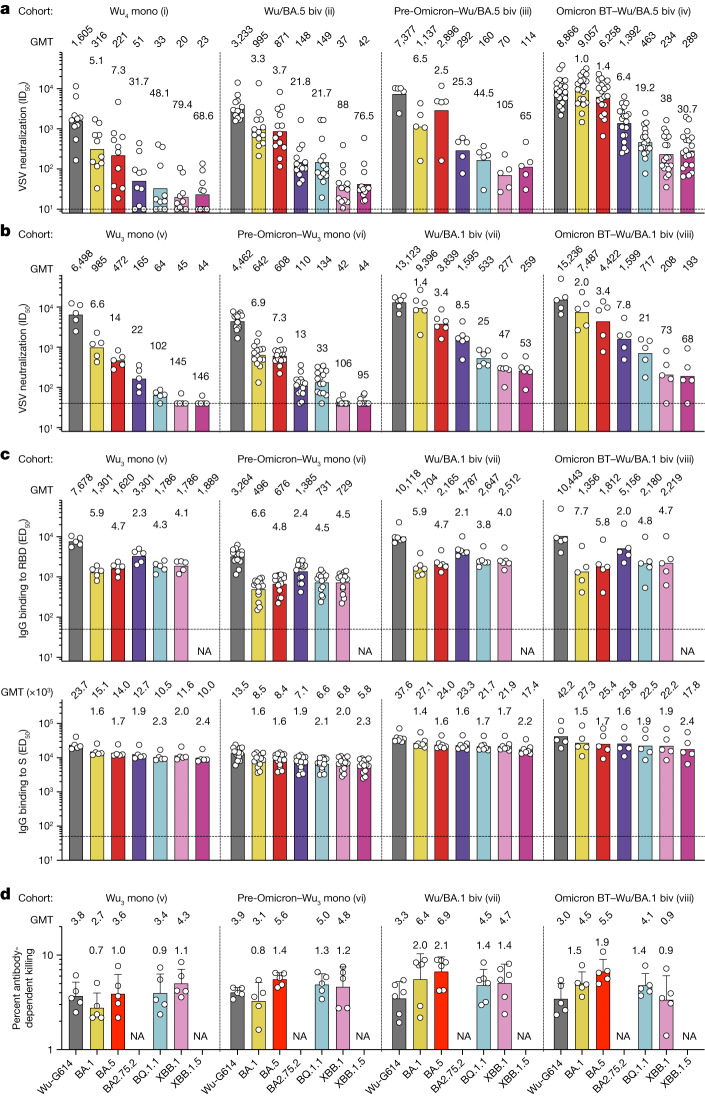
Currently circulating SARS-CoV-2 variants have acquired convergent mutations at hot spots in the receptor-binding domain1 (RBD) of the spike protein. The effects of these mutations on viral infection and transmission and the efficacy of vaccines and therapies remains poorly understood. Here we demonstrate that recently emerged BQ.1.1 and XBB.1.5 variants bind host ACE2 with high affinity and promote membrane fusion more efficiently than earlier Omicron variants. Structures of the BQ.1.1, XBB.1 and BN.1 RBDs bound to the fragment antigen-binding region of the S309 antibody (the parent antibody for sotrovimab) and human ACE2 explain the preservation of antibody binding through conformational selection, altered ACE2 recognition and immune evasion. We show that sotrovimab binds avidly to all Omicron variants, promotes Fc-dependent effector functions and protects mice challenged with BQ.1.1 and hamsters challenged with XBB.1.5. Vaccine-elicited human plasma antibodies cross-react with and trigger effector functions against current Omicron variants, despite a reduced neutralizing activity, suggesting a mechanism of protection against disease, exemplified by S309. Cross-reactive RBD-directed human memory B cells remained dominant even after two exposures to Omicron spikes, underscoring the role of persistent immune imprinting.


Conflict of interest statement

L.P., M. Beltramello, B.G., H.D., J.B., C.S.-F., F.M., M.D., D.P., L.V., C. Saliba, M.G., G. Lombardo, G. Leoni, C.M., E.D., A.R., R.A., D.J., S.S., K.C., E.C., G. Schnell, J.Z., N. Farhat, D.B., J.N., A. Chen, F.A.L., N.C., M.A.S., L.E.R., A.C., L.A.P., G. Saliba, A.L. and D.C. are employees of and may hold shares in Vir Biotechnology. L.A.P. is a former employee and shareholder of Regeneron Pharmaceuticals and is member of the scientific advisory board of AI-driven Structure-enabled Antiviral Platform (ASAP). Regeneron provided no funding for this work. M.S.D. is a consultant for Inbios, Vir Biotechnology, Senda Biosciences, Generate Biomedicines, Moderna and Immunome. D.V. is an inventor on patent applications 14/930,792, PCT/US2019/020029, 63/132,863 and PCT/US2021/017799 held or submitted by the University of Washington related to RBD-based nanoparticle vaccines. The Diamond laboratory has received unrelated funding support in sponsored research agreements from Moderna and Emergent BioSolutions. The remaining authors declare no competing interests.

Figures

Fig. 1
Fig. 1. Functional properties of the BQ.1.1, XBB.1, XBB.1.5 and BA.2.75.2 variant S glycoproteins.
a, Schematic view of S mutations in SARS-CoV-2 variants evaluated in this study. Ins, insertion; SD1/2, subdomains 1 and 2. b,c, Equilibrium dissociation constants (Kd) measured by BLI (b; n = 2 or 3 independent experiments) and SPR (c) for binding of the monomeric human ACE2 (hACE2) ectodomain to the indicated immobilized variant RBDs. d, Left, cell–cell fusion (indicated as the percentage of GFP+ area) between cells expressing the indicated variant S glycoproteins and Vero E6-TMPRSS2 cells measured over an 18-h time-course experiment using a split-GFP system. Right, cell–cell fusion at 18 h (mean ± s.e.m.). Data are from six fields of view from a single experiment and representative of results from two biological replicates. Comparisons of fusogenicity mediated by BA.1, BA.2, or BA.4/5 S to BA.2.75.2, BQ.1.1, XBB.1 and XBB.1.5 S were completed using the one-sided Dunnett’s test; colours of asterisks indicate the reference group for the comparison (BA.1, gold; BA.2, green; BA.4/5, red). e,f, Relative entry of VSV pseudotyped with the indicated S variant in Vero E6-TMPRSS2 (e) or HEK293T-ACE2 (f) cells treated with 50 µM camostat, nafamostat or E64d. Normalized entry was calculated on the basis of entry values obtained for Vero E6-TMPRSS2 or HEK293T-ACE2 cells treated with DMSO only for each pseudovirus. Data are mean ± s.d. Twelve technical replicates were performed for each pseudovirus and inhibitor and one experiment representative of two independent biological replicates is shown. Comparison of relative entry values were made between Wu-G614 S VSV pseudovirus and each of the examined SARS-CoV-2 variant S VSV pseudoviruses using the one-sided Dunnett’s test. *P < 0.05; **P < 0.01; ***P < 0.001; ****P < 0.0001.
Fig. 2
Fig. 2. Structural analysis of BQ.1.1 and XBB.1 RBDs.
a,b, Cryo-EM structures of the BQ.1.1 RBD (a; cyan) or the XBB.1 RBD (b; pink) bound to the human ACE2 ectodomain (green) and the S309 Fab fragment (Vh in purple and Vl in magenta). Amino acid residues mutated relative to Omicron BA.2 are shown as red spheres. c, Zoomed-in view of the BQ.1.1 RBD interactions formed with human ACE2 with select amino acid residue side chains shown as sticks. N-linked glycans are shown as dark blue spheres in ac. d,e, RBD-based superimposition of the LY-CoV1404-bound Wu RBD structure (d; purple, Protein Data Bank (PDB) ID: 7MMO) or of the COV2-2130-bound Wu RBD structure (e; purple, PDB ID: 7L7E) onto the BQ.1.1 RBD cryo-EM structure, highlighting the expected disruptions of electrostatic interactions with the monoclonal antibodies resulting from the K444T and the R346T RBD mutations. f, RBD-based superimpositions of the S309-bound BA.1 S (gold, PDB ID: 7TLY), apo BA.2 S (green, PDB ID: 7UB0), S309- and ACE2-bound BQ.1.1 (cyan) and XBB.1 (pink) RBD cryo-EM structures. The N343 glycan along with select side chains are rendered as sticks. The expected N343 glycan clashes with BA.2 residues N370 and F371 (sticks) are indicated with a red star. Residues 368–373 are disordered in the XBB.1 RBD cryo-EM map, as is the case for the adjacent residues 380–392 and were not modelled. Select electrostatic interactions are highlighted with dotted lines in ce.
Fig. 3
Fig. 3. S309-mediated neutralization, effector functions and in vivo protection.
a, Sotrovimab-mediated neutralization of SARS-CoV-2 variant S VSV pseudoviruses presented as absolute potency (half-maximal inhibitory concentration (IC50)) (left) or relative to neutralization of Wu-D614 S VSV (right). Each symbol represents individual biological replicates (n = 5–20). b, SPR analysis of S309 Fab binding to SARS-CoV-2 RBD variants. Each symbol represents Kd values from independent experiments (n = 3–10). c, Binding of sotrovimab immunoglobulin G (IgG) to cell-surface expressed SARS-CoV-2 S variants. d, Left, natural killer cell-mediated ADCC in the presence of sotrovimab or S309-GRLR. Data are presented as mean area under the curve (AUC) ± s.d. of percentage killing (n = 4–10 donors). Right, ADCP of target cells via CD14+ peripheral blood mononuclear cells in the presence of sotrovimab or S309-GRLR. Data are presented as mean AUC ± s.d. (n = 4–8 donors). e, Correlation of sotrovimab Fab binding affinity (from b) with neutralizing activity (from a) or ADCC (from d). Dotted lines indicate the limit of detection for neutralization and binding affinity or the mean S309-GRLR AUCs for different variants. R2 and P values are derived from two-tailed Pearson correlation. f, Body weight loss (left) and lung viral RNA load (right) on day 6 after infection of K18-hACE2 mice receiving S309, S309-GRLR or 30 mg kg−1 of an isotype-matched control antibody (anti-WVN) one day before challenge. Solid lines represent the median; dotted lines represent the lower limit of quantification; n = 9–20 mice per group. Kruskal–Wallis ANOVA with Dunn’s post-test. g, Body weight (left), viral genomic RNA (middle) and replicating viral titres (right) measured in lungs on day 4 after infection of Syrian hamsters receiving S309 hamster IgG2a or 15 mg kg−1 of an isotype control (IC) monoclonal antibody (MPE8 IgG2a) one day before challenge. n = 6 hamsters per group. Kruskal–Wallis ANOVA with Dunn’s post-test between isotype control and S309. NS, not significant. Source data
Fig. 4
Fig. 4. Neutralization, binding and Fc-dependent effector functions of vaccine- and infection-elicited antibodies against emerging Omicron variants.
a,b, Neutralization of VSV pseudotyped with the indicated SARS-CoV-2 variant S by plasma samples from cohorts i–iv (a) and cohorts v–viii (b). Plasma neutralizing titres are expressed as half-maximal inhibitory dilution (ID50) values from n = 2 biological (a) and technical (b) replicates. Bars and values above graphs represent geometric mean titre (GMT). The fold loss of neutralization against each Omicron variant compared with Wu-G614 is shown above each bar. Horizontal dashed lines indicate the limit of detection (In a, ID50 = 10; in b, ID50 = 40). Cohorts: (i) vaccinated 4 times with the Wu monovalent S mRNA vaccine, with no known infection (Wu4 mono); (ii) vaccinated 3 times with Wu monovalent S mRNA vaccine and then 1 time with Wu/BA.5 bivalent S mRNA vaccine, with no known infection (Wu/BA.5 biv); (iii) infected in 2020 and subsequently vaccinated 3 to 4 times with Wu monovalent S mRNA vaccine and then 1 time with Wu/BA.5 bivalent S mRNA vaccine (pre-Omicron–Wu/BA.5 biv); (iv) vaccinated with Wu monovalent S mRNA vaccine before experiencing a breakthrough infection with Omicron BA.1, BA.2, BA.2.12.1 or BA.5, followed by a vaccination with the Wu/BA.5 bivalent S mRNA vaccine (Omicron BT–Wu/BA.5 biv); (v) vaccinated 3 times with Wu monovalent S mRNA vaccine, with no known infection (Wu3 mono); (vi) vaccinated 3 times with Wu monovalent S mRNA vaccine after pre-Omicron infection (pre-Omicron–Wu3 mono); (vii) vaccinated 3 times with Wu monovalent S mRNA vaccine and then 1 time with Wu/BA.1 bivalent S mRNA vaccine, with no known infection (Wu/BA.1 biv); and (viii) vaccinated 3 times with Wu monovalent S mRNA vaccine and then 1 time with Wu/BA.1 bivalent S mRNA vaccine, with a BA.1 or a BA.2 breakthrough infection (Omicron BT–Wu/BA.1 biv). c, Binding of plasma IgGs to SARS-CoV-2 RBDs and S trimers from indicated variants as measured by ELISA. Bars and values above the graphs represent GMT from n = 2 technical replicates. The fold change of binding titre to the Omicron variant compared with Wu is shown above each bar. Horizontal dashed lines indicate the cut-off in the assay based on binding to uncoated plates (median effective dose (ED50) = 50). d, ADCC as measured by natural killer cell-mediated cell lysis of ExpiCHO-S cells transiently transfected with Wu-D614, BA.5, BQ.1.1 or XBB.1 S and incubated with plasma samples. The percentage of cell lysis is shown for each donor plasma sample diluted 1/200 from cohorts v–viii (n = 5 donors for cohort v, n = 5 for cohort vi, n = 6 for cohort vii and n = 5 for cohort viii). Bars and values above the graphs represent GMT. Error bars show s.d. The fold change of activation with Omicron variants compared with Wu-G614 is shown above each bar. NA, not assayed. Demographics are summarized in Supplementary Table 5. Statistically significant differences of mean neutralization and binding titres within and between cohorts are shown in Supplementary Table 7. Samples from cohorts i–iv were obtained in Seattle, USA; samples from cohorts v–viii were obtained from Ticino, Switzerland.
Fig. 5
Fig. 5. Cross-reactivity of vaccine- and infection-elicited SARS-CoV-2 RBD-binding MBCs.
a,b, Frequency of Wu RBD-binding (grey), Omicron (BA.1, BA.2 and BA.5) RBD pool-binding (red) and cross-reactive (blue) MBCs from donors of cohorts i–iv, as measured by flow cytometry. Data are individual frequencies for each donor (a) and mean frequency ± s.d. for each cohort (n = 4–16 donors) (b). c, Analysis of cross-reactivity with the BQ.1.1 RBD of Omicron (BA.1, BA.2 and BA.5) RBD pool-binding (red bars in b) and Wu/Omicron (BA.1, BA.2 and BA.5) RBD pool-cross-reactive (CR) (blue bars in b) MBCs. Data are mean frequency ± s.d. for each cohort (n = 4–16 donors). d, Cumulative cross-reactivity with the Wu RBD and the Omicron BA.1, BQ.1.1 or XBB.1 RBDs of IgGs secreted from in vitro-stimulated MBCs, as measured by ELISA. Data are mean absorbance values with the blank subtracted from n = 2 replicates of MBC cultures analysed from donors in cohorts vii and viii approximately 3 months after receiving their last vaccine dose. RBD-directed IgGs inhibiting binding of ACE2 to the Wu RBD are depicted in red. The total number (nMBC) and the number of ACE2-inhibiting (ACE2inh) RBD-directed IgG-positive cultures are indicated on top of each graph. Percentages of total (black) and ACE2-inhibiting (red) Wu-binding, Omicron-binding and Wu/Omicron-cross-reactive IgG-positive cultures are indicated within each quadrant. e,f, Individual frequencies (e) and mean (± s.d.) frequencies for each cohort (n = 5–6 donors) (f) of Wu RBD-specific, Omicron-specific and RBD cross-reactive (BA.1, BQ.1.1 and XBB.1) IgG-positive cultures from donors of cohorts vii and viii.
Extended Data Fig. 1
Extended Data Fig. 1. Evaluation of human ACE2 binding to SARS-CoV-2 variant RBDs.
a, Biolayer interferometry binding curves obtained for monomeric human ACE2 binding to biotinylated Wu, BA.4/5, BA.2.75.2, BQ.1.1, XBB.1 or XBB.1.5 RBDs immobilized at the surface of streptavidin biosensors. Kinetic rate constants and affinities are shown in Supplementary Table 1. Fits are shown as solid black lines. b, Sensorgrams of monomeric human ACE2 binding to the Wu, BA.2.75.2, BA.4/5, BQ.1.1, XBB.1, XBB.1.5 and Wu E340A RBDs immobilized at the surface of an SPR chip coated with anti-Avi polyclonal Ab. Experiments were performed with serial dilutions of Fabs and run as single-cycle kinetics. Gray blocks denote the dissociation phase. Fits are shown as dashed grey lines. Kinetic rate constants and affinities are shown in Supplementary Table 2.
Extended Data Fig. 2
Extended Data Fig. 2. CryoEM data processing of the BQ.1.1, XBB.1 and BN.1 RBDs bound to ACE2 and S309.
a-b, Electron micrographs representative of 6,487, 6,355, or 3,822 micrographs, respectively, (a) and 2D class averages (b) of the BQ.1.1 RBD (left), the XBB.1 RBD (middle) or BN.1 RBD (right) bound to the human ACE2 ectodomain and the S309 Fab fragment embedded in vitreous ice. The scale bar represents 100 nm (a) or 100 Å (b). c-d, Gold-standard Fourier shell correlation curves (c) and local resolution maps along with angular distribution heat maps calculated using cryoSPARC (d) for the 3D reconstructions of the BQ.1.1 RBD (left), the XBB.1 RBD (middle) or BN.1 RBD (right) bound to the human ACE2 ectodomain and the S309 Fab fragment. The 0.143 cutoff is indicated by a horizontal dashed line. e, Data processing flowchart. CTF: contrast transfer function; NUR: non-uniform refinement.
Extended Data Fig. 3
Extended Data Fig. 3. Cross-reactivity of S309 with SARS-CoV-2 variant RBDs.
a, Representative sensograms of S309 Fab binding to the SARS-CoV-2 Wu, Wu E340A, Delta, BA.1, BA.2, BA.2.75.2, BA.5, BQ.1, BQ.1.1, CH.1.1, XBB.1, XBB.1.5, BN.1 (deglycosylated or not with PNGase F) and BN.1-T356K RBDs immobilized at the surface of a SPR chip coated with anti-Avi polyclonal Ab. Experiments were performed with serial dilutions of Fabs and were run as single-cycle kinetics. Gray blocks denote the dissociation phase. Fits are shown as dashed grey lines. Kinetic rate constants and affinities are shown in Supplementary Table 4. b, Sotrovimab-mediated neutralization of Wu-D614, BA.2 and BA.2-K356T S VSV pseudoviruses using VeroE6 as target cells. Dose-response curves of one representative experiment out of 2. c, Intact mass-spectrometry analysis of PNGase F-treated BN.1 RBD showing complete removal of N-linked glycans. d, Individual glycan profiling of the three glycosylation sites of the BN.1 RBD (N331, N343, N354) by LC-MS peptide map analysis. nG: no glycan detected.
Extended Data Fig. 4
Extended Data Fig. 4. Sotrovimab promotes Fc-mediated effector functions and protects against viral challenge with the SARS-CoV-2 BQ1.1 and XBB.1.5 variants.
a, Binding of the S2V29 monoclonal Ab to SARS-CoV-2 S variants expressed at the surface of ExpiCHO-S cells as measured by flow cytometry. S2V29 retains potent and equal binding against Wu-D614, BQ.1.1, XBB.1, XBB.1.5, BA.2, BN.1 and BA.2-E340A VSV pseudoviruses and was therefore used for quantifying cell-surface S expression. b, Correlation of sotrovimab Fab binding affinity with ADCP. The ADCP AUC values from Fig. 3d are plotted on the y-axis and the binding affinity to each RBD variant obtained in Fig. 3b is plotted on the x-axis. Dotted lines indicate the limit of detection for binding affinity and the mean of S309-GRLR AUCs from the different variants. c, ExpiCHO cells transiently transfected with S variants were incubated with the indicated concentrations of sotrovimab or S309-GRLR (G236R/L328R loss-of-function mutations introduced in the Fc domain of the human IgG1 heavy chain) and mixed with NK cells isolated from healthy donors in a range from 6:1 to 9:1 (NK:target cells). Target cell lysis was determined by a lactate dehydrogenase release assay. Data are presented as mean values +/– standard deviations (SD) from duplicates obtained using NK cells from two representative donors, both being homozygous for genotype V/V158 FcγRIIIa. d, ExpiCHO cells transiently transfected with S variants were fluorescently labelled with PKH67, incubated with the indicated concentrations of sotrovimab or S309-GRLR mAb and mixed with PBMCs labelled with CellTrace Violet from two healthy donors heterozygous for genotype R/H131 FcγRIIa at a ratio of 20:1 (PBMC:target cells). Association of CD14+ monocytes with S-expressing target cells (ADCP) was determined by flow cytometry. e, Eight-week-old female K18-hACE2 mice received 3, 10 or 30 mg/kg of S309 (parent of sotrovimab) or S309-GRLR or 30 mg/kg of an isotype-matched control monoclonal Ab (anti-West Nile virus hE16) by intraperitoneal injection one day before intranasal inoculation with 104 FFU of SARS-CoV-2 BQ.1.1. n = 9–20 animals per group. Tissues were collected at six days after infection. Lung live virus titer (left panel) and nasal turbinate (center panel) or nasal wash (right panel) viral RNA determined by RT-qPCR on day 6 are plotted (short, solid lines indicate the median; dotted lines indicate the LLOQ; n = 9–20 mice per group; Kruskal-Wallis ANOVA with Dunn’s post-test; ns, not significant; *P < 0.05, **P < 0.01, ***P < 0.001, **** P < 0.0001). f, Serum concentration of S309 hamster IgG2a measured by ELISA at day 4 post-infection. n = 6 hamsters per group.The horizontal bar represents the median.
Extended Data Fig. 5
Extended Data Fig. 5. Sotrovimab neutralization of SARS-CoV-2 Omicron variants.
a, Sotrovimab-mediated neutralization of Wu-D614, BA.2, BA.2.75.2, BQ.1, BQ.1.1, BF.7, XBB.1, BN.1, XBB.1.5. and CH.1.1 S VSV pseudoviruses using VeroE6 as target cells. Dose-response curves displaying the means of triplicates ± SD of one representative experiment out of at least 5 experiments are shown. b, Sotrovimab-mediated neutralization of WA1/2020 (2019-nCoV/USA-WA1/2020), Omicron BA.2 (hCoV-19/USA/MDHP24556/2022) and Omicron XBB.1.5 (hCoV-19/USA/MDHP40900/2022) authentic viruses using VeroE6-TMPRSS2 as target cells. Neutralization data (left panel) represent the means of triplicates ± standard deviation from one representative of n = 10 biologically independent experiments. Shown is also the geometric mean IC50 and average fold-change relative to wild-type of the 10 performed experiments (right panel).
Extended Data Fig. 6
Extended Data Fig. 6. Neutralization, binding and fine specificity of vaccine- and infection-elicited plasma Abs against emerging Omicron variants in dialysis patients, kidney transplant recipients and healthy individuals.
a,b, Neutralization of SARS-CoV-2 pseudotyped VSV carrying Wu-G614, BA.1, BA.5, BA.2.75.2, BQ.1.1, XBB.1 and XBB.1.5 (upper panels) by plasma Abs and binding to matched RBDs by plasma IgGs from dialysis patients (DP) (a) or kidney transplant recipients (KTR) (b) after receiving 4 (Wu4vacc) doses. Samples are compared to those from healthcare workers (HCW) collected 2–4 weeks (a) or 2–4 months (b) after receiving 3 or 4 doses of monovalent Wu vaccine. Shown are ID50 values from n = 2 technical replicates. Bars and values on top represent geometric mean ID50 titers (GMT). Fold-loss of neutralization against Omicron variants as compared to Wu-G614 is shown above each corresponding bar. Horizontal dashed lines indicate the limit of detection in the neutralization assay (ID50 = 40) and the cut-off in the ELISA assay based on binding to uncoated plates (ED50 = 50). Cohort demographics are summarized in Supplementary Table 6. Statistically significant differences of mean neutralization and binding titers within and between cohorts are shown in Supplementary Table 8. c, Competition ELISA (blockade of binding) between individual S site-specific monoclonal Abs and plasma from vaccinated individuals (cohorts v-viii). S2V29 binds to the RBM. Each plot shows the magnitude of inhibition of binding to immobilized Wu-G614, BQ.1.1 and XBB.1 S in the presence of each monoclonal Ab, expressed as reciprocal plasma dilution blocking 80% of the maximum binding response (BD80). Points represent the BD80 measured for each individual plasma donor as determined from n = 1 experiment and bars represent geometric mean BD80 titers.
Extended Data Fig. 7
Extended Data Fig. 7. Activation of FcγRIIIa by individual plasma samples.
a Activation of high-affinity (V158) FcγRIIIa measured using Jurkat reporter cells and SARS-CoV-2 Wu-G614, BA.5, BQ.1.1 and XBB.1 S-expressing ExpiCHO as target cells. Luminescence (RLU) values from one experiment are shown with plasma samples from cohorts v-viii (n = 5 donors for cohort v, n = 5 for cohort vi, n = 6 for cohort vii and n = 5 for cohort viii) and compared to sotrovimab. Horizontal dotted line indicates the lowest limit of detectable activation (RLU = 115,737). b, AUC values from one experiment. Bars and values on top represent geometric mean AUC titers (GMT). Fold-change of activation with Omicron variants as compared to Wu-G614 is shown above each corresponding bar. Horizontal dashed line indicates the lowest limit of detectable activation (AUC = 150). n.a., not assayed.
Extended Data Fig. 8
Extended Data Fig. 8. MBC analysis by flow cytometry.
a, Gating strategy to identify Omicron (BA.1/BA.2/BA.5) RBD pool- and Wu RBD-recognizing MBCs. Dump includes markers for CD3, CD8, CD14, and CD16. Gating for RBD-positive memory B cells was based on staining of PBMCs from healthy donors collected in 2019 prior to the COVID-19 pandemic. Individual plots showing Omicron (BA.1/BA.2/BA.5) RBD pool- and Wu RBD-positive MBCs for Wu4 vaccinated (b), Wu/BA.5 bivalent vaccinated (c), pre-Omicron infected-Wu/BA.5 bivalent vaccinated (d), Omicron BT-Wu/BA.5 bivalent vaccinated (e), Wu/BA.1 bivalent vaccinated (f), and Omicron BT-Wu/BA.1 bivalent vaccinated individuals (g). h, Gating strategy to determine whether Omicron (BA.1, BA.2, and BA.4/5) RBD pool-positive MBCs recognize the BQ.1.1 RBD. Individual plots showing Omicron (BA.1, BA.2, and BA.4/5) RBD pool and BQ.1.1 RBD-recognizing memory B cells for Wu4 vaccinated (i), Wu/BA.5 bivalent vaccinated (j), pre-Omicron infected-Wu/BA.5 bivalent vaccinated (k), Omicron BT-Wu/BA.5 bivalent vaccinated (l), Wu/BA.1 bivalent vaccinated (m), and Omicron BT-Wu/BA.1 bivalent vaccinated individuals (n). Proportion and counts of memory B cells recognizing one or more RBD(s) is presented for each individual.
Extended Data Fig. 9
Extended Data Fig. 9. Subanalysis of cross-reactivity of vaccine- and infection-elicited MBCs.
a,b, Analysis of cross-reactivity with the BQ.1.1 RBD of Omicron (BA.1/BA.2/BA.5) RBD pool-specific (a) and Wu/Omicron (BA.1/BA.2/BA.5) RBD pool-cross-reactive (b) MBCs. Om.pool: MBCs reactive with the Omicron (BA.1/BA.2/BA.5) RBD pool in cohorts i–iv. c, Cumulative cross-reactivity with the Wu RBD and the Omicron BA.1, BQ.1.1 or XBB.1 RBDs of IgGs secreted from in vitro stimulated MBCs as measured by ELISA. Data represent average OD values with blank subtracted from n = 2 replicates of MBC cultures analyzed from donors of cohorts vii and viii at about 14 days after receiving the last vaccine dose. RBD-directed IgGs inhibiting binding of ACE2 to the Wu RBD are depicted in red. Number of total and ACE2-inhibiting (ACE2inh) RBD-directed IgG positive cultures are indicated on top of each graph. Percentages of Wu-specific, Omicron-specific and Wu/Omicron-cross-reactive IgG positive cultures are indicated within each quadrant. d,e, Individual frequencies (d) and mean frequencies ± SD for each cohort (n = 5-6) (e) of Wu RBD-specific (grey), Omicron-specific (red) and RBD cross-reactive (blue for BA.1, yellow for BQ.1.1 and purple for XBB.1) IgG positive cultures from donors of cohorts vii and viii at about 14 days after receiving the last vaccine dose. f,g, Frequency of Wu RBD-specific (grey), Omicron (BA.1/BA.2/BA.5) RBD pool-specific (red) and cross-reactive (blue) MBCs from donors of cohorts vii-viii at about 14 days after receiving the last vaccine dose, as measured by flow cytometry. Individual frequencies are shown in panels f and and mean frequencies ± SD for each cohort (n = 4–16) are shown in g. h, Analysis of cross-reactivity with the BQ.1.1 RBD of Omicron (BA.1/BA.2/BA.5) RBD pool-specific (red bars of panel g) and Wu/Omicron (BA.1/BA.2/BA.5) RBD pool-cross-reactive (blue bars of panel g) MBCs. Om.pool, MBCs recognizing the Omicron (BA.1/BA.2/BA.5) RBD pool. Mean frequencies ± SD are presented for each cohort (n = 5-6). i,j, Frequency of IgGs specific for the Wu RBD (grey), cross-reactive with the Wu/BA.5 RBDs (blue), the Wu/BQ.1.1 RBDs (orange), the Wu/XBB.1 RBDs (purple) or specific for either the BA.5, BQ.1.1 or XBB.1 RBD (red) as measured by ELISA after in vitro stimulation of MBCs from cohorts i–iv. Individual frequencies and mean ± SD (n = 4–16) are shown in panels i and j, respectively.

References

    1. Cao Y, et al. Imprinted SARS-CoV-2 humoral immunity induces convergent Omicron RBD evolution. Nature. 2022 doi: 10.1038/s41586-022-05644-7. - DOI - PMC - PubMed
    1. Viana R, et al. Rapid epidemic expansion of the SARS-CoV-2 Omicron variant in southern Africa. Nature. 2022 doi: 10.1038/d41586-021-03832-5. - DOI - PMC - PubMed
    1. Bowen, J. E. et al. Omicron spike function and neutralizing activity elicited by a comprehensive panel of vaccines. Science307, 890–894 (2022). - PMC - PubMed
    1. Cameroni E, et al. Broadly neutralizing antibodies overcome SARS-CoV-2 Omicron antigenic shift. Nature. 2022;602:664–670. doi: 10.1038/s41586-021-04386-2. - DOI - PMC - PubMed
    1. McCallum, M. et al. Structural basis of SARS-CoV-2 Omicron immune evasion and receptor engagement. Science375, 864–868 (2022). - PMC - PubMed

Publication types

MeSH terms

Supplementary concepts