. 2023 Sep;621(7977):206-214.
doi: 10.1038/s41586-023-06470-1. Epub 2023 Aug 30.

A pentameric TRPV3 channel with a dilated pore

Affiliations

A pentameric TRPV3 channel with a dilated pore

Shifra Lansky et al. Nature. 2023 Sep.

Abstract

Transient receptor potential (TRP) channels are a large, eukaryotic ion channel superfamily that control diverse physiological functions, and therefore are attractive drug targets1-5. More than 210 structures from more than 20 different TRP channels have been determined, and all are tetramers4. Despite this wealth of structures, many aspects concerning TRPV channels remain poorly understood, including the pore-dilation phenomenon, whereby prolonged activation leads to increased conductance, permeability to large ions and loss of rectification6,7. Here, we used high-speed atomic force microscopy (HS-AFM) to analyse membrane-embedded TRPV3 at the single-molecule level and discovered a pentameric state. HS-AFM dynamic imaging revealed transience and reversibility of the pentamer in dynamic equilibrium with the canonical tetramer through membrane diffusive protomer exchange. The pentamer population increased upon diphenylboronic anhydride (DPBA) addition, an agonist that has been shown to induce TRPV3 pore dilation. On the basis of these findings, we designed a protein production and data analysis pipeline that resulted in a cryogenic-electron microscopy structure of the TRPV3 pentamer, showing an enlarged pore compared to the tetramer. The slow kinetics to enter and exit the pentameric state, the increased pentamer formation upon DPBA addition and the enlarged pore indicate that the pentamer represents the structural correlate of pore dilation. We thus show membrane diffusive protomer exchange as an additional mechanism for structural changes and conformational variability. Overall, we provide structural evidence for a non-canonical pentameric TRP-channel assembly, laying the foundation for new directions in TRP channel research.


Conflict of interest statement

Competing interests

There are no competing financial interests.

Figures
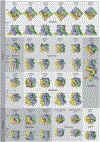
Extended Data Figure 1 |
Extended Data Figure 1 |. TRP-channel structures.
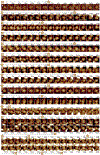
Representative structures (out of >210 structures) of the 22 TRP-channels solved so far. All structures are tetramers, with the four subunits colored in wheat, green, purple and yellow. Each structure is depicted in surface representation, shown from the intracellular (top) and side (bottom) views. The question mark in the crTRP1 panel signifies that the subfamily to which crTRP1 belongs is yet unknown.
Extended Data Figure 2 |
Extended Data Figure 2 |. Single-channel recordings of TRPV3.
(a) and (b) Representative single-channel recordings of TRPV3 in the absence (a) and presence (b) of 100 μM DPBA, at −50 and 50 mV. (c) Since-channel current-voltage (IV) curves of TRPV3 obtained from −100 to 100 mV, in the absence and presence of 100 μM DPBA. (d) Single-channel open probabilities determined from recordings obtained at −50 mV, in the absence and presence of 100 μM DPBA. Open probability values (0.27 ± 0.01 and 0.78 ± 0.05 respectively) were derived as the mean values +/− SEM from n ≥ 3 independent experiments (circles). Statistical significance was assessed with the one-tailed Welch’s T-test, yielding a significant (p-value = 0.0007) increase in open channel probability following DPBA addition. All recordings were performed on TRPV3 channels from one purification following the same protein expression and purification protocol as for the cryo-EM analysis and reconstituted following the same protocol as for the HS-AFM analysis though at higher lipid-to-protein ratio (LPR between 5 and 20 for electrophysiology recordings vs. LPR between 0.5 and 2.5 for HS-AFM experiments). *** p-value <0.005.
Extended Data Figure 3 |
Extended Data Figure 3 |. The TRPV3 tetramer and pentamer are reversible.
(a) to (f) Tetramer to pentamer transitions. (g) to (k) Pentamer to tetramer transitions. (l) TRPV3 tetramer-pentamer-tetramer transition. (m) TRPV3 pentamer-tetramer-pentamer-tetramer-pentamer-tetramer transition. White arrowheads indicate the occasionally observed monomers ‘attacking’ and inserting into tetramers to yield pentamers, and the observed monomers dissociating from pentamers to yield tetramers.
Extended Data Figure 4 |
Extended Data Figure 4 |. TRPV3 tetramers can breakup into fragments and reform.
(a) TRPV3 tetramers and pentamers coexist alongside TRPV3 ≤ 3 protomer fragments. Grey arrowheads indicate monomer (1), dimer (2), and trimer (3) fragments. (b) and (c) TRPV3 tetramer breakups into trimer and dimer. (d) TRPV3 fragments form a stable tetramer, which then breaks apart.
Extended Data Figure 5 |
Extended Data Figure 5 |. Workflow for cryo-EM reconstruction of the TRPV3 tetramer and pentamer.
Flowchart for the cryo-EM data processing, particle picking, classification, and reconstruction, enabling map reconstruction of the tetramer at 2.55Å resolution and for the pentamer at 4.38Å resolution. Unless otherwise stated, all processing steps were conducted in cryoSPARC version 3.3.2. Dashed lines indicate the inputs used for the iterative cycles of heterogenous refinement.
Extended Data Figure 6 |
Extended Data Figure 6 |. Cryo-EM density maps of the TRPV3 tetramer and pentamer.
(a) and (b) Cryo-EM reconstructed maps of the TRPV3 tetramer (a) and pentamer (b), colored according to local resolution using a rainbow color scale. (c) and (d) Representative cryo-EM densities of the tetramer (contour level at 5.5 RMSD) (c) and pentamer (contour level at 4.16 RMSD) (d), at 2.55Å and 4.38Å resolution, respectively (the TMDs in the pentamer map are of ~5.0–5.5 Å resolution, see local resolution color scheme in (b))
Extended Data Figure 7 |
Extended Data Figure 7 |. Structural comparison of the TRPV3 tetramer and pentamer cryo-EM structures.
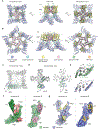
(a) and (b) TRPV3 tetramer (a) and pentamer (b) structures, colored according to domains: ARD in purple, VSLD in yellow, PD in pink, SF in green, TRP helix in wheat, coupling domain in light blue. (c) to (e) Superposition of a pentamer subunit (purple) onto the tetramer subunit (green), aligned with respect to the PD, indicating a hinge-motion in the pentamer monomer by 18°, as manifested by rotation of the ARD (c), VSLD, and TRP helix (d). This hinge-motion enables preservation of the inter-subunit interactions of S5 with S1 and S4, and the SF-SF and S6-S6 interactions (e). Neighboring subunits in gray. Open book graphics of the tetramer (f, green) and pentamer (g, purple) inter-subunit contact areas. Contact areas are colored in pink (in the tetramer) and yellow (in the pentamer).
Extended Data Figure 8 |
Extended Data Figure 8 |. Model of the reversible transition between the tetrameric and pentameric TRPV3 states.
TRPV3 tetramers may dissociate. Dissociation is favored by activation, due to destabilization of the inter-protomer interaction, notably the VSLD-PD domain-swap interface, by helix-intercalating molecules (e.g., capsaicin or LPA in TRPV1, DPBA in TRPV3, temperature). Monomers may ‘attack’ and insert into tetramers to yield pentamers with an estimated ~2.4-fold enlarged pore diameter at the SF. Pentamers, lifetime of ~3 minutes, are however less stable than tetramers, due to more fragile VSLD-PD interfaces and shed subunits to regain the tetrameric state (figure created with BioRender).
Extended Data Figure 9 |
Extended Data Figure 9 |. Simulation of oligomeric state transitions.
(a) Visualization of simulated traces. Each column represents an independent space that can be either empty (0) or occupied by a molecule with a specific oligomeric state (1, 2, 3, 4 or 5). Total space: 5250. Total time step: 2000. Initial setup (time step = 1): 5000 out of 5250 spaces had a value of 4 (tetramers) and 250 out of the 5250 spaces had a value of 0 (empty). (b) and (c) Close-up views of the simulated traces in (a) as indicated by the dashed boxes. 1: Empty → monomer → dimer → trimer → tetramer → pentamer transition. 2: Transitions between tetramer and pentamer states (with short pentamer dwell-times). 3: A long pentamer state event. 4: pentamer → tetramer → trimer → dimer → monomer → empty transition. (d) Time-evolution of oligomer counts. Top panel: Tetramers. Middle panel: Pentamers and lower oligomers (trimer, dimer, and monomer) aggregated. Bottom panel: Trimers, dimers and monomers. (e) Oligomer state dwell-times. Left to right: Lower oligomers (n = 34984), tetramer (n = 278141), and pentamer (n = 331579).
Figure 1 |
Figure 1 |. Membrane reconstitution of TRPV3.
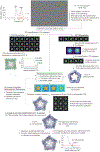
(a) TRPV3 subunit architecture, with ankyrin repeat domain (ARD, purple), linker domain and pre-S1 (blue), voltage sensor like domain (VSLD, S1-S4, yellow), pore domain (S5-SF-S6, pink-green-pink), TRP-helix (wheat), and C-terminal domain (CTD, blue). (b) Sequence representation, color-coded as in (a). (c) Intracellular (top) and side (bottom) views of the human TRPV3 tetramer structure (PDB 6uw4), the four subunits are color coded. The VSLD is domain-swapped with respect to the PD, e.g., the VSLD of the purple subunit interacts with the pore domain of the yellow subunit. (d) Representative negative-stain EM images of TRPV3 reconstitutions in yeast polar lipid and POPC:DOPS:cholesterol (8:1:1, w:w:w) membranes. Similar reconstitutions and EM images were reproduced >20 times. (e) Overview HS-AFM video frames of TRPV3 reconstitutions. (f) Height distribution analysis of dashed outline in (e, top left), colored according to the height false-color scale. (g) Cross-section analysis along dashed lines in (e, bottom right).
Figure 2 |
Figure 2 |. TRPV3 pentamers coexist with canonical TRPV3 tetramers in membranes.
(a) Medium-resolution HS-AFM videos frames (Supplementary Videos 5–9) of TRPV3 in membranes revealed several channels with pentameric oligomeric state (arrowheads). (b) High-resolution HS-AFM video frames (Supplementary Videos 10–15) of tetrameric and pentameric TRPV3 channels. (c) Radial profiles of TRPV3 tetramer (green) and pentamer (purple) individual molecules (from (b), panel 2). The black lines represent sine fits with 90° and 72° peak periodicity, respectively. (d) Height profiles of tetramer (green) and pentamer (purple) correlation averages (from (b), panel 2) along green and purple lines in the insets, respectively. (e) Protrusion height analysis: Histograms of height distributions of TRPV3 tetramer (middle, green) and pentamer (right, purple) relative to the lipid bilayer. Left: Dashed outlines of central regions of tetramer, pentamer and lipid bilayer area (8.5nm diameter) from which the height values were extracted (from (b), panel 4) from 100,734 pixels (489 pixels in 206 frames).
Figure 3 |
Figure 3 |. TRPV3 tetramer–pentamer and pentamer–tetramer transitions, and observations of complete reversibility between the tetramer and pentamer state.
(a) and (b) TRPV3 tetramer–pentamer transitions. (c) and (d) TRPV3 pentamer–tetramer transitions. (e) TRPV3 tetramer–pentamer–tetramer transition. (f) TRPV3 pentamer–tetramer–pentamer transition. White arrowheads indicate monomers ‘attacking’ and inserting tetramers and dissociating from pentamers, respectively. (g) Number and type of observed (grey areas indicate observation window) transitions. From top to bottom: Pentamer state observations that were open ended, pentamer observations that had no beginning nor end, pentamers that were observed transforming into tetramers, and observations that comprised the beginning and the end, i.e., full lifetime, of the pentamer state (complete tetramer–pentamer–tetramer transitions). (h) Dwell-times of pentamer states that were observed transforming into tetramers (n = 17). The histogram was fit with an exponential decay, τ = 192 s, adj. R2 = 0.77. (i) Dwell-times of pentamer states that had no beginning nor end (n = 65). Average dwell-time < τ > = 172 s.
Figure 4 |
Figure 4 |. DPBA leads to an increase of TRPV3 pentamers.
(a) HS-AFM videos frames of membrane-embedded TRPV3 in the presence of 320 μM DPBA. Among many tetramers, TRPV3 pentamers (white arrowheads) and fragments (grey arrowheads; 1-monomer, 2-dimer, 3-trimer) were observed. (b) Statistics of tetramer and pentamer populations (left), and tetramer, pentamer, and fragment populations (right), in the absence (dark brown) and presence (light brown) of 320 μM DPBA. Data are presented as mean values +/− SEM of the population percentages derived from n = 3 biologically independent samples (circles). Statistical significance was assessed with the one-tailed two proportion Z-test, yielding in all cases absolute Z-values > 4.9, corresponding to p-values < 0.0001. (c) Thermal denaturation profiles of TRPV3 (raw data (top) and 1st derivative (bottom; squares indicate f ‘= 0 (traces are vertically shifted for clarity) Tm1 (downwards arrowheads) and Tm2 (upwards arrowheads)) in the absence (black) and presence of 32 μM (n = 6 biologically independent experiments), 100 μM (n = 6), 320 μM (n = 7), and 1000 μM DPBA (n = 6), colored with increasingly lighter shades of brown, indicate a (d) significant reduction of Tm1 and Tm2 following the addition of 320 μM and 1000 μM DPBA. Tm values are presented as mean values +/− SEM of the Tm results (circles) obtained from n = 6 or 7 biologically independent experiments. Statistical significance was assessed with the one-tailed Welch’s T-test, yielding a significant reduction (99% confidence level) in both Tm1 and Tm2 following addition of 320 μM DPBA (p-value = 0.000038 and 0.0019, respectively), and a further significant reduction in Tm1 and Tm2 following addition of 1000 μM DPBA (p-value = 0.015 (95% confidence level) and 0.0043 (99% confidence level). **p-value <0.025; ***p-value <0.005.
Figure 5 |
Figure 5 |. Cryo-EM structures of the TRPV3 channel tetramer and pentamer.
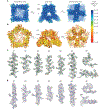
(a) Cryo-EM map of the TRPV3 tetramer, determined to 2.6 Å resolution. The four protein subunits are colored in wheat, purple, yellow, and green, and the lipid densities are colored in pink. (b) A representative cryo-EM micrograph (out of 10,118 similar micrographs), showing that a small percentage of molecules in the raw data have (c) clear pentameric architecture (only pentamer top views are identifiable to the eye). (d) Representative 2D class averages of the TRPV3 pentamer in different orientations. (e) Cryo-EM map of the TRPV3 pentamer, determined to 4.4 Å resolution. The five protein subunits are colored in wheat, purple, yellow, pink, and green. (f) Pore profile of the tetramer structure, (g) pore profile of a previously determined tetramer open conformation TRPV3 mutant (K169A) (PDB 6UW6), and (h) pore profile of the TRPV3 pentamer. All pore profiles were calculated by considering only the backbone.

References

    1. Peng G, Shi X & Kadowaki T Evolution of TRP channels inferred by their classification in diverse animal species. Mol. Phylogenet. Evol 84, 145–157 (2015). - PubMed
    1. Himmel NJ & Cox DN Transient receptor potential channels: current perspectives on evolution. Proc. R. Soc. B Biol. Sci 287, 1–9 (2020). - PMC - PubMed
    1. Khalil M et al. Functional role of transient receptor potential channels in immune cells and epithelia. Front. Immunol 9, 1–7 (2018). - PMC - PubMed
    1. Huffer KE, Aleksandrova AA, Jara-Oseguera A, Forrest LR & Swartz KJ Global alignment and assessment of trp channel transmembrane domain structures to explore functional mechanisms. Elife 9, 1–33 (2020). - PMC - PubMed
    1. Moran MM TRP Channels as Potential Drug Targets. Annu. Rev. Pharmacol. Toxicol 58, 309–330 (2018). - PubMed

Publication types

MeSH terms