. 2023 Sep;621(7977):179-187.
doi: 10.1038/s41586-023-06483-w. Epub 2023 Aug 30.

Metabolic programs of T cell tissue residency empower tumour immunity

Affiliations

Metabolic programs of T cell tissue residency empower tumour immunity

Miguel Reina-Campos et al. Nature. 2023 Sep.

Abstract

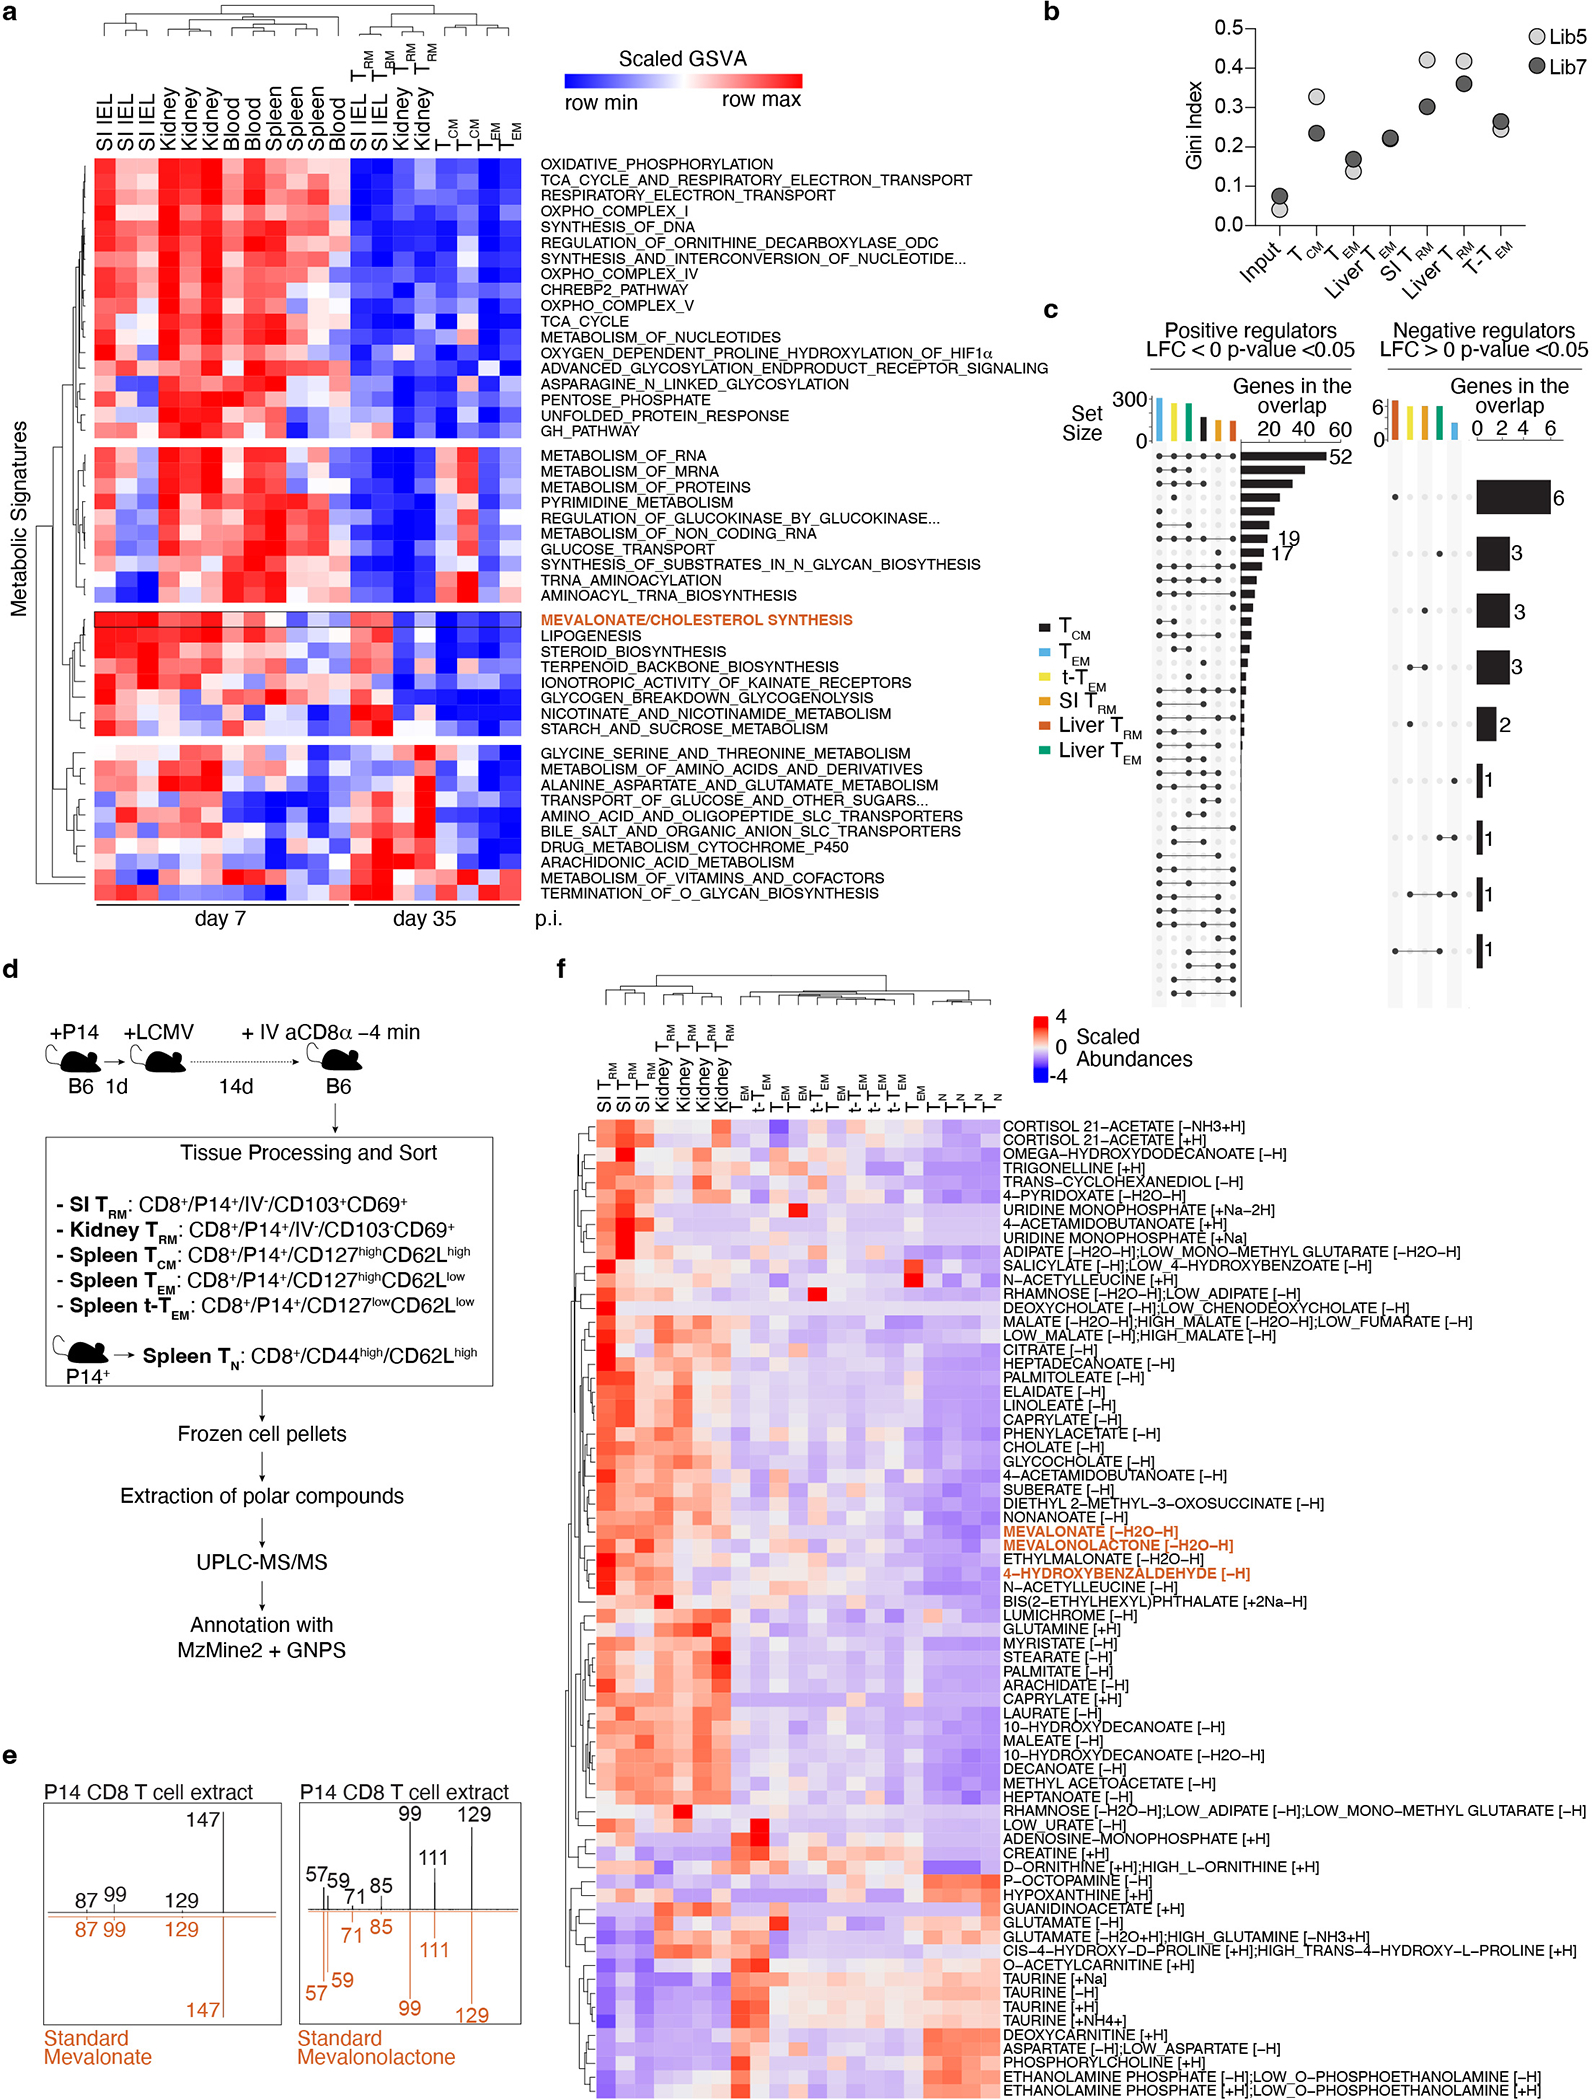
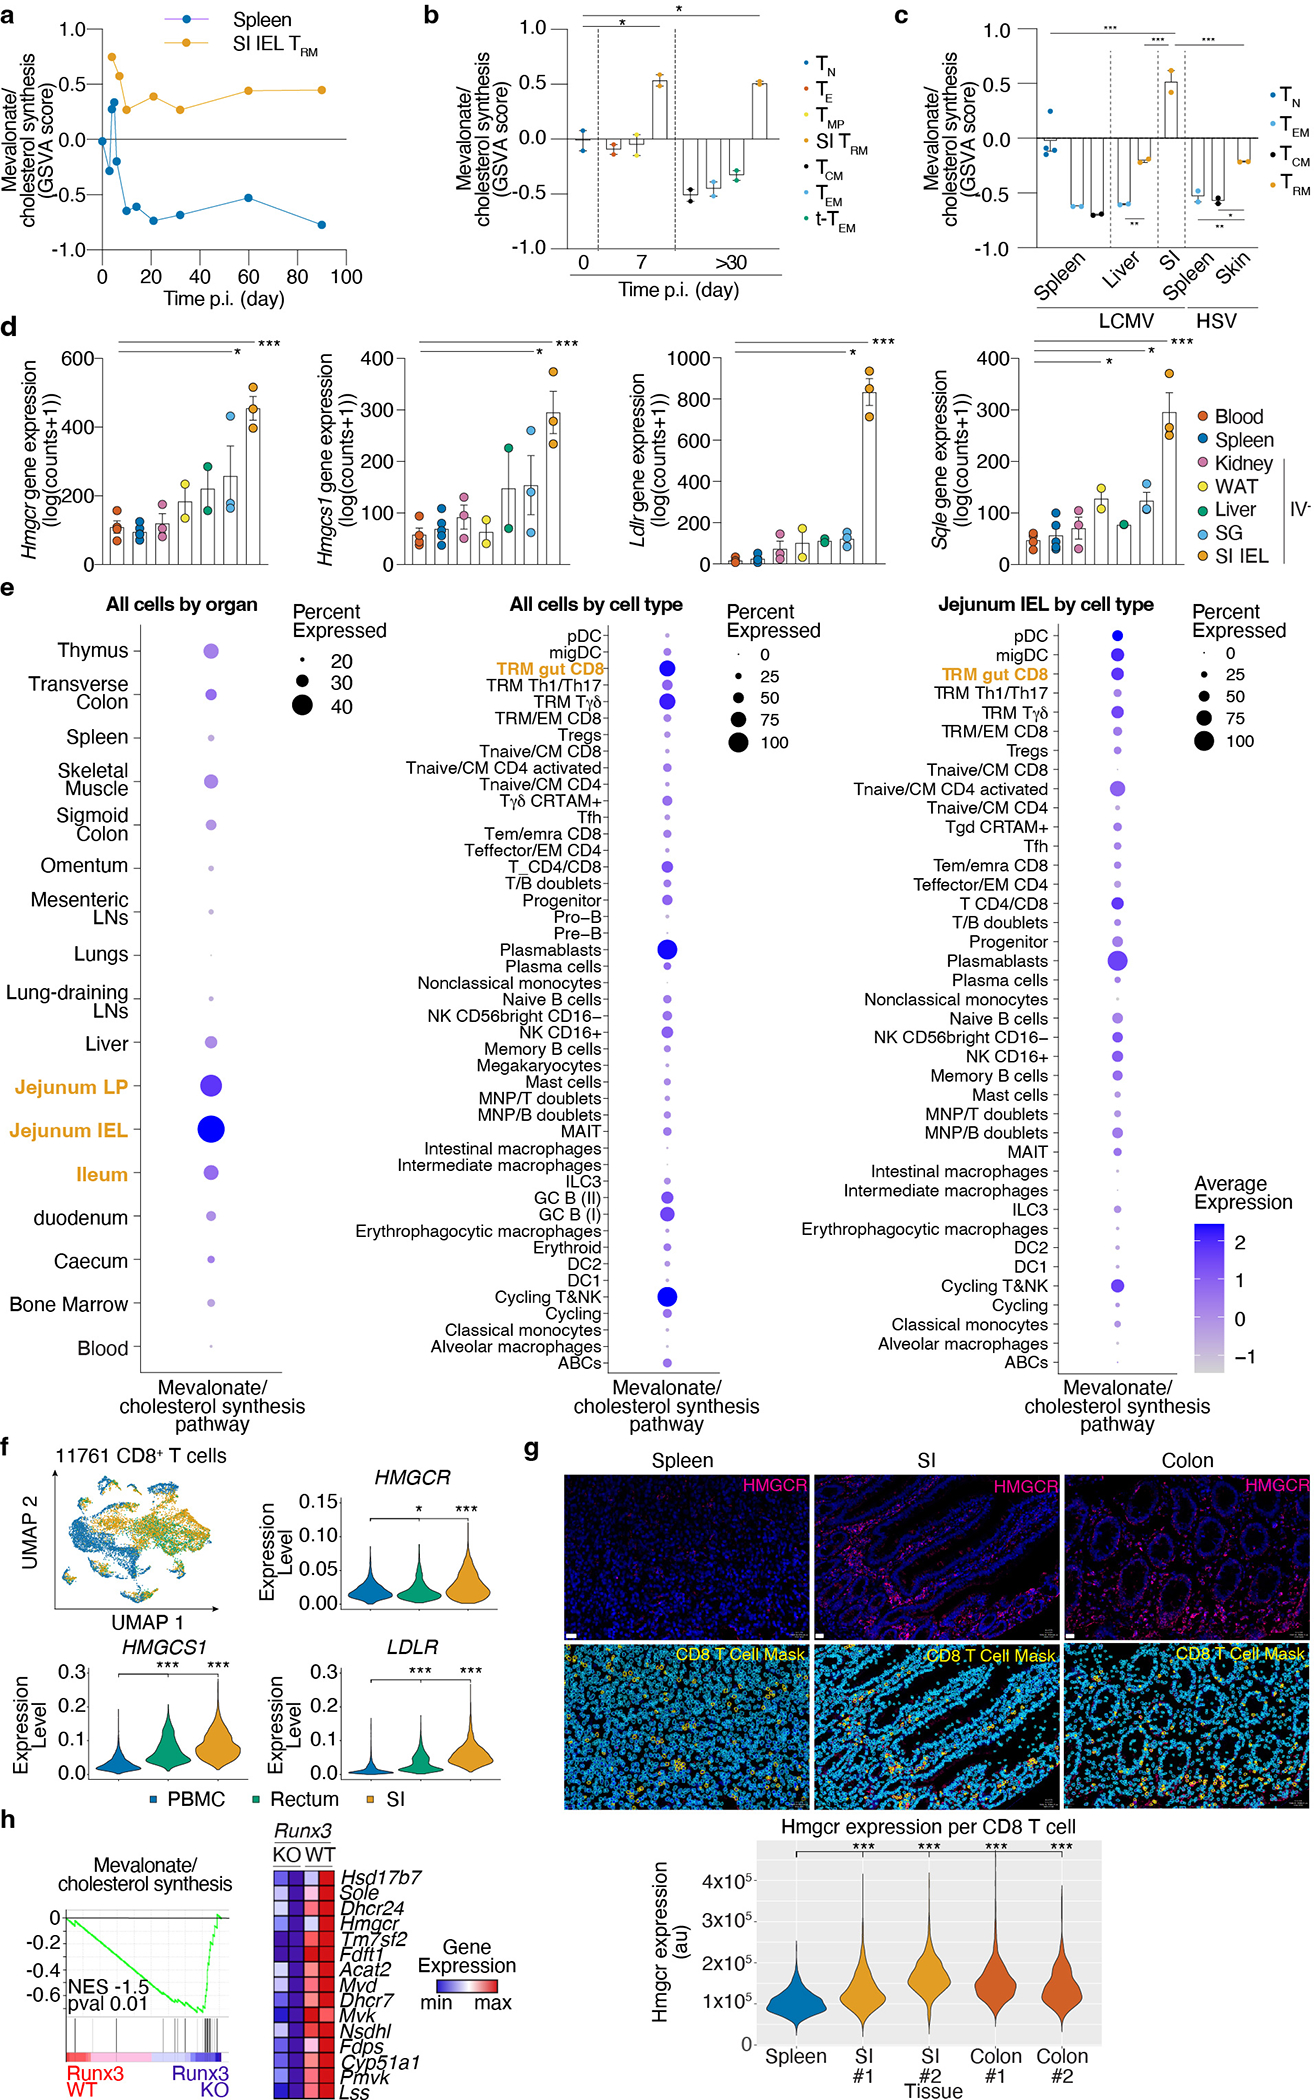
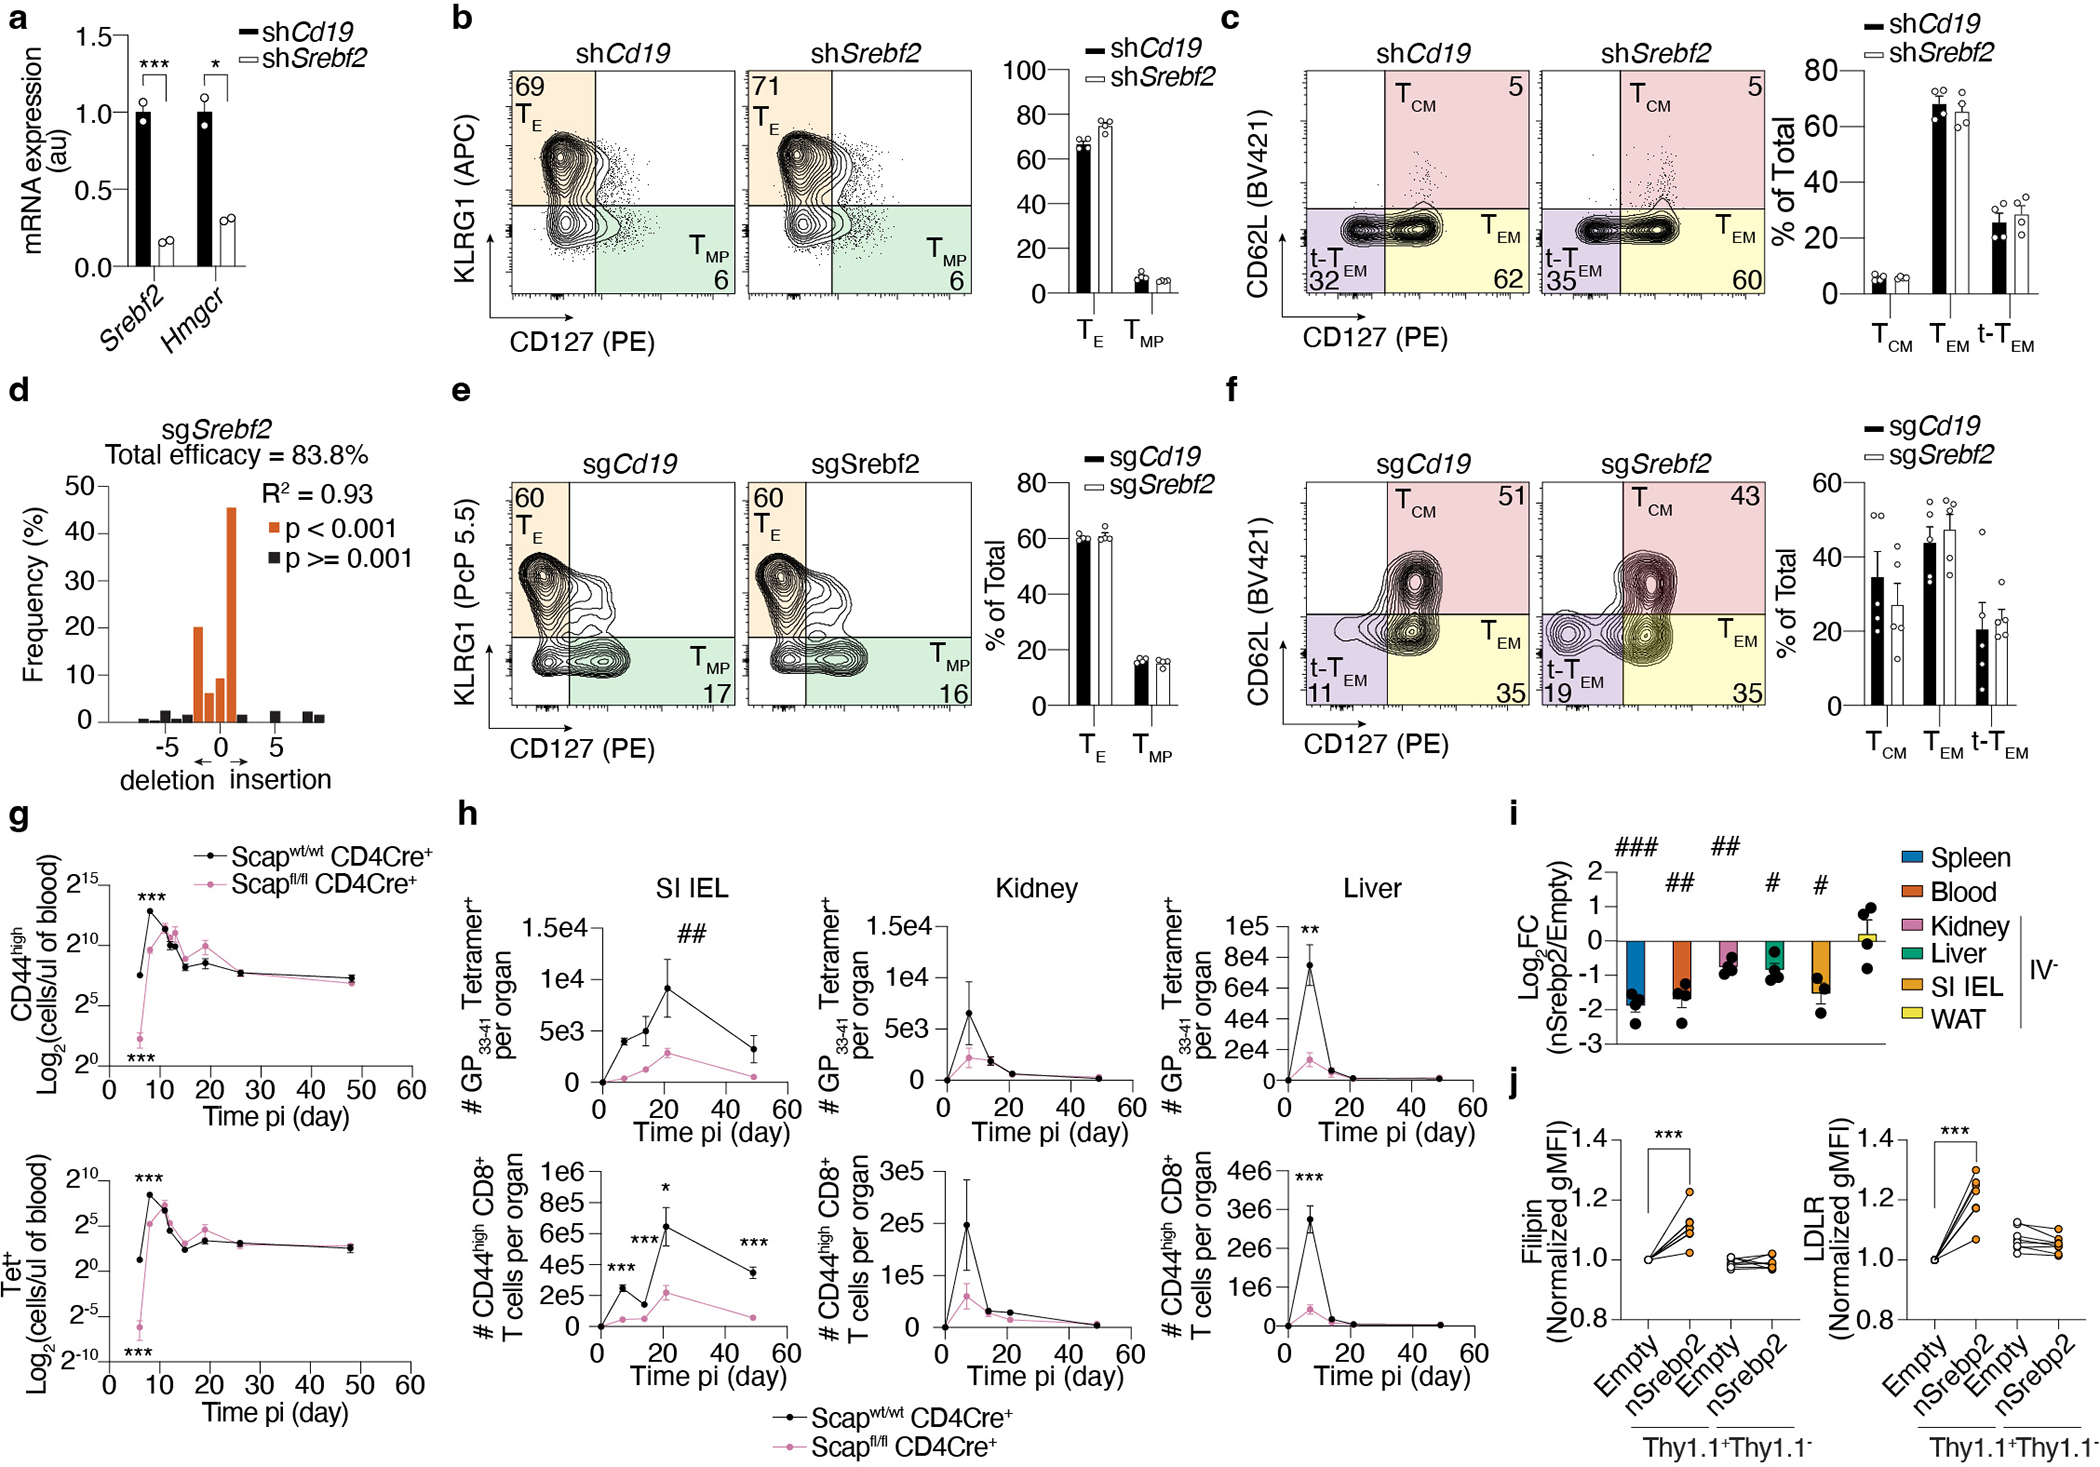
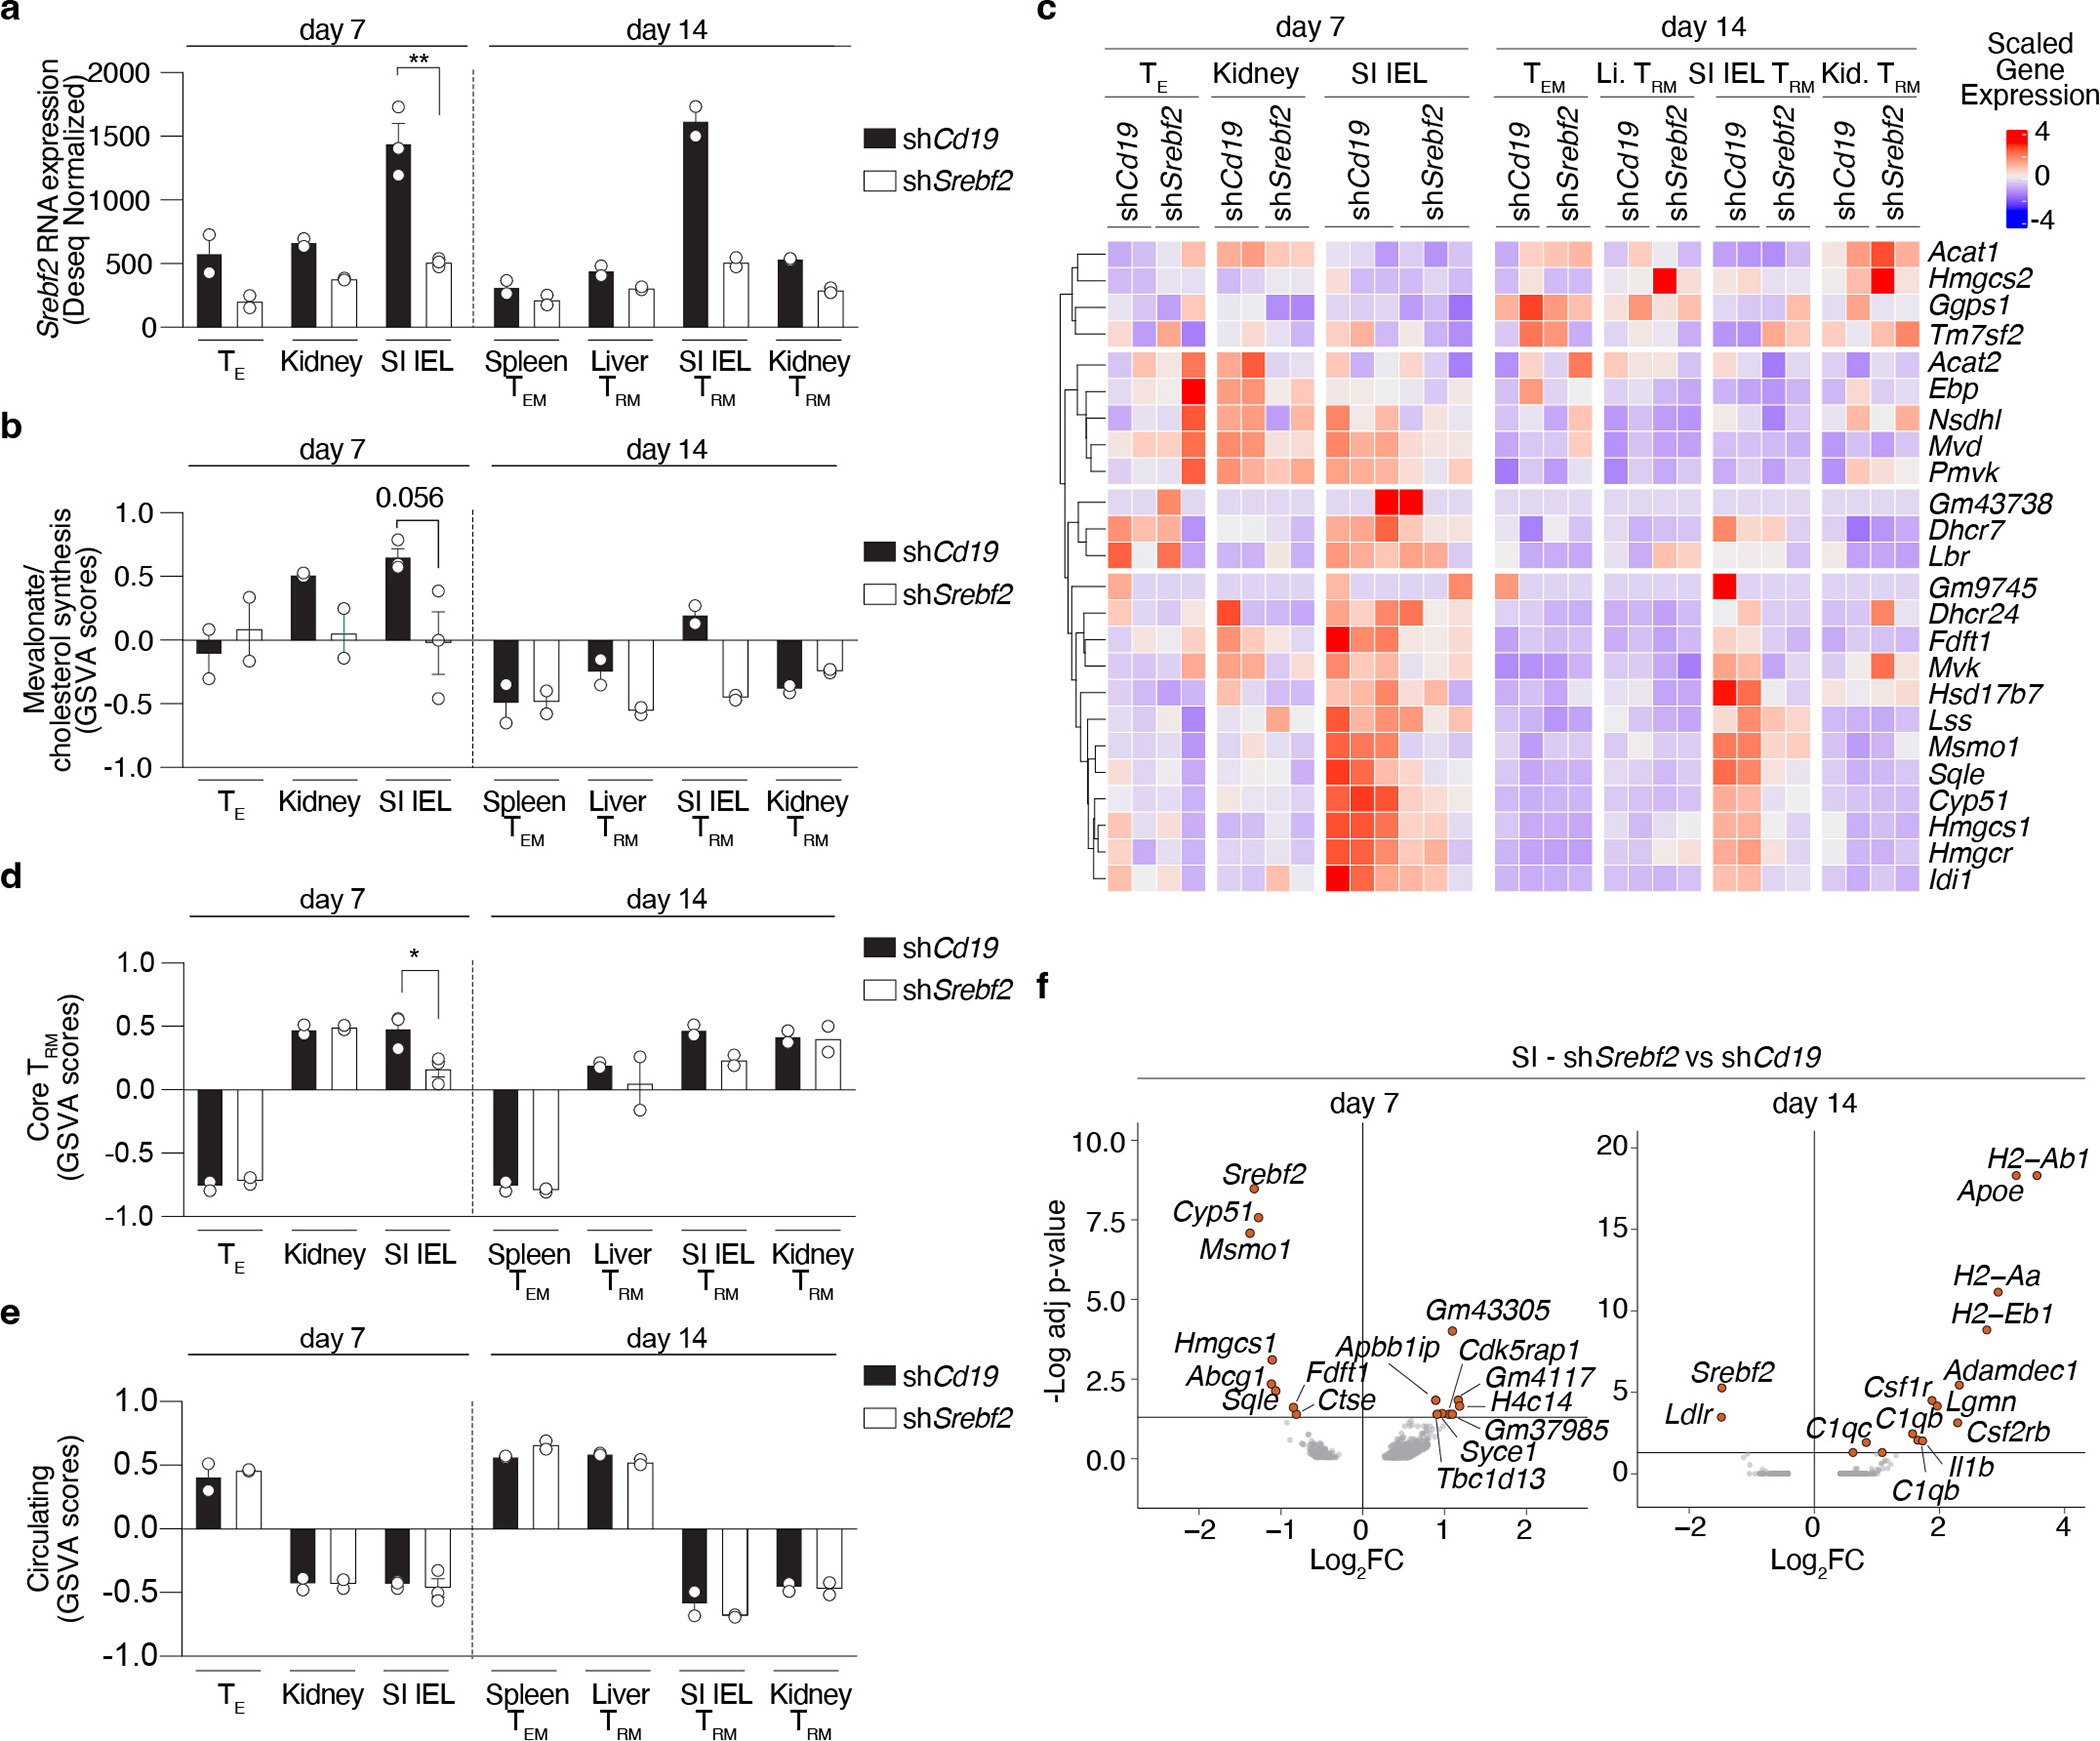
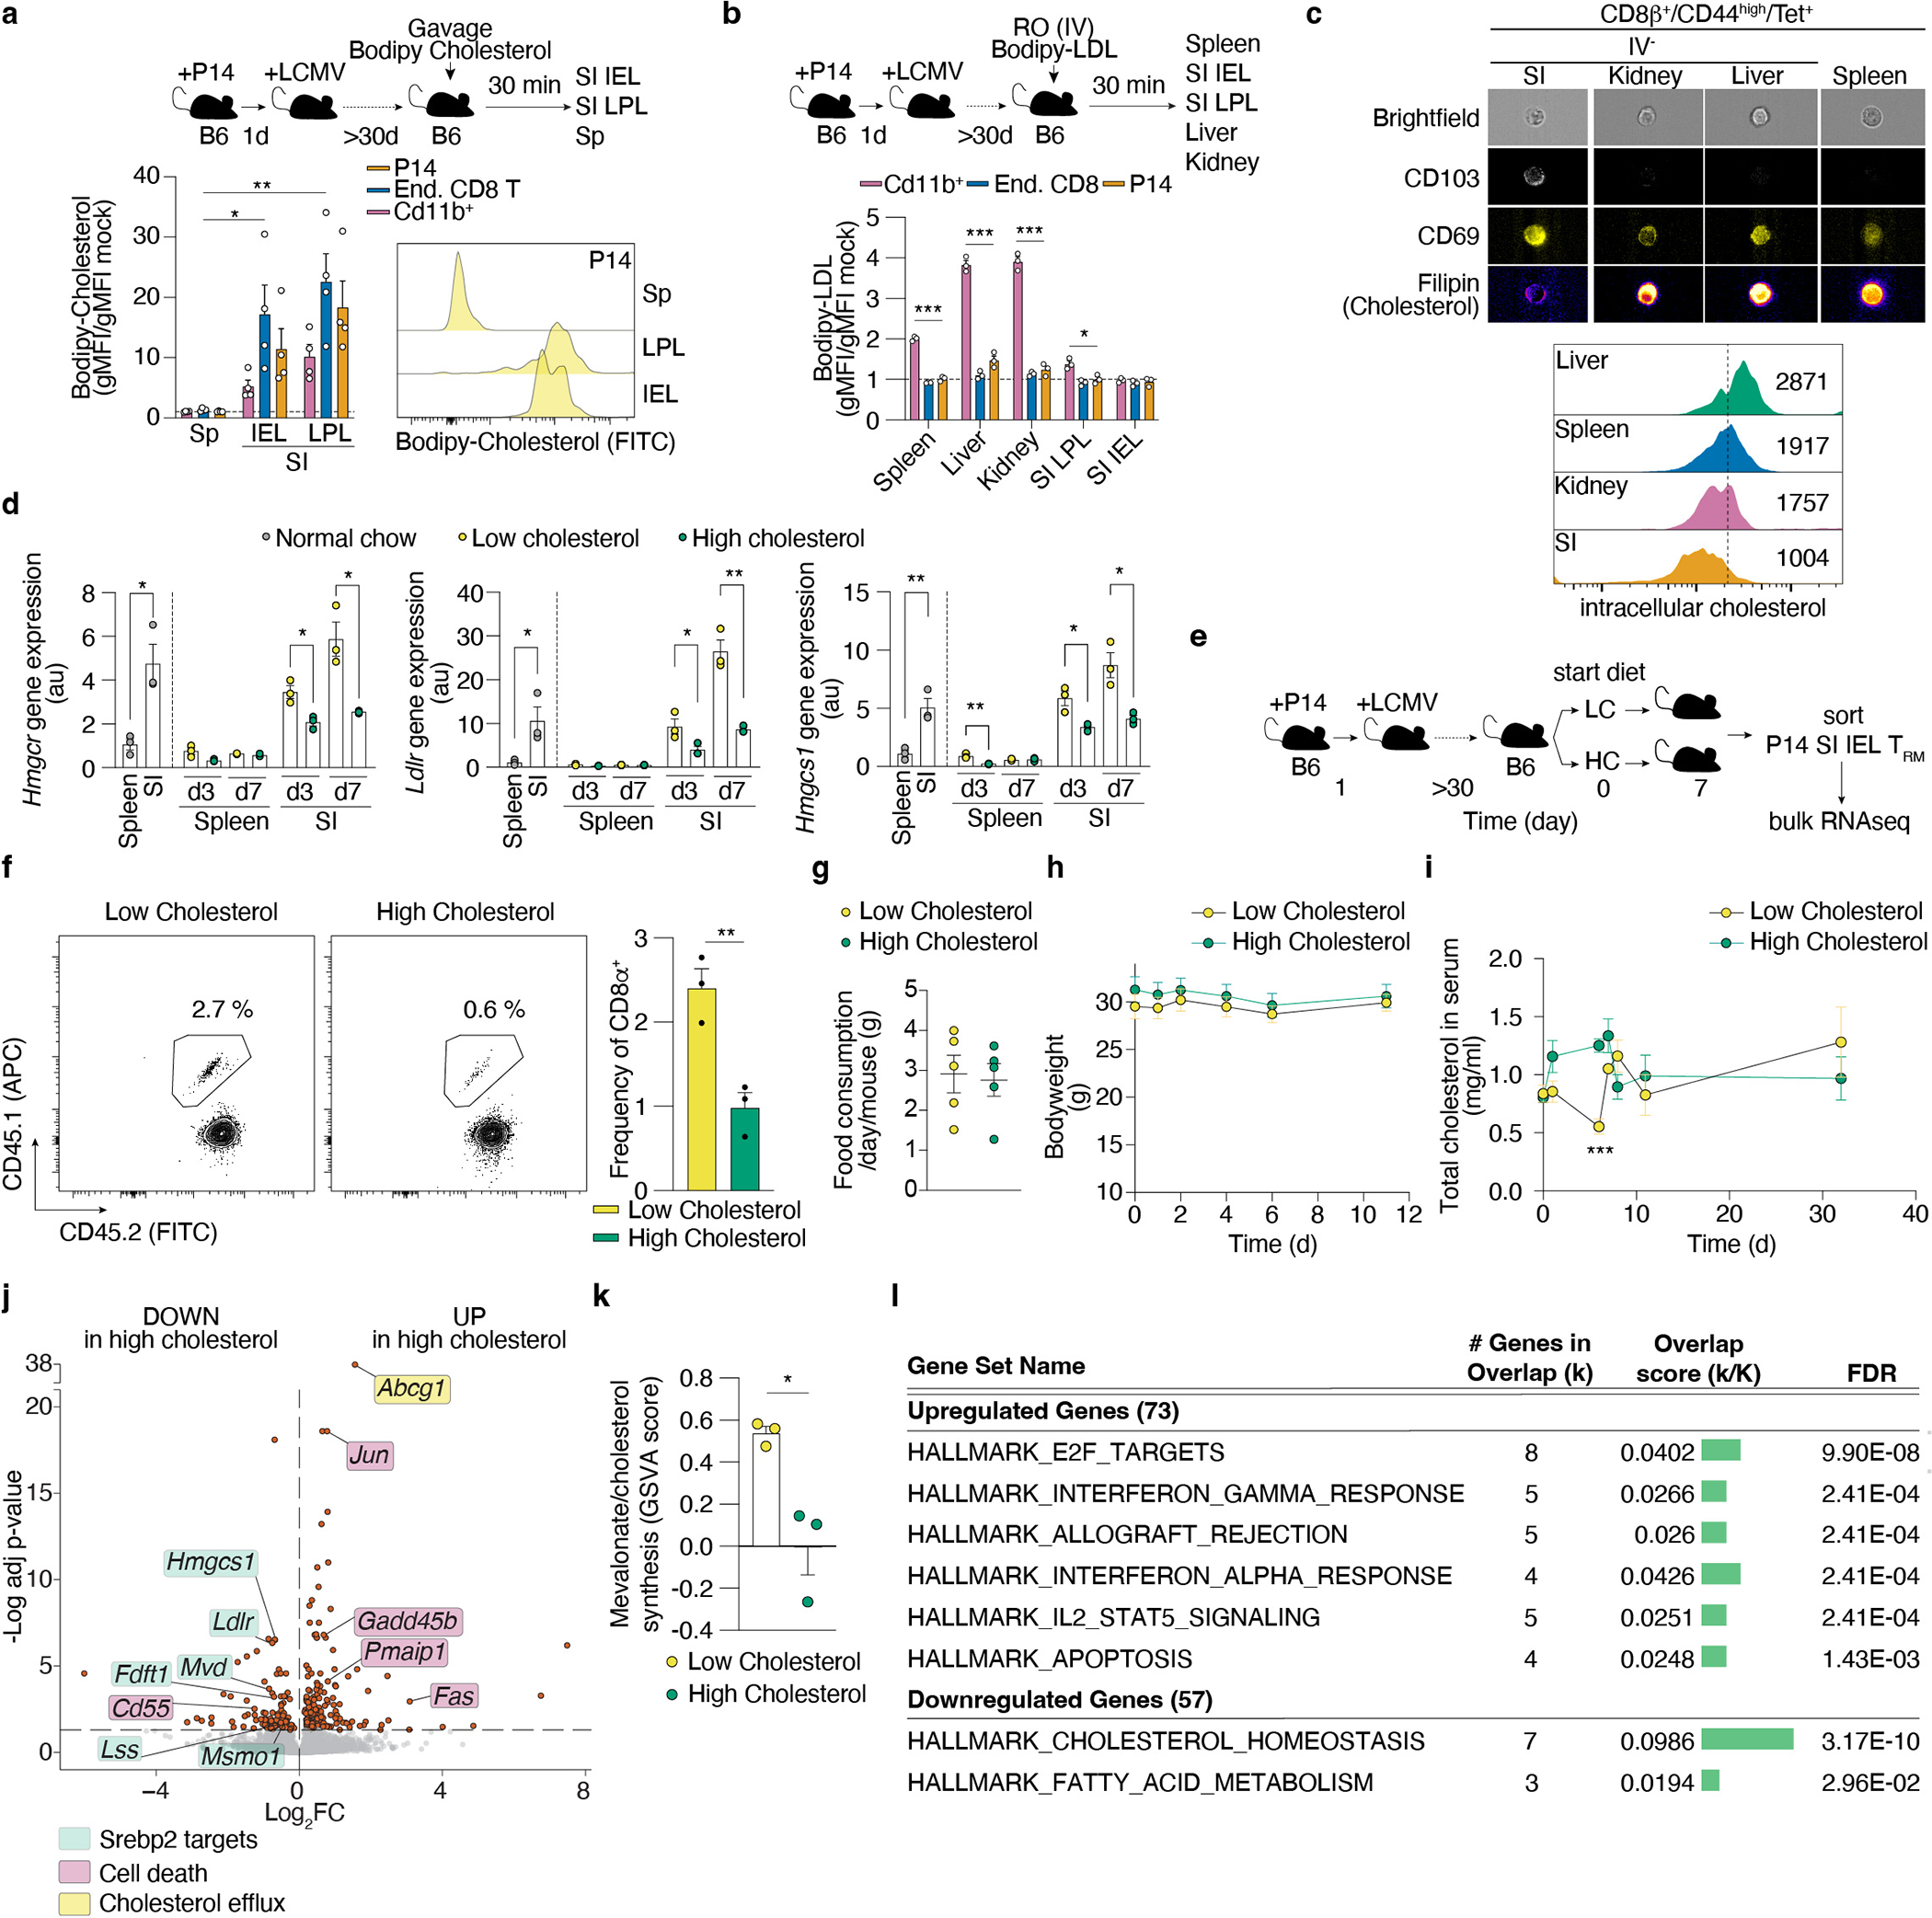
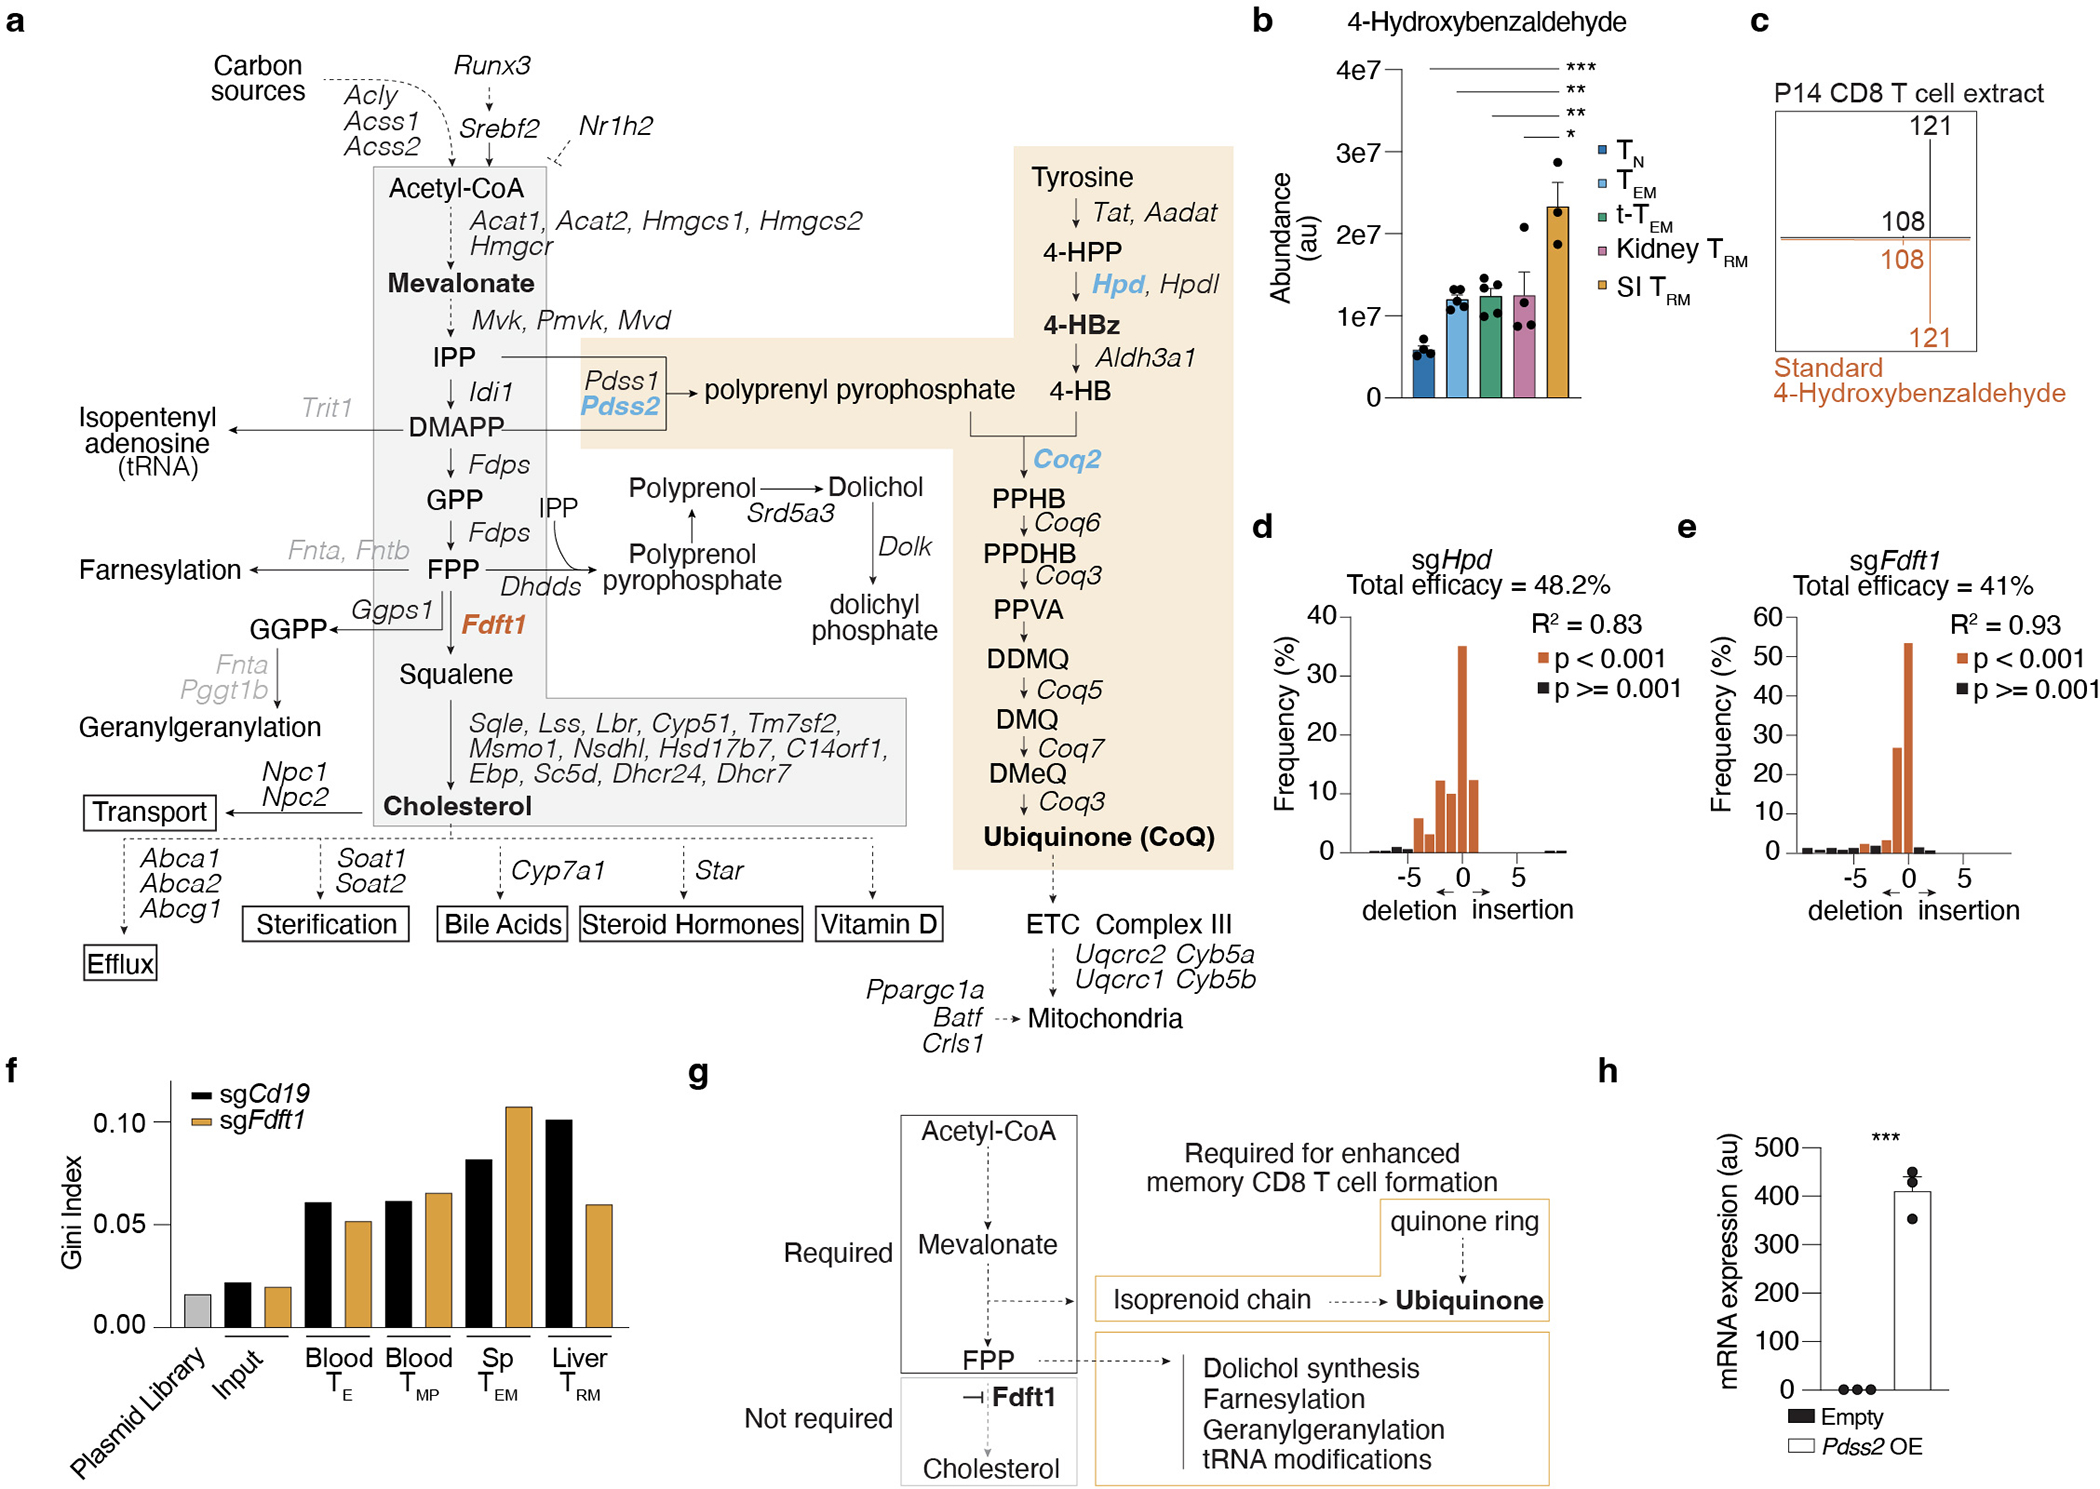
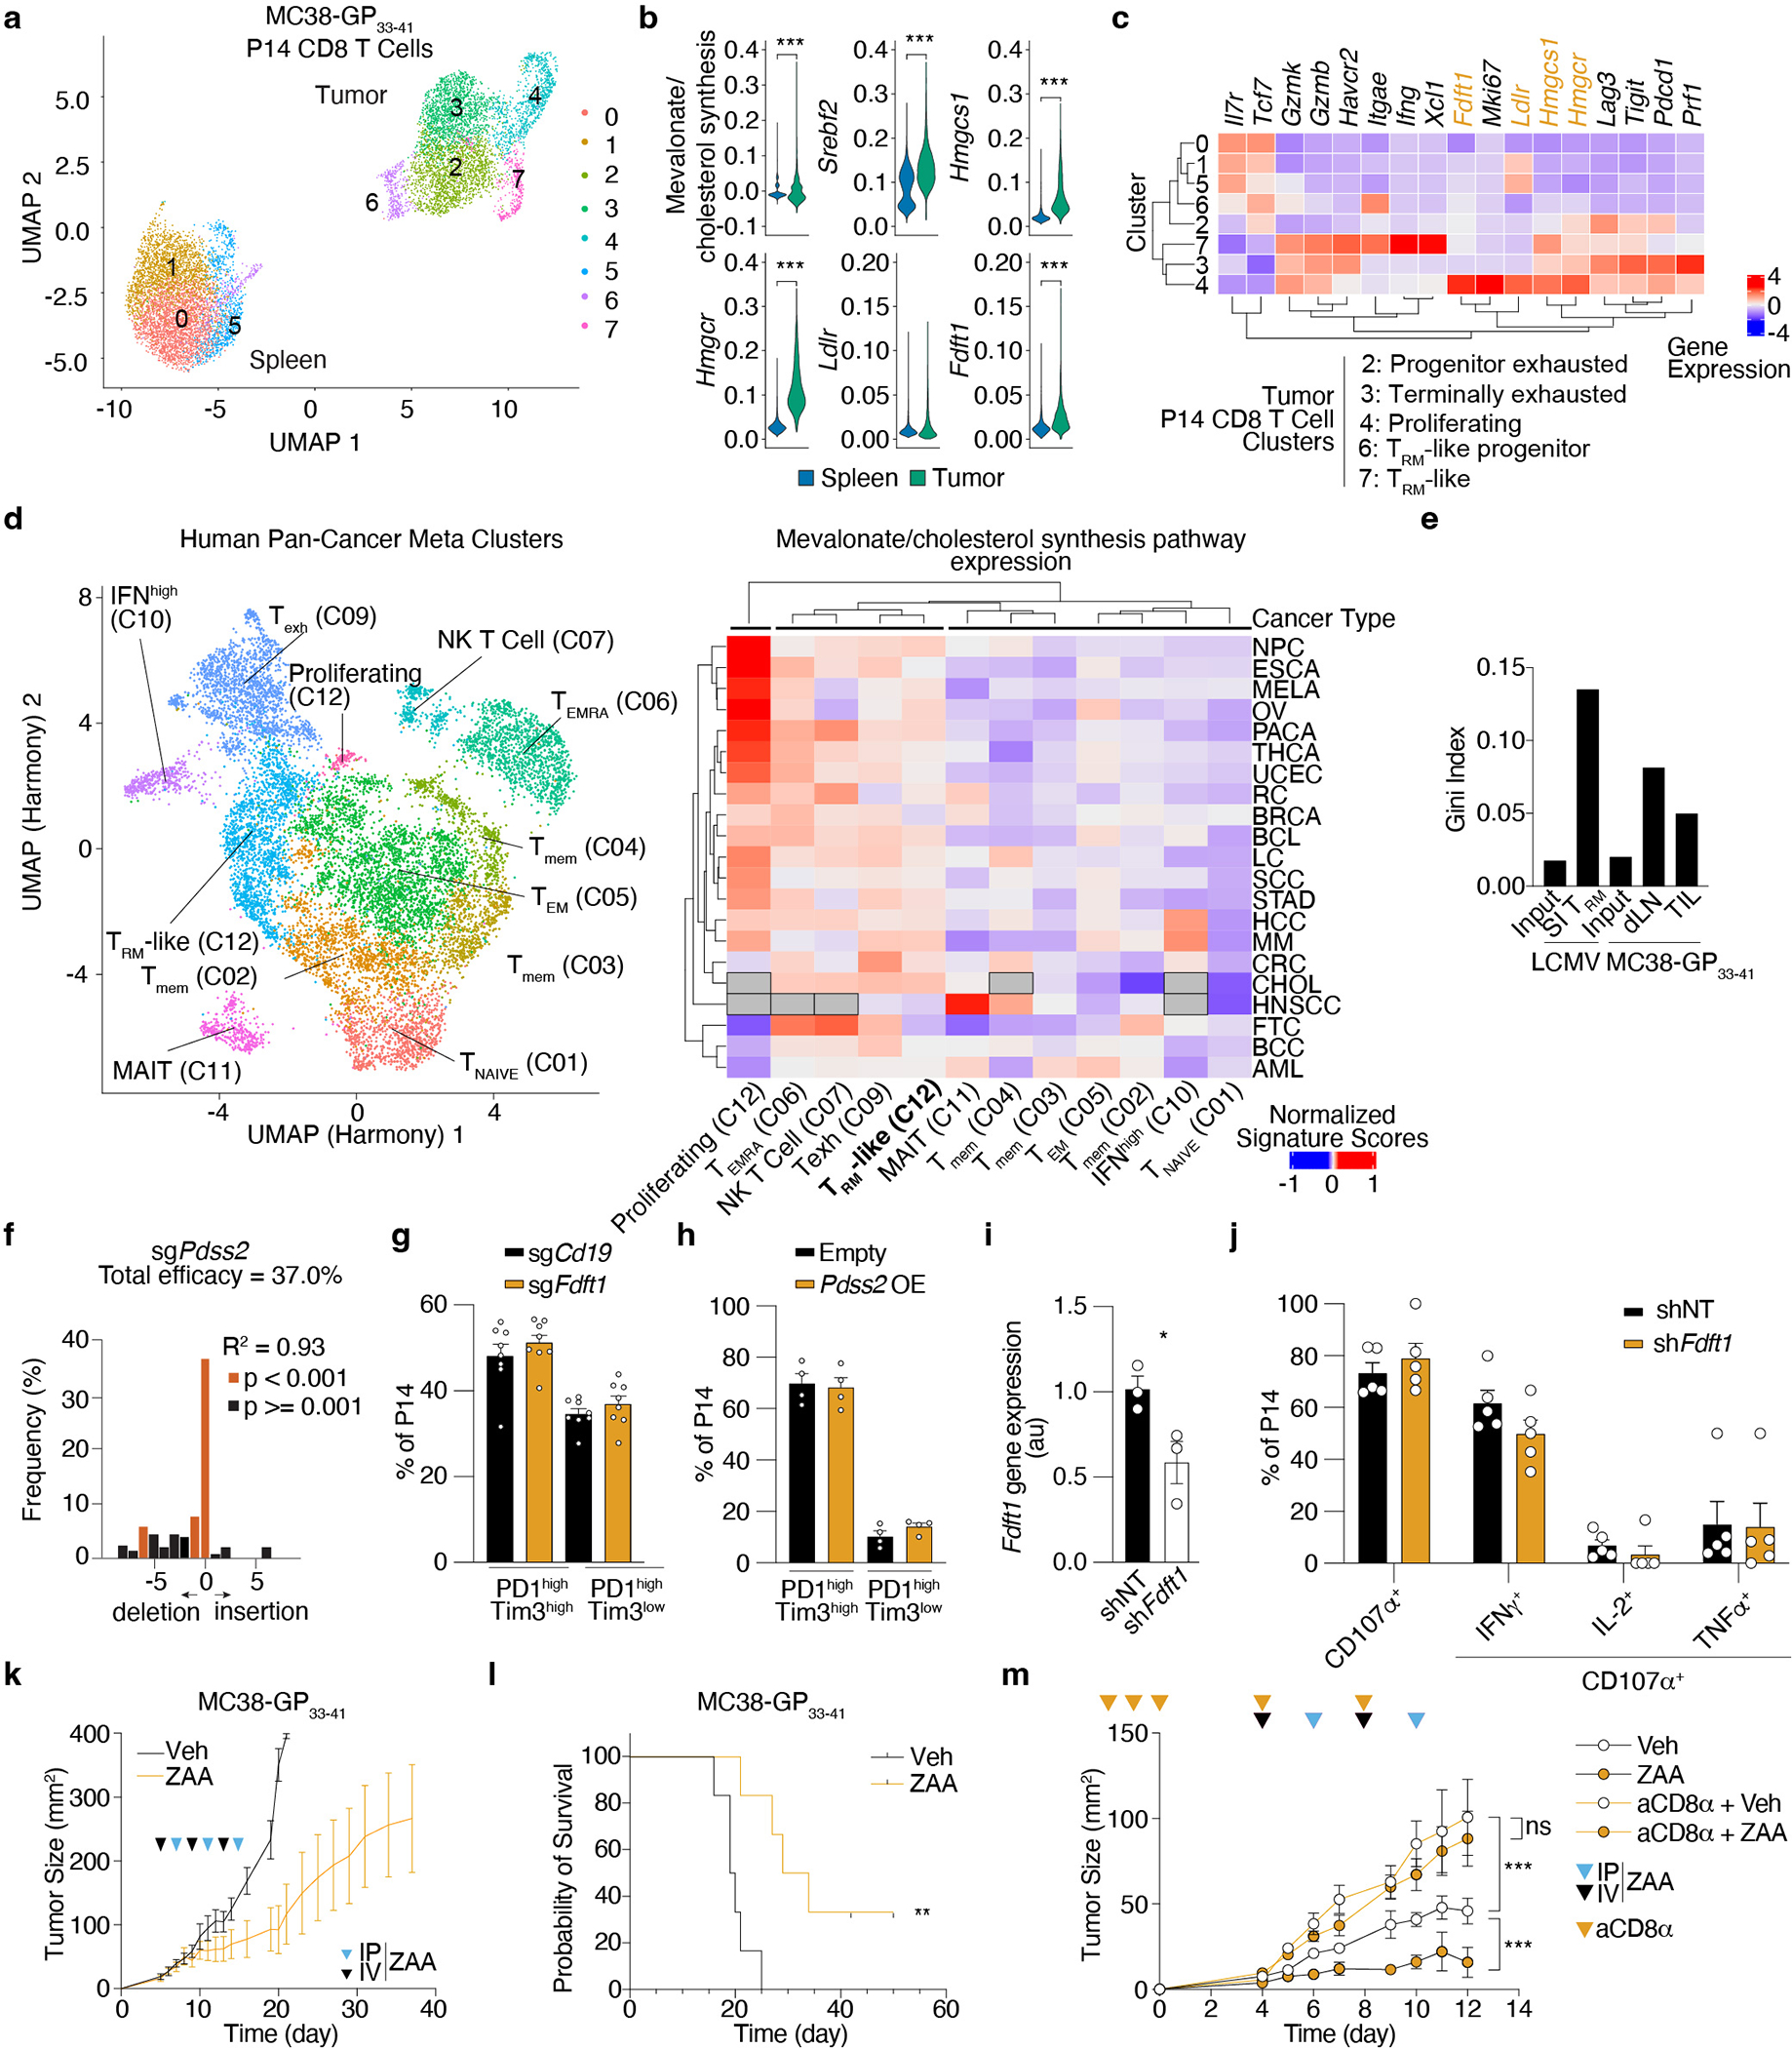
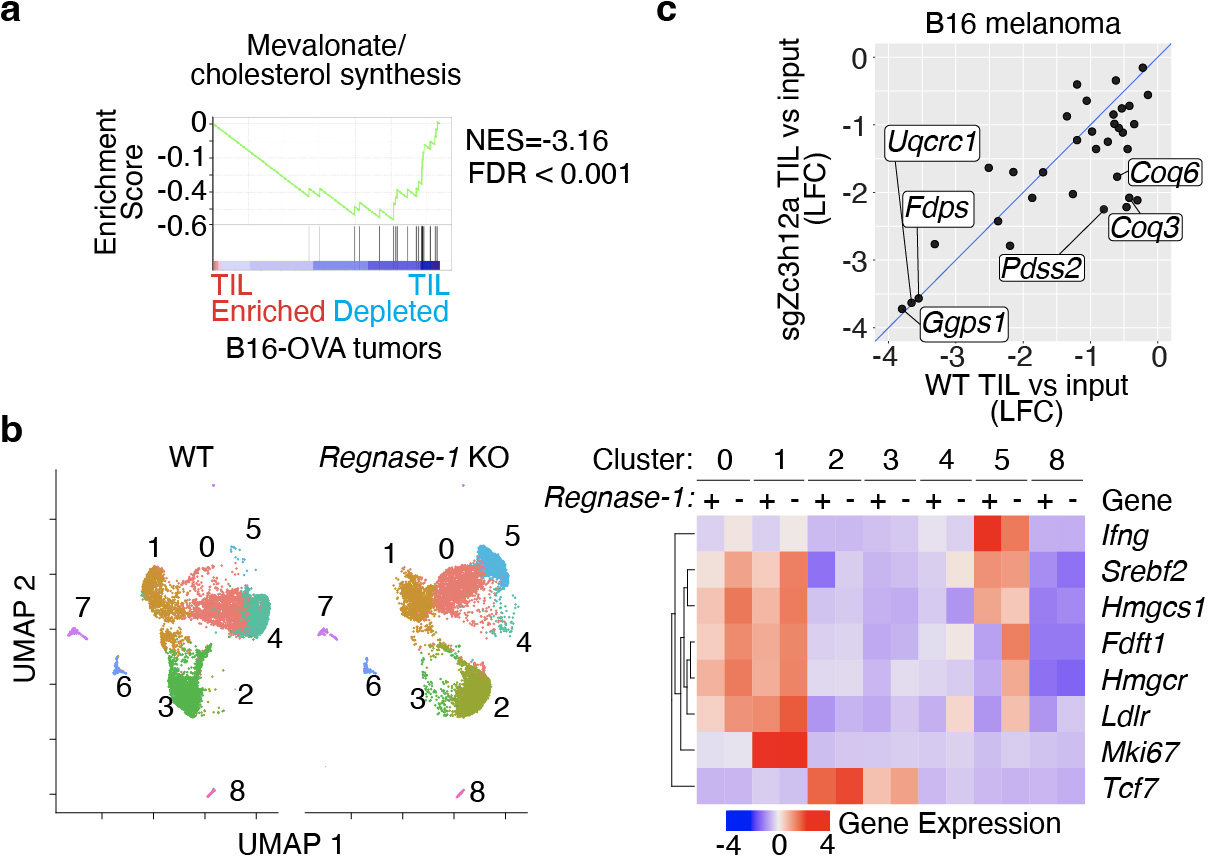
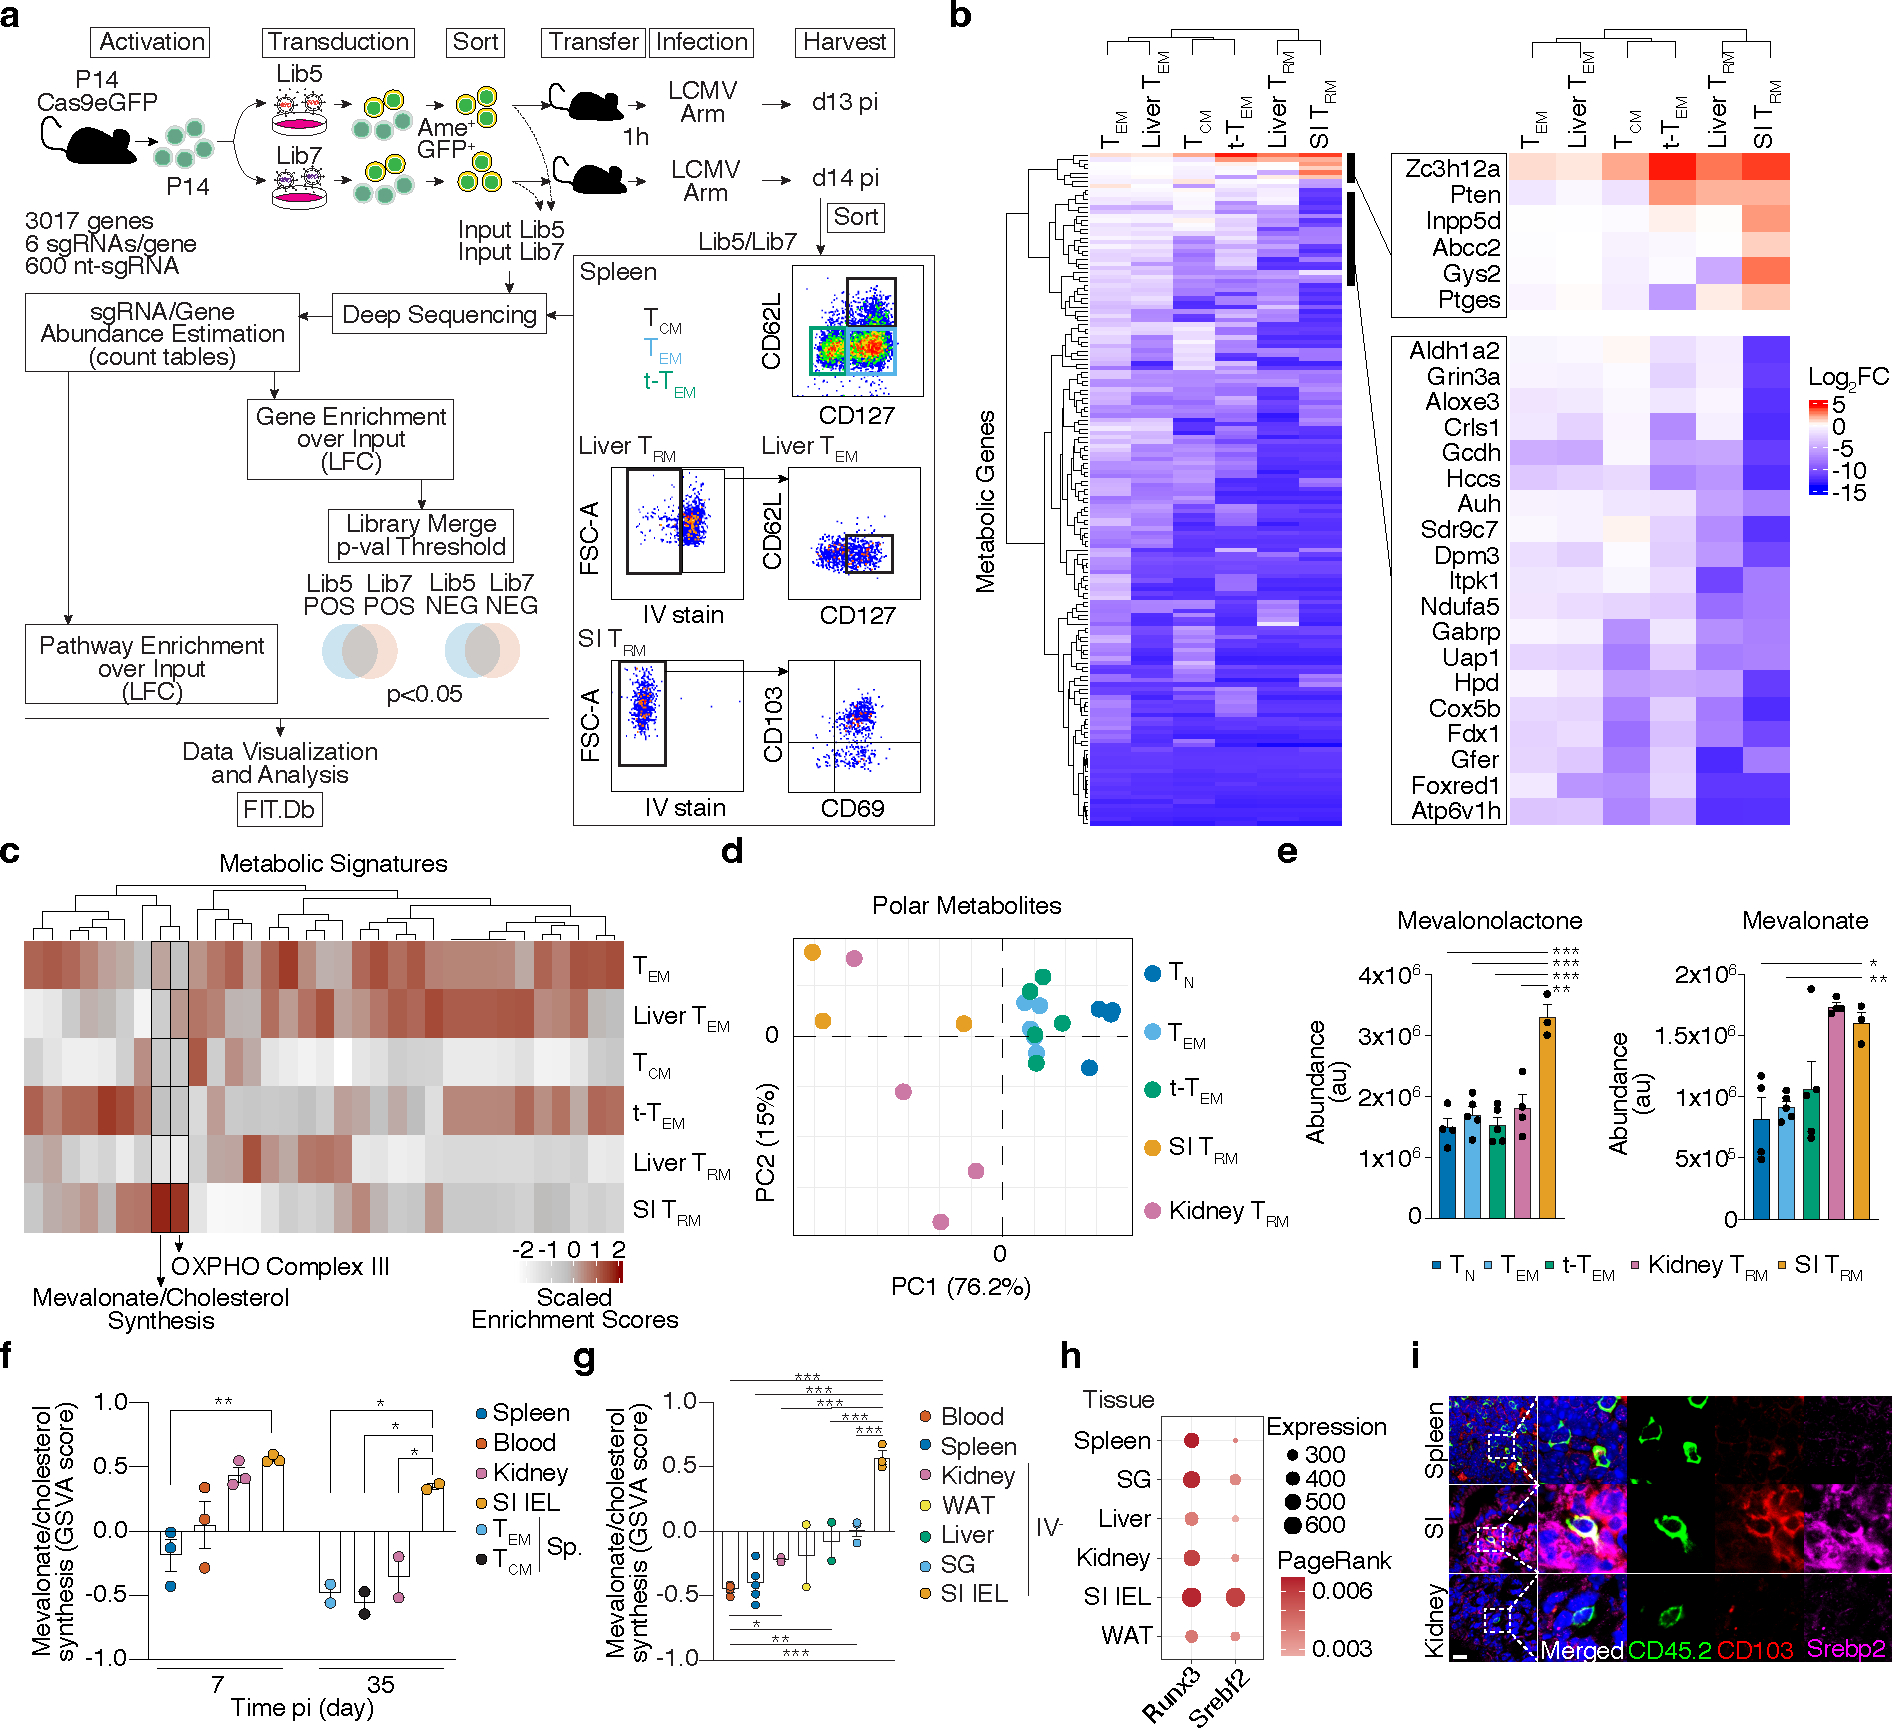
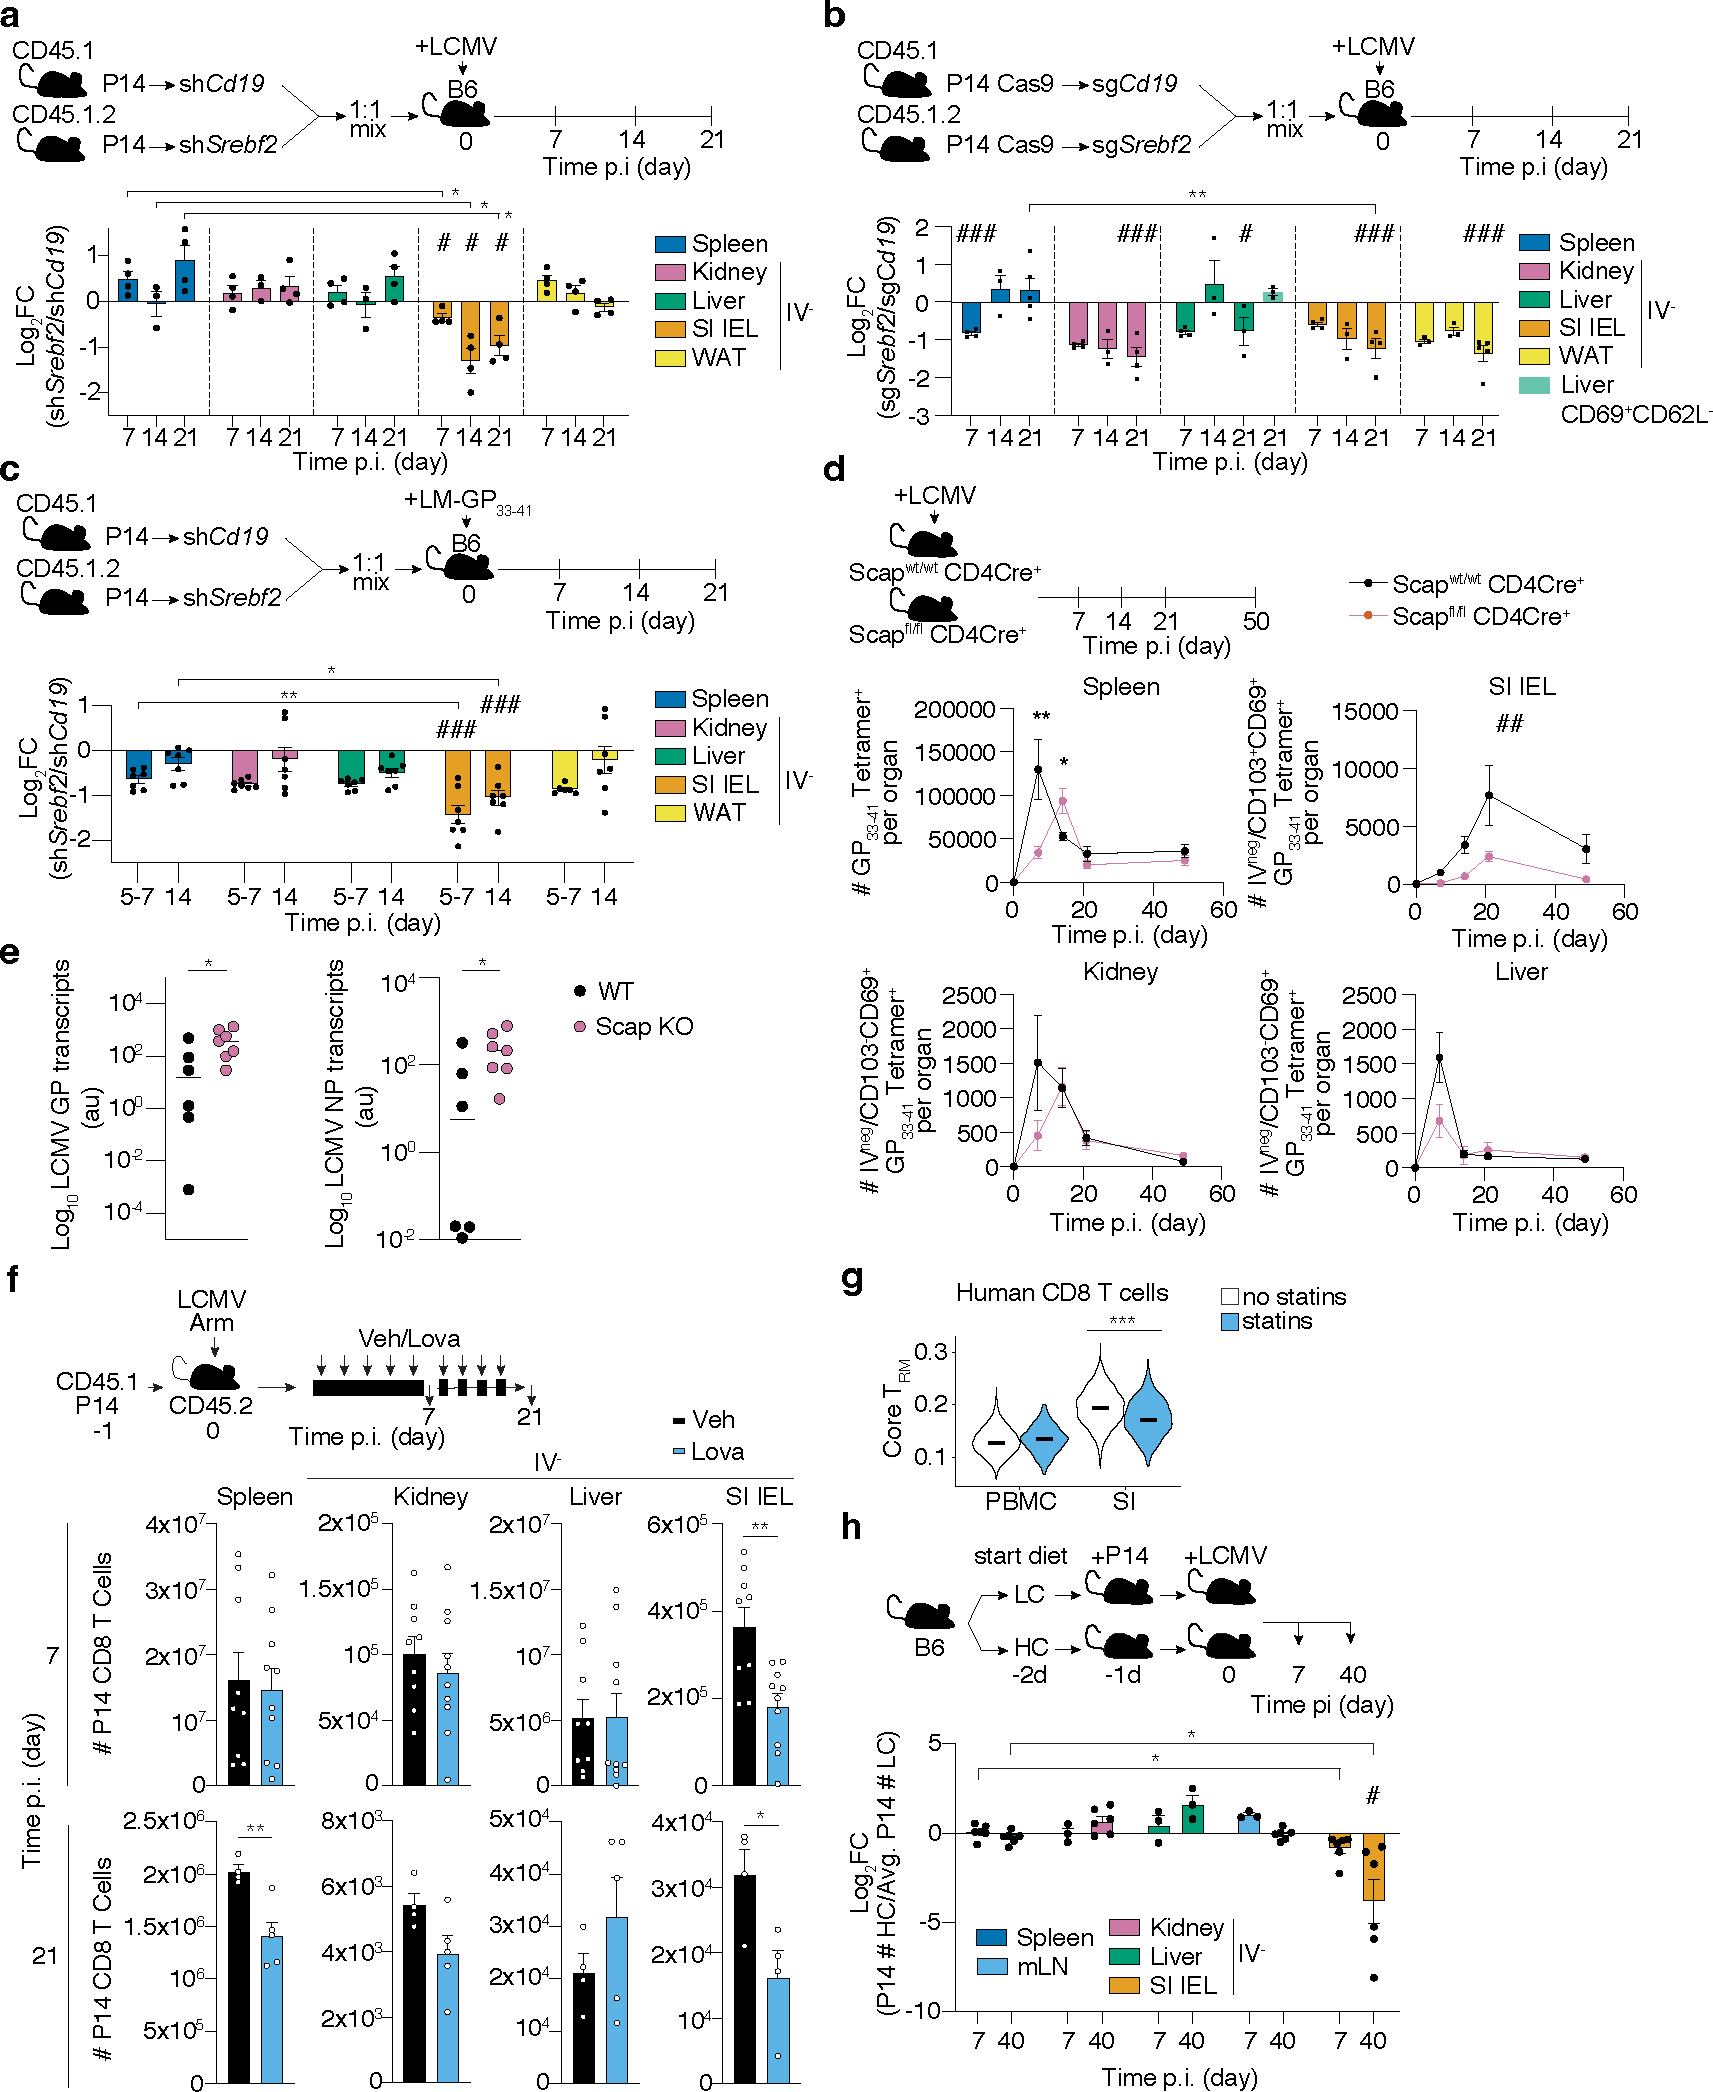
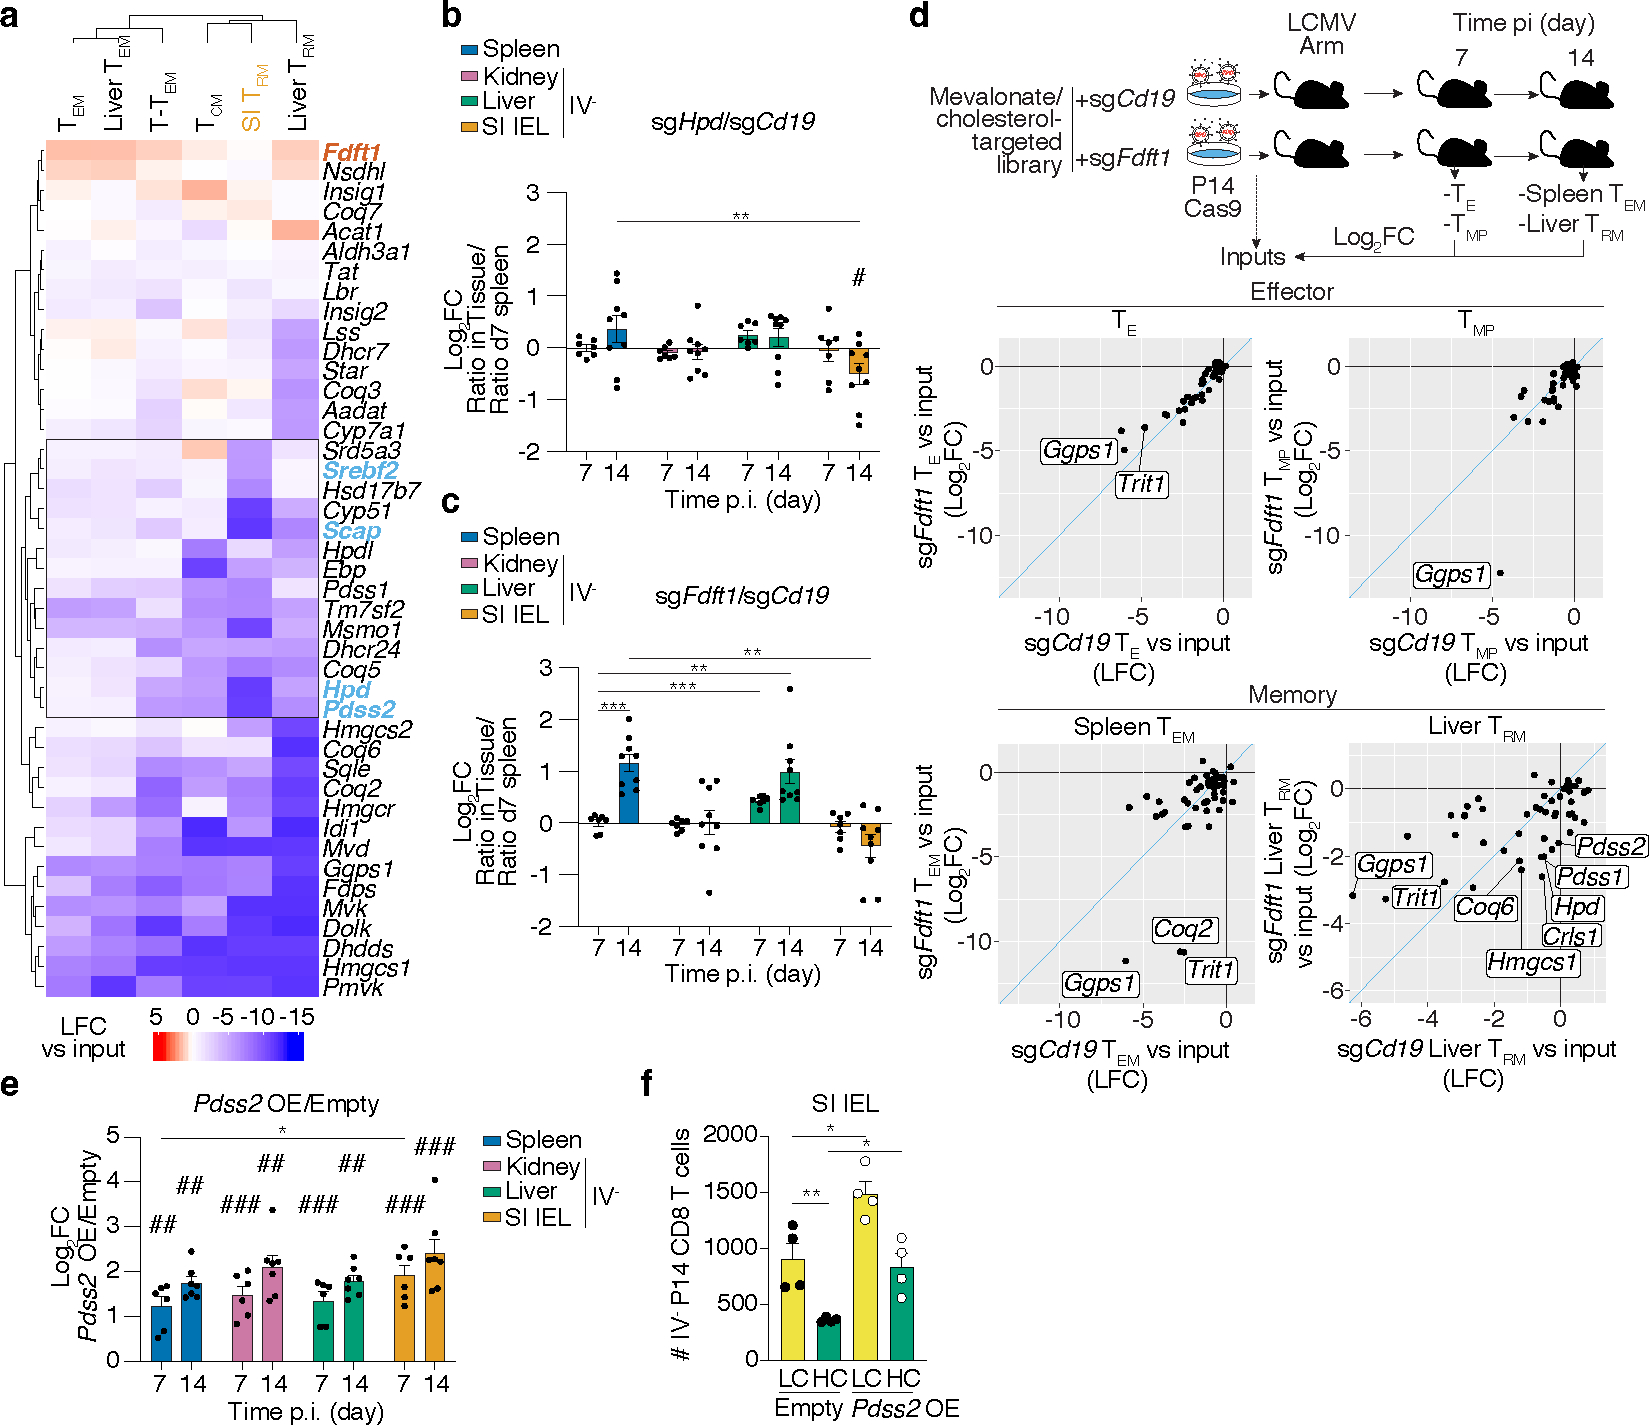
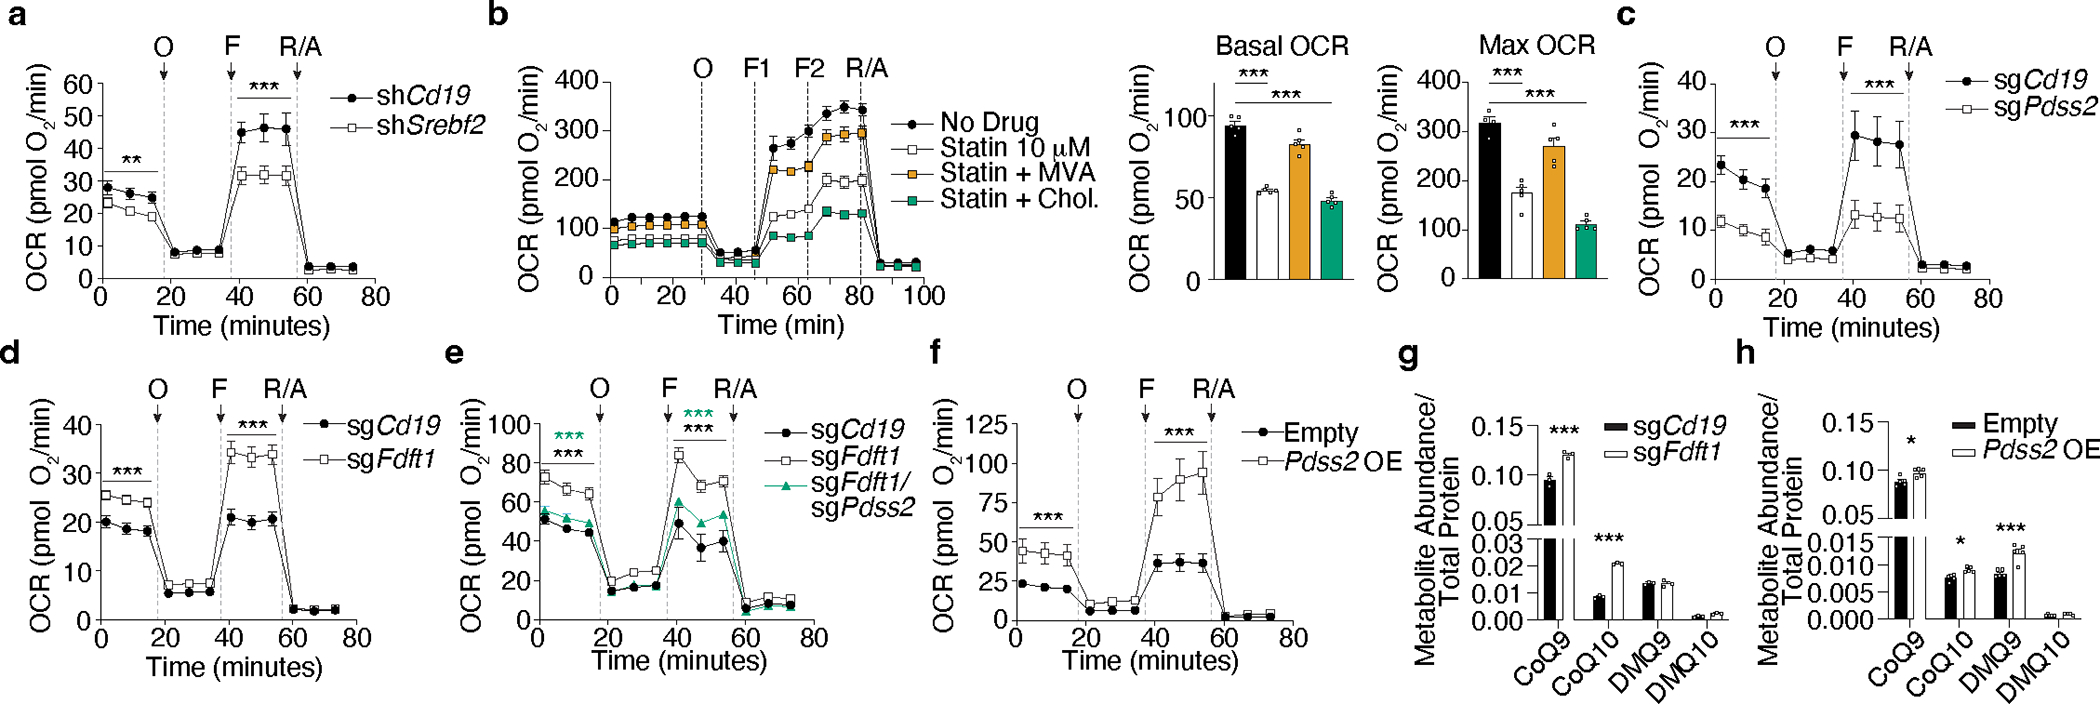
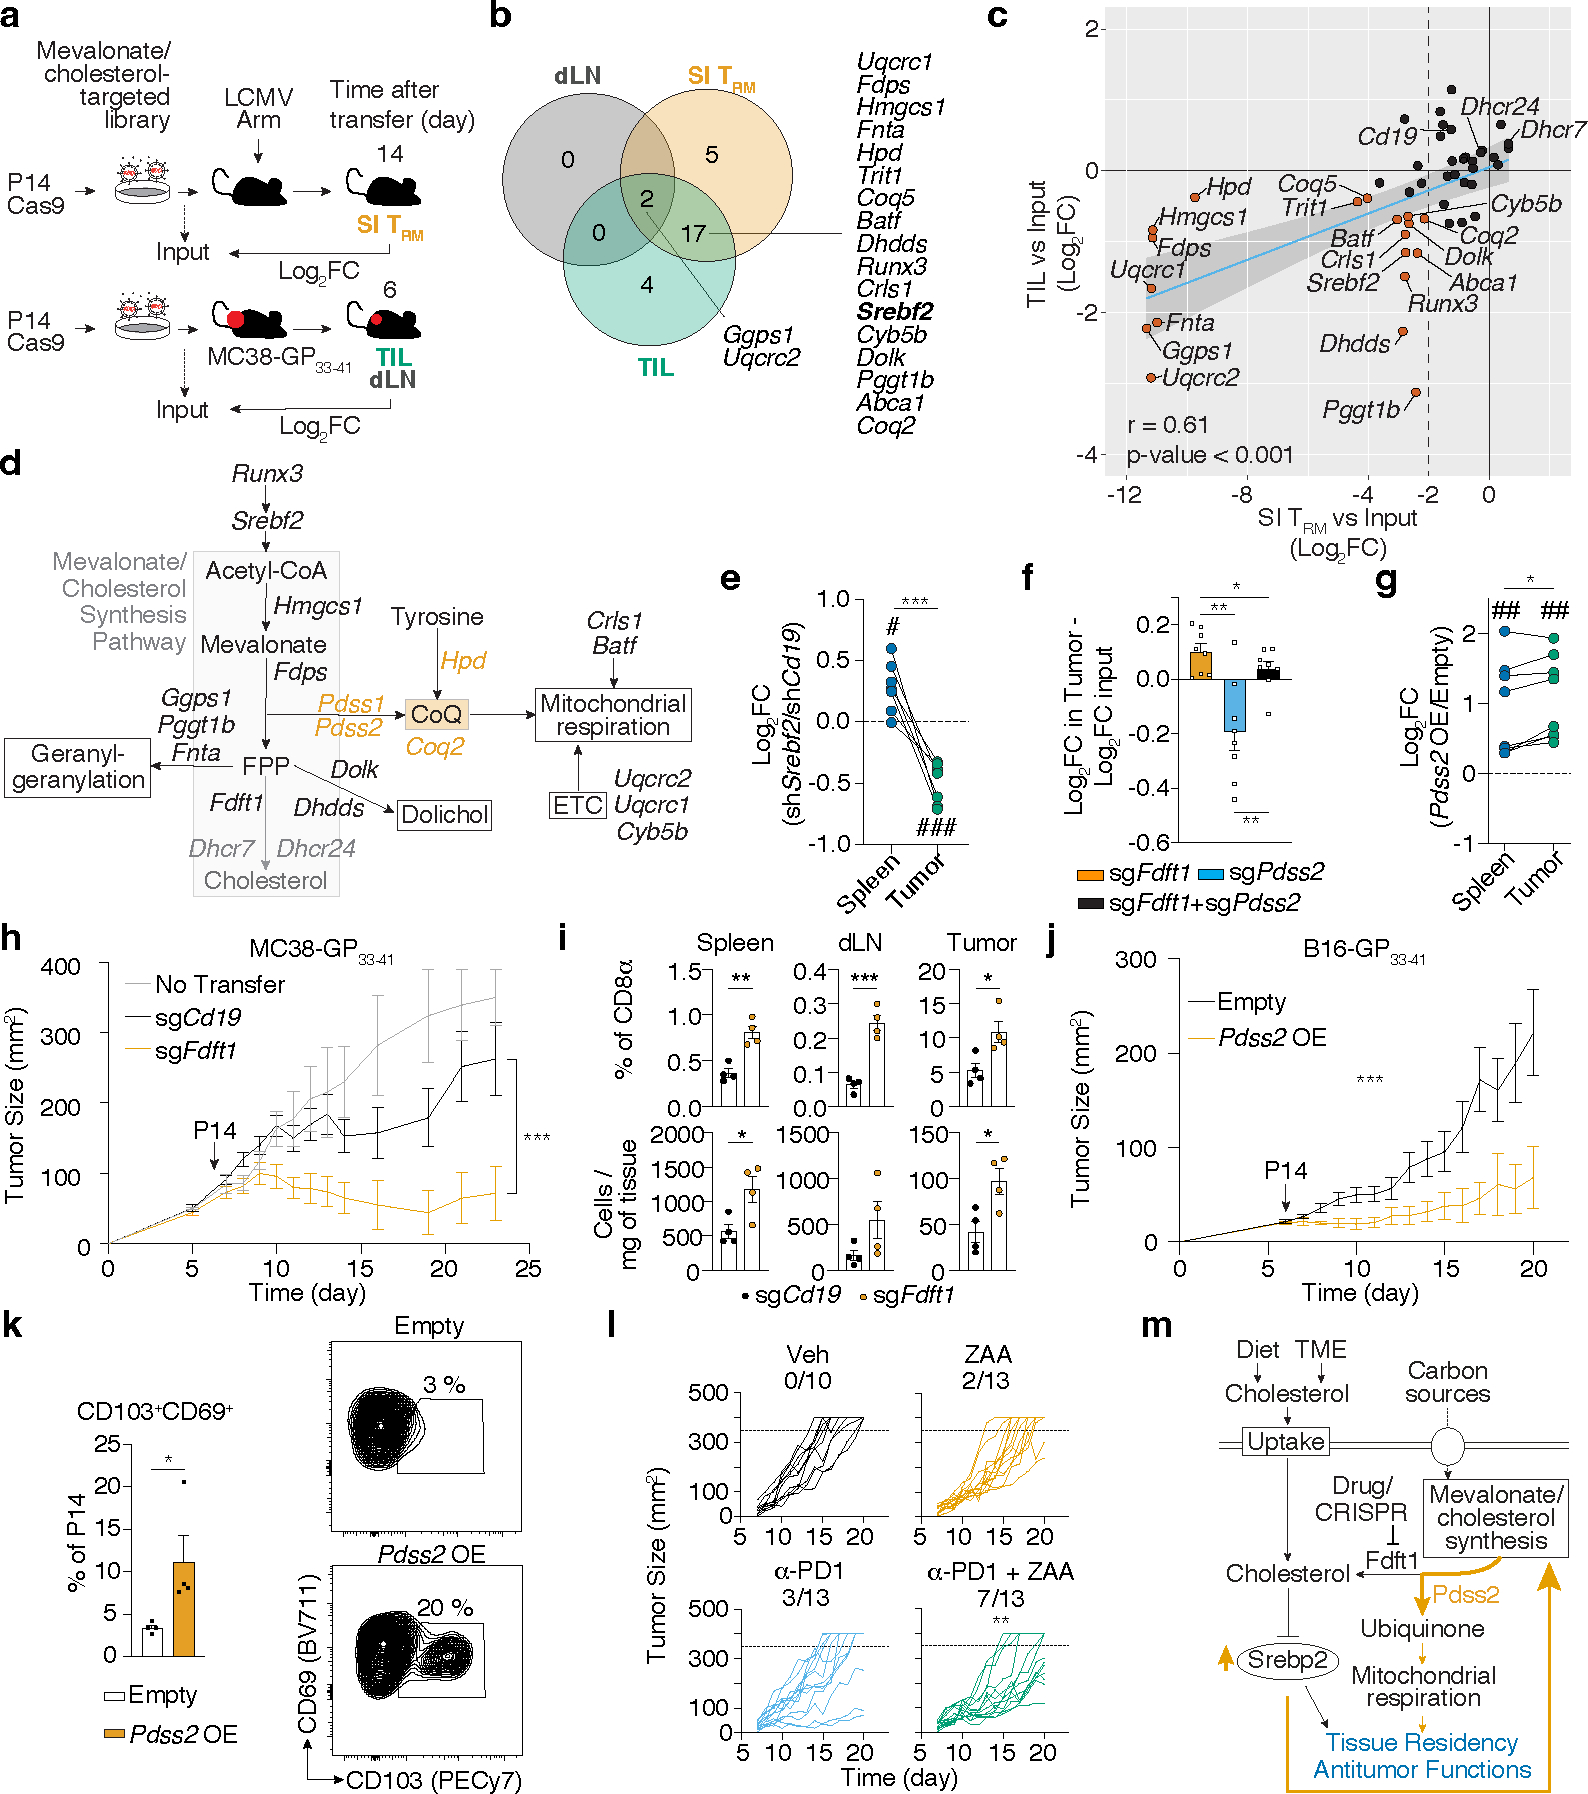
Tissue resident memory CD8+ T (TRM) cells offer rapid and long-term protection at sites of reinfection1. Tumour-infiltrating lymphocytes with characteristics of TRM cells maintain enhanced effector functions, predict responses to immunotherapy and accompany better prognoses2,3. Thus, an improved understanding of the metabolic strategies that enable tissue residency by T cells could inform new approaches to empower immune responses in tissues and solid tumours. Here, to systematically define the basis for the metabolic reprogramming supporting TRM cell differentiation, survival and function, we leveraged in vivo functional genomics, untargeted metabolomics and transcriptomics of virus-specific memory CD8+ T cell populations. We found that memory CD8+ T cells deployed a range of adaptations to tissue residency, including reliance on non-steroidal products of the mevalonate-cholesterol pathway, such as coenzyme Q, driven by increased activity of the transcription factor SREBP2. This metabolic adaptation was most pronounced in the small intestine, where TRM cells interface with dietary cholesterol and maintain a heightened state of activation4, and was shared by functional tumour-infiltrating lymphocytes in diverse tumour types in mice and humans. Enforcing synthesis of coenzyme Q through deletion of Fdft1 or overexpression of PDSS2 promoted mitochondrial respiration, memory T cell formation following viral infection and enhanced antitumour immunity. In sum, through a systematic exploration of TRM cell metabolism, we reveal how these programs can be leveraged to fuel memory CD8+ T cell formation in the context of acute infections and enhance antitumour immunity.


Conflict of interest statement

Competing interests

A.W.G. serves on the scientific advisory boards of ArsenalBio and Foundery Innovations. H.C. is a consultant for Kumquat Biosciences. M.F.K. is a founder and shareholder of PIONYR Immunotherapeutic and Foundery Innovations. A provisional patent application has been filed by M.R-C., G.G, and A.G. covering the methods of use of FDFT1 and PDSS2 manipulation for “ENHANCING CAR-T CELL PERFORMANCE FOR CANCER IMMUNOTHERAPY” (U.S. Provisional Application Serial No. 63/449,701). The rest of the authors declare that they have no competing interests.

Figures

Extended Data Figure 1.
Extended Data Figure 1.. Functional genetics in vivo, metabolomics and transcriptional analysis of ex vivo populations of memory CD8 T cells identify a graded upregulation of a Srebp2-dependent metabolic programming across TRM.
a, Unsupervised hierarchical clustering heatmap of scaled GSVA scores for metabolic signatures across samples, p.i., post-infection. GSE107278. b, sgRNA library heterogeneity reported as Gini Index values. c, Upset plot showing intersection sizes and set sizes for positive and negative regulators of each P14 CD8 T cell population in the in vivo CRISPR/Cas9-mediated loss-of-function screen. d, Sample acquisition and analysis workflow for LC-MS/MS-based untargeted metabolomics of ex vivo populations of CD8 T cells in the context of LCMV infection. Gating strategy included for each cell type analyzed. e, Tandem mass spectra matching against commercial standards of mevalonate and mevalonolactone. Tandem mass spectra derived from the most abundant ion for each compound. Black spectra are derived from cell lysate, red mirrored spectra from commercial standard. f, Unsupervised hierarchical clustering of scaled relative abundances of identified annotated metabolites of P14 cells profiled by untargeted metabolomics at day 13 post LCMV infection.
Extended Data Figure 2.
Extended Data Figure 2.. Upregulation of the mevalonate/cholesterol synthesis pathway in mouse and human TRM.
a, Mevalonate/cholesterol synthesis GSVA scores from averaged single cell expression of spleen and SI P14 at indicated time points after LCMV infection profiled by scRNASeq, GSE131847. b, Mevalonate/cholesterol synthesis GSVA scores for indicated subsets of CD8 T cells in the spleen or SI in the context of LCMV infection, GSE157072. c, Mevalonate/cholesterol synthesis GSVA scores for indicated subsets of CD8 T cells at the indicated tissues in the context of LCMV and Herpes Simplex Virus (HSV), GSE70813. d, Gene expression of indicated genes in P14 CD8 T cell populations from indicated tissues >30 days after LCMV infection, GSE182276 e, Mevalonate/cholesterol synthesis pathway scores for all human immune cells grouped by indicated tissues (left), cell types (middle), or cell types of the Jejunum SI (right), from the tissue immune cell scRNAseq atlas. f, Expression of selected genes on human CD8 T cells from PBMC, rectum, and SI samples, pooled from 13 healthy donors, GSE125527. g, HMGCR protein expression in CD8 T cells from human spleen, SI, and colon by immunofluorescence staining. Quantification of total HMGCR by CD8 T cell area. Donor ID (#). Scale bar, 20 μm. h, GSEA of the mevalonate/cholesterol synthesis in Runx3 KO or control CD8 T cells GSE106107. Data are pseudo-bulk averaged values (a), mean +/− s.e.m. (b, c, and d), or geometric distribution (f and g), with a total of n=2 (b), n=2–4 (c), n=2–5 (d) mice, and n=1–2 (g) samples. Two-sided unpaired t-Test (b, c, d, f, and g), and Gene Set Enrichment Analysis (h). *P<0.05, **P<0.01, ***P< 0.005.
Extended Data Figure 3.
Extended Data Figure 3.. A Srebp2-dependent metabolic program controls SI TRM formation.
a, Quantification of gene expression by qPCR of shRNAmir control (shCd19) or shSrebf2 shRNAmir P14 CD8 T cells before adoptive transfer. b, Frequency of effector shRNAmir control (shCd19) or shSrebf2 shRNAmir P14 CD8 T cell populations in the spleen 7 days after LCMV infection. c, Frequency of memory shRNAmir control (shCd19) or shSrebf2 shRNAmir P14 CD8 T cell populations in the spleen 21 days after LCMV infection. d, CRISPR/Cas9-mediated indel efficiency of the Srebf2 sgRNA construct on sorted transduced P14 cells before adoptive transfer. e, Frequency of effector sgCd19 or sgSrebf2 P14 cell populations in the spleen 7 days after LCMV infection. f, Frequency of memory sgCd19 or sgSrebf2 P14 cell populations in the spleen 21 days after LCMV infection. g, Total cell quantification of CD44high CD8 T cells (left) and Tet+ CD8 T cells (right) in the blood of Scap WT or Scap KO at different time points after LCMV infection. h, Total cell quantification of Tet+ CD8 T cells (upper) and CD44high CD8 T cells (lower) in SI, kidney, and liver of Scap WT or Scap KO at different time points after LCMV infection. i, Ratio of congenically distinct P14 CD8 T cells transduced with a constitutively active nuclear form of human Srebp2 (nSrebp2) or an empty vector (Empty) from indicated tissues 7 days after LCMV infection. j, Flow cytometry analysis of cholesterol content by Filipin stain (left), and LDLR expression in P14 CD8 T cells transduced with a bicistronic construct encoding Thy1.1 alone or Thy1.1 and nSrebp2 (right). P14 CD8 T cells from the kidney, liver, WAT, and SI were gated on the IV population (h and i). Data are mean +/− s.e.m. and representative of at least two independent experiments, with a total of n=2 (a), n=4 (b-e), n=5 (f), n=6 (WT) and n=7 (Scap KO) (g and h), n=4 (i and j) mice and n=2 (d) cell replicates. Two-sided unpaired (a, d, g, and h) and paired (j) t-Test. *P<0.05, **P<0.01, ***P< 0.005. Two-sided one-sample t-Test (i) #P<0.05, ##P<0.01, ###P< 0.005. Two-way ANOVA (h) ##P<0.01.
Extended Figure 4.
Extended Figure 4.. Limited effect of Srebp2 on transcriptional programs of CD8 T cell differentiation.
a, Srebf2 expression values from the bulk ULI-RNAseq analysis of shRNAmir control (shCd19) and Srebf2 shRNAmir P14 CD8 T cells from the spleen, kidney, liver, and SI from day 7 and 14 after LCMV infection. b, Mevalonate/cholesterol synthesis pathway GSVA scores from the bulk ULI-RNAseq analysis of shRNAmir control (shCd19) and Srebf2 shRNAmir P14 CD8 T cells from the spleen, kidney, liver, and SI from day 7 and 14 after LCMV infection. c, Unsupervised hierarchically clustered heatmap of mevalonate/cholesterol synthesis pathway gene expression values from the bulk ULI-RNAseq analysis of shRNAmir control (shCd19) and Srebf2 shRNAmir P14 CD8 T cells from the spleen, kidney, liver, and SI from day 7 and 14 after LCMV infection. d, Core TRM GSVA scores from the bulk ULI-RNAseq analysis of shRNAmir control (shCd19) and Srebf2 shRNAmir P14 CD8 T cells from the spleen, kidney, liver, and SI from day 7 and 14 after LCMV infection. e, Circulating GSVA scores from the bulk ULI-RNAseq analysis of shRNAmir control (shCd19) and Srebf2 shRNAmir P14 CD8 T cells from the spleen, kidney, liver, and SI from day 7 and 14 after LCMV infection. f, Volcano plots of differentially expressed genes between shCd19 and shSrebf2 SI P14 CD8 T cells at days 7 and 14 after LCMV infection, adjusted (adj) p-value. P14 CD8 T cells from the kidney, liver and SI were gated on the IV population (a-f). TE were defined as KLRG1highCD127low P14 CD8 T cells. Data are mean +/− s.e.m.. (a, b, d, and e) from one experiment with n=2–3 (a-f), where every sample is 1×10³ cells pooled from 2~3 mice. Two-sided unpaired t-Test (a, b, d, and e), and Deseq2 DEG testing with Benjamini-Hochberg multiple test correction. *P<0.05, **P<0.01, ***P< 0.005.
Extended Data Figure 5.
Extended Data Figure 5.. SI TRM uptake and sense dietary cholesterol.
a, Quantification by flow cytometry of in vivo incorporation of Bodipy-cholesterol on indicated cell populations after 10 minutes after oral administration of Bodipy-cholesterol to memory P14 mice. b, Quantification by flow cytometry of incorporation of Bodipy-LDL on indicated cell types of the spleen 20 minutes (min) after IV delivery to memory P14 mice. c, Quantification of intracellular cholesterol by filipin staining in Tet+ populations of CD8 T cells for various tissues >30 days post LCMV infection measured by imaging flow cytometry. d, Gene expression analysis by qPCR of selected Srebp2 targets on CD8 T cells from the spleen and SI of mice on regular chow or subjected to low and high cholesterol-containing diets. e, Experimental design to measure transcriptional changes induced by dietary cholesterol on established SI TRM by ULI-RNAseq, f, SI TRM frequencies from total CD8 T cells after 7 days of dietary intervention. g, Food consumption per day per mouse subjected to a low or high-cholesterol diet. h, Bodyweight of mice subjected to low or high cholesterol-containing diets. i, Total cholesterol in serum in mice subjected to low or high cholesterol-containing diets. j, Volcano plot of differentially expressed genes in SI TRM from mice fed a high vs a low cholesterol-containing diet. k, Mevalonate/cholesterol synthesis GSVA scores in SI TRM from mice fed a high versus low cholesterol-containing diet. l, Gene pathway analysis of top upregulated and top downregulated genes between SI TRM from mice fed a high versus low cholesterol-containing diet (MsigDb, Hallmark gene sets). P14 CD8 T cells and CD8β+/CD44high/Tet+ from the kidney, liver and SI were gated on the IV population (a, b, c, e, f, j, k, and l). Data are mean +/− s.e.m. and representative of at least two independent experiments, with a total of n=4 (a), n=3 (b, d), n=5 (c), n=3 (f) mice, or pooled from at least two independent experiments with a total of n=5–10 (g-i) mice, or performed once (j-l) with a total of n=3 samples each sample is 1×10³ SI TRM pooled from 2~3 mice (j, k). Two-sided unpaired t-Test (a, b, d, f, i, and k), and Deseq2 DEG testing with Benjamini-Hochberg multiple test correction (j). *P<0.05, **P<0.01, ***P< 0.005.
Extended Data Figure 6.
Extended Data Figure 6.. Mevalonate/cholesterol synthesis pathway intermediates sustain the production of non-steroidal metabolites.
a, The mevalonate/cholesterol synthesis pathway with adjacent and downstream metabolic routes. Enzymes not included in the first CRISPR/Cas9-mediated loss-of-function screen in grey, downstream products and/or fates of cholesterol are boxed, key measured metabolites in bold, non-steroidal metabolites in blue, key enzymes are bold and colored by in vivo effect of deletion in P14 CD8 T cells, gain-of-function in red, loss-of-function in blue, dashed lines indicate indirect or unknown mode of regulation. b, Abundance of 4-hydroxybenzaldehyde profiled by LC-MS/MS of ex vivo populations of P14 cells 13 days after LCMV infection. c, Tandem mass spectra matching against commercial standards of 4-hydroxybenzaldehyde. Tandem mass spectra derived from the most abundant ion for each compound: m/z = 121.0295 for 4-hydroxybenzaldehyde [M-H], black spectra are derived from cell lysate, red mirrored spectra from commercial standard. d, CRISPR/Cas9-mediated indel efficiency of the Hpd sgRNA construct on sorted transduced P14 cells before adoptive transfer. e, CRISPR/Cas9-mediated indel efficiency of the Fdft1 sgRNA construct on sorted transduced P14 CD8 T cells before adoptive transfer. f, Gini index scores of sgRNA representation in each library. g, Schematic illustration of the contribution of mevalonate/cholesterol pathway intermediates to non-steroidal products. h, Quantification of Pdss2 mRNA by qPCR in transduced Empty and Pdss2 OE P14 CD8 T cells. Data are mean +/− s.e.m. (b and h), and representative of at least two independent experiments (d, e, and h), with a total of n=2 (d, e), and n = 3 (h) cell replicates, or one experiment (b), with n=3 (SI), n=4 (TN), and n=5 (rest) (b) samples, where each sample contains cells pooled from 2 to 5 mice. Two-sided unpaired t-Test (b, d, e and h). *P<0.05, **P<0.01, ***P< 0.005.
Extended Data Figure 7.
Extended Data Figure 7.. Increased production of non-steroidal products of the mevalonate/cholesterol synthesis pathway is a common requirement between SI TRM and TIL.
a, Dimensionality reduction plot by UMAP of P14 CD8 T cells profiled from spleens and subcutaneously implanted MC38-GP33–41 tumors by scRNAseq 7 days after ACT. b, Mevalonate/cholesterol synthesis signature values and expression of indicated genes in P14 CD8 T cells from the spleen and MC38-GP33–41 tumors profiled by scRNAseq. MAGIC-imputed gene values are shown. c, Hierarchically clustered heatmap of scaled averaged gene expression values by cluster of P14 cells profiled from spleens and MC38-GP33–41 tumors by scRNAseq 7 days after adoptive transfer. d, Dimensionality reduction plot by UMAP of CD8 T cell metaclusters (left) with “meta.cluster.coarse” labels and hierarchically clustered heatmap of mevalonate/cholesterol synthesis pathway scores grouped by “meta.cluster.coarse” labels and cell type. NPC, nasopharingeal carcinoma, ESCA, esophageal cancer, LC, lung cancer, HCC, hepatocellular carcinoma, CHOL, cholangiocarcinoma, RC, renal carcinoma, CRC, colorectal cancer, AML, acute myeloid leukemia, BCL, B-cell lymphoma, MM, multiple myeloma, HNSCC, head and neck squamous cell carcinoma, THCA, thyroid carcinoma, MELA, melanoma, BCC, basal cell carcinoma, SCC, squamous cell carcinoma, BRCA, breast cancer, STAD, stomach adenocarcinoma, PACA, pancreatic cancer, OV, ovarian cancer, FTC, fallopian tube carcinoma, UCEC, uterine corpus endometrial carcinoma. EMRA, effector memory CD45RA+, mem, memory. e, sgRNA library heterogeneity reported as Gini Index values. f, CRISPR/Cas9-mediated indel efficiency of the Pdss2 sgRNA construct on sorted transduced P14 CD8 T cells. g, Frequency of PD1highTim3high and PD1highTim3low subpopulations for sgCd19 and sgFdft1 Cas9 P14 CD8 T cells in MC38-GP33–41 tumors at day 5–7 after adoptive transfer. h, Frequency of PD1highTim3high and PD1highTim3low subpopulations for Empty and Pdss2 OE P14 CD8 T cells in MC38-GP33–41 tumors at day 5–7 after adoptive transfer. i, Quantification of gene expression by qPCR of control (shNT) and Fdft1 deficient (shFdft1) P14 CD8 T cells before adoptive transfer. j, Restimulation capacity of control (shNT) and Fdft1 deficient (shFdft1) P14 TIL 4 days after in vivo transfer treated with GP33–41 peptide ex vivo. k, MC38-GP33–41 tumor growth curves of mice receiving ZAA or vehicle. l, Survival of mice implanted with MC38-GP33–41 tumors receiving ZAA or vehicle. m, MC38-GP33–41 tumor growth curves of mice receiving ZAA in combination with CD8 T cell depletion. Data are mean +/− s.e.m.. (g, h, i, j, k, and m), raw values (d), geometrical distributions of single-cell gene expression values (b) or averaged gene expression (c and e) and pooled or representative of at least two independent experiments, with a total of n=2 (f) cell replicates, and n=8 (g), n=9 (h), n=3 (i), n=10 (j), n=12/group (k, l), n=5/group (m) mice. Two-sided unpaired t-Test (b, f and i). Log-rank test (l). Two-way ANOVA (m). *P<0.05, **P<0.01, ***P< 0.005.
Extended Data Figure 8.
Extended Data Figure 8.. A requirement for the mevalonate/cholesterol synthesis enzymes for TIL persistence and heightened antitumor activity in a melanoma model.
a, GSEA of the mevalonate/cholesterol synthesis pathway in genes pre-ranked by their impact on TIL accumulation in B16-OVA tumors from a published CRISPR/Cas9-mediated loss-of-function screen. b, Dimensionality reduction plot by UMAP of WT and Regnase-1 KO OT-I cells profiled from MC38-GP33–41 tumors by scRNAseq 7 days after adoptive transfer (left) and unsupervised hierarchical clustering heatmap of selected genes related to CD8 T cell cytotoxicity (Ifng) stemness (Tcf7), proliferation (Mki67), and the mevalonate/cholesterol synthesis pathway (Srebf2, Hmgcs1, Fdft1, Hmgcr, and Ldlr) grouped by cell type and cluster. c, Comparison of the effect of targeting the 50 genes of the mevalonate/cholesterol pathway included in our targeted screen in WT TIL or Regnase-1 KO TIL (sgZc3h12a) from a published CRISPR/Cas9-mediated loss-of-function screen in B16 melanoma tumors. Relevant enzymes are labeled.
Figure 1.
Figure 1.. Functional genetics in vivo, metabolomics and transcriptional analysis of ex vivo populations of memory CD8 T cells identify a graded upregulation of a Srebp2-dependent metabolic programming across TRM.
a, Experimental design and data analysis approach for an in vivo CRISPR/Cas9-mediated loss-of-function screen of metabolic regulators of memory CD8 T cell differentiation in LCMV infection. b, Unsupervised hierarchical clustering heatmap of averaged gene essentiality scores for significant genes in SI TRM in both libraries. c, Unsupervised hierarchical clustering of scaled averaged enrichment scores of significant metabolic signatures in SI TRM in both libraries. d, PCA of relative metabolite abundances of indicated P14 CD8 T cells 13 days after LCMV infection. e, Abundance of selected identified annotated metabolites of mevalonate/cholesterol synthesis pathway on indicated P14 CD8 T cells. TN, Naïve. f, Mevalonate/cholesterol synthesis pathway GSVA scores from RNAseq analysis of indicated P14 CD8 T cells, GSE107278. g, Mevalonate/cholesterol synthesis pathway GSVA scores from RNAseq analysis of indicated memory P14 CD8 T cells (>30 days pi), GSE182276. SG, salivary gland. WAT, white adipose tissue. h, PageRank scores and gene expression of Srebp2 and Runx3 in memory P14 CD8 T cells, GSE182276. i, Representative detection of Srebp2 and CD103 by immunofluorescence of congenically labeled memory P14 CD8 T cells. Scale bar, 20μm. P14 CD8 T cells recovered from tissues other than the spleen were pregated on IV populations. Images are representative of 2 independent experiments (i). Data are mean +/− s.e.m., and representative of at least two independent experiments (f, g) with a total of n=2 (day 35) and n=3 (day 7) (f), n=2 (liver and WAT), n=3 (SG, kidney, and SI), n=4 (blood), and n=5 (spleen) (g) mice, or one experiment (a, b, c, d and e), with a total of n=7 (Lib7) and n=9 (Lib5) mice pooled per library (a, b, and c), and n=3 (SI), n=4 (TN and kidney), and n=5 (rest) (d and e) samples, where each sample contains cells pooled cells from 2 to 5 mice. Two-sided un-paired t-Test (e, f, and g). *P<0.05, **P<0.01, ***P< 0.005.
Figure 2.
Figure 2.. An Srebp2-dependent metabolic program controls SI TRM formation.
a-c, Ratio of transduced transferred P14 CD8 T cells (a and b), or P14 Cas9eGFP CD8 T cells (b), harvested from indicated tissues at indicated times after LCMV (a and b), or LM-GP33–41 (c) infection, evaluated by flow cytometry. d, Number of total Tet+ cells in the spleen, and total Tet+ TRM cells in the SI, kidney, and liver of Scapfl/fl Cd4-Cre+ and Scapwt Cd4-Cre+ at indicated times after LCMV infection. e, LCMV titers measured by qPCR in the SI of WT and Scap KO mice previously infected with LM-GP33–41 3days after LCMV rechallenge. NP, nucleoprotein. GP, glycoprotein. f, Number of total P14 CD8 T cells isolated from indicated tissues at days 7 and 21 after LCMV infection in mice treated with vehicle or Lovastatin (Lova). g, TRM scores of human CD8 T cells of the blood and SI profiled by scRNAseq grouped by statin use; no statins = 8 donors, statins = 5 donors. h, Ratio of total P14 CD8 T cells from indicated tissues in mice fed high versus low-cholesterol-containing diet. Data are geometrical distributions of single-cell gene expression values with median values (g) or mean +/− s.e.m. and representative of two independent experiments (a, b, d, e and f), or pooled from two independent experiments (c, e, f, and h), with a total of n=7 (a), n=7 (b), n=7 (c), n=8 (d), n=6 in WT and n=7 in Scap KO (e), n=9 (day 7) and n=4 (day 21) (f), and n=3 (mLN, kidney, and liver day 7, and liver day 40), and n=6 (rest) (h) mice. Two-sided unpaired (f), and paired t-Test, (a, b, c, d, f, g, and h), two-sided Mann-Whitney U Test (e). *P<0.05, **P<0.01, ***P< 0.005. Two-sided one-sample t-Test (a-c, and h) #P<0.05, ##P<0.01, ###P< 0.005. Two-way ANOVA (d) ##P<0.01.
Figure 3.
Figure 3.. Non-steroidal products of the mevalonate/cholesterol synthesis pathway mediate TRM adaptations.
a, Unsupervised hierarchical clustered heatmap of gene essentiality scores for genes related to the mevalonate/cholesterol synthesis pathway in the cellular populations profiled in our in vivo CRISPR/Cas9-mediated loss-of-function screen. Blue and red denote positive and negative regulators of memory CD8 T cell formation, respectively. b,c, Ratio of indicated transduced transferred P14 Cas9eGFP CD8 T cells, sgHpd (b) and sgFdft1 (c), harvested from indicated tissues at indicated times after LCMV infection, evaluated by flow cytometry. d, Targeted in vivo CRISPR/Cas9-mediated loss-of-function screen of mediators of the effect of Fdft1 deletion on CD8 T cell memory formation. Data visualization represents the enrichment as Log2FC of sgRNA frequencies in sgCD19 outputs versus sgCd19 input (x axis), and sgFdft1 outputs versus sgFdft1 input (y axis), for each effector and memory CD8 T cell subset. e, Ratio of transduced transferred P14 CD8 T cells harvested from indicated tissues at indicated times after LCMV infection, evaluated by flow cytometry. f, Total cell numbers of Empty and Pdss2 OE SI IEL P14 CD8 T cells in mice fed low or high cholesterol-containing diets. Data are mean +/− s.e.m.. and representative or pooled from at least two independent experiments (b, c, e, and f), or one experiment (d), with a total of n=7 (day 7) and n=9 (day 14) (b, c), n=9 (c), n=6 (d), n=6 (day 7) and n=7 (day 14) (e), n=4 (f) mice. Two-sided unpaired t-Test (b, c, e, and f) *P<0.05, **P<0.01, ***P< 0.005. Two-sided one-sample t-Test (b, c, and e) #P<0.05.
Figure 4.
Figure 4.. Pdss2 expression is required and sufficient to promote mitochondrial respiration and CoQ synthesis in CD8 T cells.
a, Oxygen consumption rate (OCR) of in vitro activated shCd19 and shSrebf2 CD8 T cells subjected to the MitoStress test (Seahorse). Oligomycin (O), FCCP (F), Rotenone/Antimycin A (R/A). b, Oxygen consumption rate (OCR) of in vitro activated CD8 T cells treated with statin (simvastatin) in combination with mevalonolactone (MVA) or cholesterol (Chol.) and subjected to the MitoStress test (Seahorse). c, OCR of in vitro-activated sgCd19 and sgPdss2 Cas9eGFP CD8 T cells subjected to the MitoStress test (Seahorse). d, OCR of in vitro activated sgCd19 and sgFdft1 Cas9eGFP CD8 T cells subjected to the MitoStress test (Seahorse). e, OCR of in vitro activated sgCd19, sgFdft1, and sgFdft1/Pdss2 Cas9eGFP CD8 T cells subjected to the MitoStress test (Seahorse). f, OCR of in vitro activated empty vector control (Empty) and Pdss2 OE CD8 T cells subjected to the MitoStress test (Seahorse). g, Quantification of CoQ and demethoxyubiquinone (DMQ) species in in vitro activated sgCd19 and sgFdft1 Cas9eGFP CD8 T cells normalized to total protein content. h, Quantification of CoQ and DMQ species in in vitro activated Empty and Pdss2 OE CD8 T cells normalized to total protein content. Data are mean +/− s.e.m. and representative of at least two independent experiments (a-h), with a total of n=4 (a), n=5 (b), n=3 (c), n=2 (e), n=3 (f), n=3 (g), n=5 (h) cell replicates. Two-way ANOVA (a, c, d, e, and f). Two-sided unpaired t-Test (b, g, and h) *P<0.05, **P<0.01, ***P< 0.005.
Figure 5.
Figure 5.. Increased production of non-steroidal products of the mevalonate/cholesterol synthesis pathway is a common requirement for SI TRM and TIL.
a, Targeted in vivo screen of mevalonate/cholesterol synthesis pathway genes for SI TRM formation in LCMV infection, and CD8 T cell accumulation in dLN and MC38-GP33–41 tumors. b, Venn diagram of significant genes (fdr < 0.01; dLN and TIL, fdr < 0.01 and Log2FC < −2, SI TRM) from (a). c, Log2FC of sgRNA frequencies for each screen from a. d, Metabolic pathway with relevant genes from a. e-g, Ratio of indicated transduced P14 CD8 T cells (e,g) or P14 Cas9eGFP CD8 T cells (f) in indicated tissues 5–7 days after adoptive cell transfer (ACT). h, MC38-GP33–41 tumor growth curves of mice receiving indicated transduced P14 Cas9eGFP CD8 T cells. i, Cell frequencies and total numbers of transduced P14 Cas9eGFP CD8 T cells in MC38-GP33–41 tumors, dLN, and spleens 4 days after ACT. j, B16-GP33–41 tumor growth curves in mice adoptively transferred with indicated transduced P14 CD8 T cells. k, Cell frequencies in Empty and Pdss2 OE P14 CD8 T cells in MC38-GP33–41 tumors. l, B16-GP33–41 tumor growth curves of mice receiving indicated treatments. m, Proposed model of the Srebp2-dependent metabolic programming of SI TRM and TIL. Data are mean +/− s.e.m. and representative or pooled from of at least two independent experiments (e-l), with a total of n=4 (SI TRM) and n=5 (tumor) (a-c), n=9 (e), n=8 (f), n=8 (g), n=3 (no transfer), n=15 (sgCd19), and n=16 (sgFdft1) (h), n=8 (i), n=9 (sgCd19) and n=7 (sgPdss2) (j), n=13 (k), n=10 (veh) and n=13 (rest) (l) mice, and one experiment (a-c), with n=3–5 mice pooled in each sample (a-c). Two-sided unpaired (f and i) and paired (e, g, and k) t-Test. Two-way ANOVA (h and j). Pearson correlation (r) (c). Fisher’s exact test (l). *P<0.05, **P<0.01, ***P< 0.005. Two-sided one-sample t-Test (e and g) #P<0.05, ###P<0.005.

Similar articles

Cited by

References

    1. Masopust D & Soerens AG Tissue-Resident T Cells and Other Resident Leukocytes. Annu Rev Immunol (2019) doi:10.1146/annurev-immunol-042617-053214. - DOI - PMC - PubMed
    1. Park SL, Gebhardt T & Mackay LK Tissue-Resident Memory T Cells in Cancer Immunosurveillance. Trends Immunol 40, 735–747 (2019). - PubMed
    1. Byrne A et al. Tissue-resident memory T cells in breast cancer control and immunotherapy responses. Nature Reviews Clinical Oncology Preprint at 10.1038/s41571-020-0333-y (2020). - DOI - PubMed
    1. Konjar Š et al. Mitochondria maintain controlled activation state of epithelial-resident T lymphocytes. Sci Immunol 3, 2543 (2018). - PMC - PubMed
    1. Steinert EM et al. Quantifying Memory CD8 T Cells Reveals Regionalization of Immunosurveillance. Cell 161, 737–749 (2015). - PMC - PubMed

Methods References

    1. O’Connor A, Quizon PM, Albright JE, Lin FT & Bennett BJ Responsiveness of cardiometabolic-related microbiota to diet is influenced by host genetics. Mamm Genome 25, 583–599 (2014). - PMC - PubMed
    1. Anderson KG et al. Intravascular staining for discrimination of vascular and tissue leukocytes. Nature Protocols 2013 9:1 9, 209–222 (2014). - PMC - PubMed
    1. McCausland MM & Crotty S Quantitative PCR technique for detecting lymphocytic choriomeningitis virus in vivo. J Virol Methods 147, 167–176 (2008). - PMC - PubMed
    1. Bankhead P et al. QuPath: Open source software for digital pathology image analysis. Scientific Reports 2017 7:1 7, 1–7 (2017). - PMC - PubMed
    1. Bolger AM, Lohse M & Usadel B Trimmomatic: a flexible trimmer for Illumina sequence data. Bioinformatics 30, 2114–2120 (2014). - PMC - PubMed

MeSH terms