. 2023 Sep;621(7978):404-414.
doi: 10.1038/s41586-023-06496-5. Epub 2023 Aug 30.

Epitope editing enables targeted immunotherapy of acute myeloid leukaemia

Affiliations

Epitope editing enables targeted immunotherapy of acute myeloid leukaemia

Gabriele Casirati et al. Nature. 2023 Sep.

Abstract

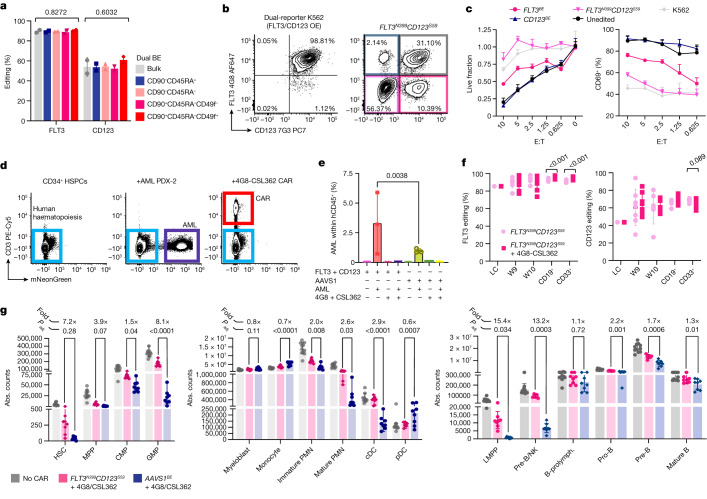
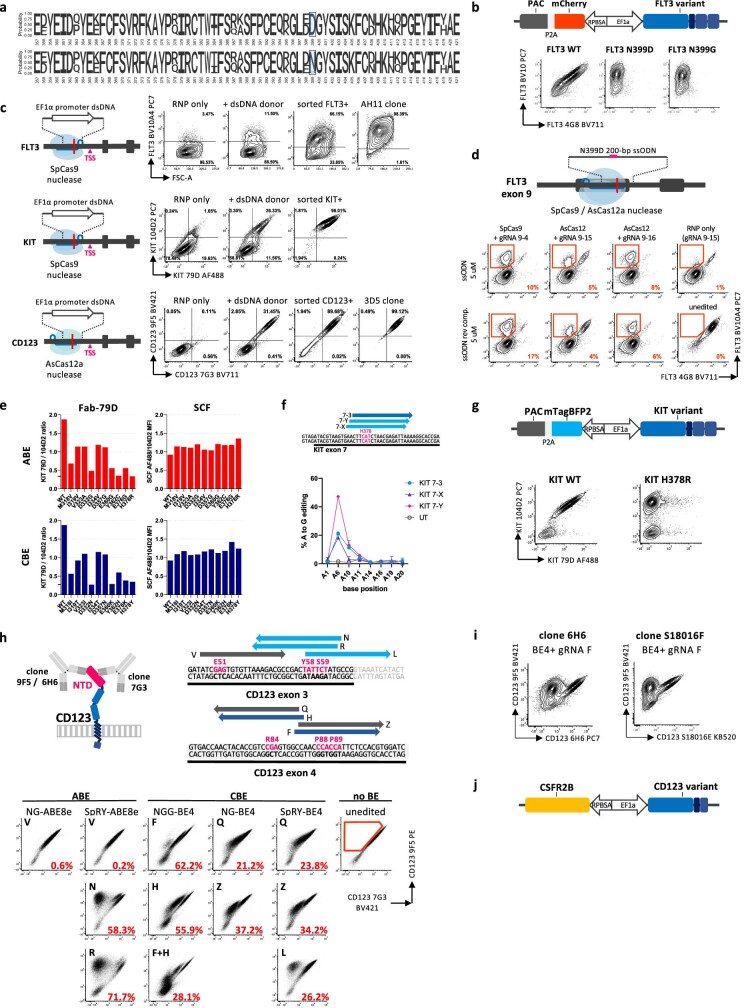
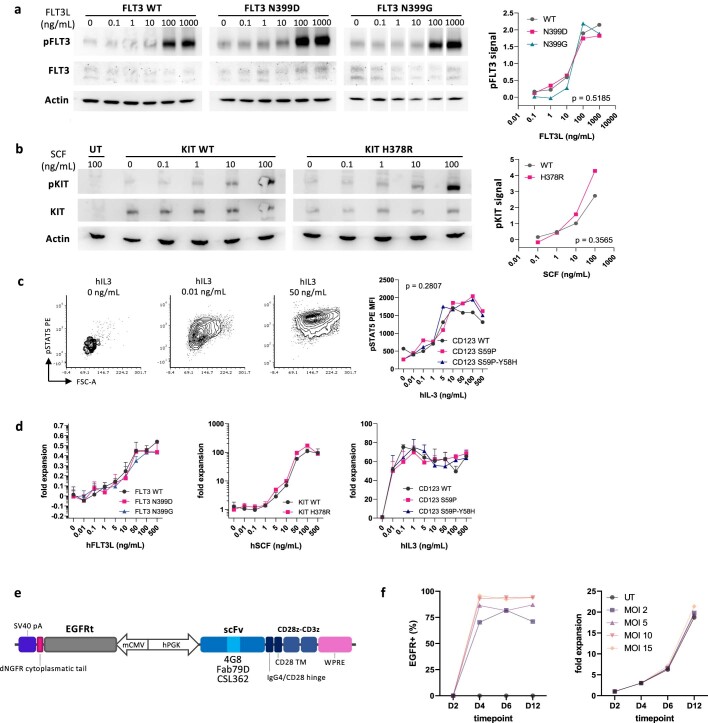
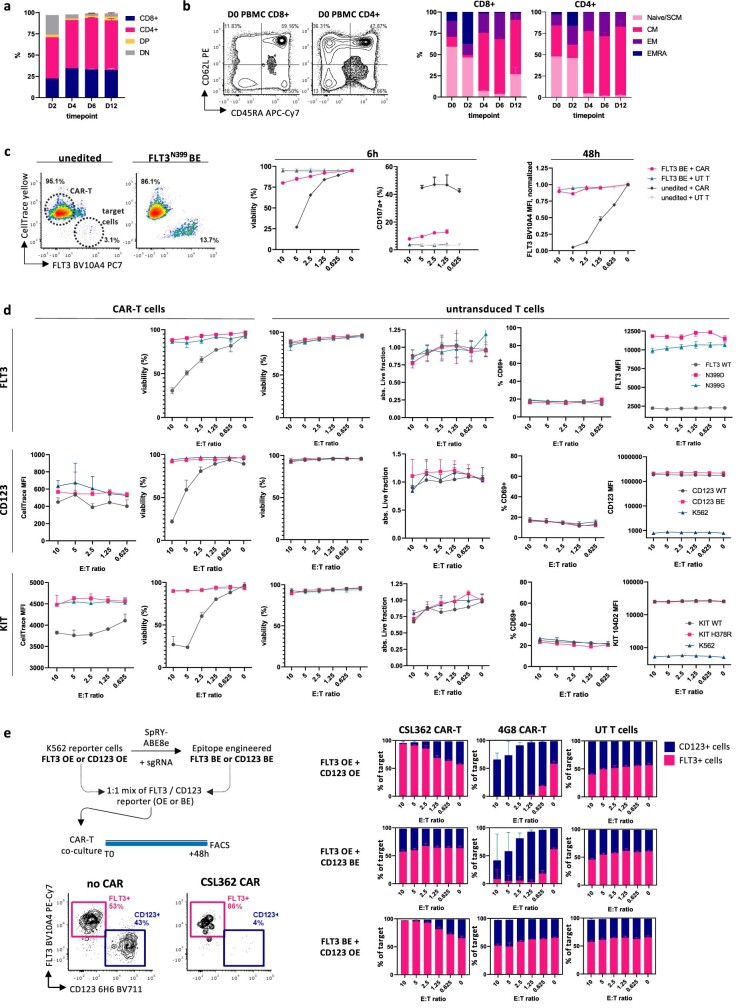
Despite the considerable efficacy observed when targeting a dispensable lineage antigen, such as CD19 in B cell acute lymphoblastic leukaemia1,2, the broader applicability of adoptive immunotherapies is hampered by the absence of tumour-restricted antigens3-5. Acute myeloid leukaemia immunotherapies target genes expressed by haematopoietic stem/progenitor cells (HSPCs) or differentiated myeloid cells, resulting in intolerable on-target/off-tumour toxicity. Here we show that epitope engineering of donor HSPCs used for bone marrow transplantation endows haematopoietic lineages with selective resistance to chimeric antigen receptor (CAR) T cells or monoclonal antibodies, without affecting protein function or regulation. This strategy enables the targeting of genes that are essential for leukaemia survival regardless of shared expression on HSPCs, reducing the risk of tumour immune escape. By performing epitope mapping and library screenings, we identified amino acid changes that abrogate the binding of therapeutic monoclonal antibodies targeting FLT3, CD123 and KIT, and optimized a base-editing approach to introduce them into CD34+ HSPCs, which retain long-term engraftment and multilineage differentiation ability. After CAR T cell treatment, we confirmed resistance of epitope-edited haematopoiesis and concomitant eradication of patient-derived acute myeloid leukaemia xenografts. Furthermore, we show that multiplex epitope engineering of HSPCs is feasible and enables more effective immunotherapies against multiple targets without incurring overlapping off-tumour toxicities. We envision that this approach will provide opportunities to treat relapsed/refractory acute myeloid leukaemia and enable safer non-genotoxic conditioning.


Conflict of interest statement

G.C. and P.G. are listed as inventors on patent applications related to this work that are owned and managed by the Boston Children’s Hospital and Dana-Farber Cancer Institute. S.A.A. has been a consultant and/or shareholder for Neomorph Inc, Imago Biosciences, Cyteir Therapeutics, C4 Therapeutics, Nimbus Therapeutics and Accent Therapeutics. S.A.A. has received research support from Janssen and Syndax. S.A.A. is named as an inventor on a patent application related to MENIN inhibition WO/2017/132398A1. J.A.M. is a founder, equity holder and advisor to Entact Bio, serves on the scientific advisory board of 908 Devices and receives sponsored research funding from Vertex, AstraZeneca, Taiho, Springworks and TUO Therapeutics. The other authors declare no competing interests.

Figures

Fig. 1
Fig. 1. Epitope engineering can be achieved by base editing.
a, Type III receptor tyrosine kinases bound to control and therapeutic antibodies. AlexaFluor 488 (AF488)- or AF647-conjugated ligands were used to assess binding affinity. Protein models are based on Protein Data Bank 3QS9 (FLT3) and 1IGT (Ig). mAb, monoclonal antibody. b, Loss of 4G8 and Fab-79D binding to FLT3 with 16 amino acid substitutions or KIT with 10 amino acid substitutions, respectively (top). Bottom, ligand assay for WT and mutated receptor variants. Mut., mutation. c, Western blot analysis of phosphorylated FLT3 at Tyr589–591 and KIT at Tyr719 on receptor variants. d, FLT3 combinatorial library. Left, the Sleeping Beauty plasmid expressing FLT3 with human or mouse codons at 16 positions (red) within ECD4. Middle, K562 cells were transduced with the FLT3 library. 4G8and 4G8+ fractions were sorted using fluorescence-activated cell sorting (FACS) and sequenced by next-generation sequencing (NGS). Right, the relative amino acid frequency at positions 384–413. e, KIT epitope mapping. Left, the Sleeping Beauty plasmid containing degenerated codons (NNN) at each position (red) of ECD4. Middle, K562 cells were transduced with the KIT library. Fab-79D and Fab-79D+ fractions were FACS-sorted and sequenced. Right, the log-transformed fold change in amino acid substitutions enriched in Fab-79D cells (positions 314–381). f, gRNAs targeting FLT3 codon N399 (left). Dark blue, NGG-PAM; grey, NGN-PAM; light blue, NRN-PAM. The PAM is indicated by the arrowhead. Right, plots of K562 reporter cells electroporated with base-editor plasmids (NG-ABE8e or SpRY-ABE8e). The percentage of 4G8 cells is reported (gating is shown on the unedited sample). g, Affinity of therapeutic antibodies to receptor variants measured on K562 (for FLT3 (left) and CD123 (right)) or NIH-3T3 (for KIT (middle)) cells. Affinity curves fitted to the MFI of therapeutic monoclonal antibodies normalized to control monoclonal antibodies, after background subtraction. n = 3. Statistical analysis was performed using likelihood ratio tests. h, FLT3, SCF and IL-3 affinity. Cell lines expressing FLT3 (left), CD123 (right) and KIT (middle) receptor variants were incubated with fluorescent ligands and evaluated using flow cytometry. An affinity curve was fitted to the ligand’s MFI. Statistical analysis was performed using likelihood ratio tests. n = 3 (FLT3 and CD123) and n = 4 (KIT). Source Data
Fig. 2
Fig. 2. Epitope-engineered variants are resistant to CAR T cells.
a, FLT3N399D or FLT3N399G cells avoid 4G8-CAR-mediated killing. K562 cells expressing FLT3 variants were cultured with 4G8-CAR at different effector:target ratios (E:T). Left, FACS analysis of K562 cells expressing either FLT3 WT, N399D or N399G, after 48 h of co-culture. T cells and targets are identified by CD3 and FLT3, respectively. From left to right, the fraction of live target cells (absolute (abs.) counts of annexin V7-AAD cells) relative to E:T = 0; T cell activation by CD69+ (%) and surface expression of FLT3 by BV10A4 staining on residual live targets, normalized (norm.) to E:T = 0. The E:T ratio is reported on the x axis. Data are mean ± s.d. n = 4. Statistical analysis was performed using two-way analysis of variance (ANOVA); P values of the comparisons between each condition are reported. b, KITH378R cells avoid Fab-79D-CAR killing. Left, plots of K562 cells expressing wild-type (WT) KIT, H378R or unmodified (KIT) (K562 WT) after 48 h of co-culture with Fab-79D CAR T cells. T cells and targets are identified by CD3 and KIT, respectively. From left to right, the fraction of live target cells; T cell activation on the basis of CD69 staining; and surface expression of KIT by 104D2 on residual live targets, normalized to E:T = 0. The E:T ratio is reported on the x axis. Data are mean ± s.d. n = 4. Statistical analysis was performed using two-way ANOVA. c, CD123S59 base-edited cells are resistant to CSL362 CAR T cells. Left, representative plots of CD123-reporter cells, either unmodified (K562 WT) or base-edited, or CD123 K562 cells after 48 h of co-culture with CSL362-CAR. T cells and targets are identified by CD3, CD4 and CD8, and CD123, respectively. From left to right, the fraction of live target cells; T cell activation on the basis of CD69 staining; and surface expression of CD123 on the basis of staining with the 6H6 control antibodies on residual target cells. The E:T ratio is reported on the x axis. Data are mean ± s.d. n = 6. Statistical analysis was performed using two-way ANOVA. Source Data
Fig. 3
Fig. 3. Epitope editing does not affect stemness and differentiation of HSPCs.
a, The editing windows within FLT3, KIT and CD123 sgRNAs after electroporation with different doses of mRNA. Data are mean ± s.d. b, Editing efficiencies of bulk CD34+ or FACS-sorted subsets. The gating strategy is reported in Supplementary Fig. 2c. n = 4 biological replicates, n = 3 for KIT. Data are mean ± s.d. Statistical analysis was performed using one-way ANOVA. c, The CD90/CD45RA composition of epitope-edited HSPCs measured by FACS analysis within the CD34+CD133+ subset. Data are mean ± s.d. The sample size is reported within the bars. d, In vitro 4G8-CAR killing assay of FLT3N399 edited HSPCs. The fraction of persisting live cells (left) and the viability on the basis of annexin V and 7-AAD staining (right) of CD34+CD45RA+ cells, 48 h after co-culture with 4G8-CAR or untransduced T cells at different effector:target (E:T) ratios. Data are mean ± s.d. n = 4. Statistical analysis was performed using two-way ANOVA. e, In vitro CSL362-CAR killing assay of CD123S59 edited HSPCs. The fraction of persisting live CD90+ cells (left) and the viability of CD34+ cells on the basis of annexin V and 7-AAD staining (right), 48 h after co-culture with CSL362-CAR or untransduced T cells at different E:T ratios. n = 8 on 2 donors. Statistical analysis was performed using two-way ANOVA. f, The fraction of absolute live CD34+ cells (relative to the no-antibody control) of KITH378 or AAVS1BE HSPCs after 48 h of culture with Fab-79D monoclonal antibodies. Data are mean ± s.d. n = 6 on 2 donors. Statistical analysis was performed using two-way ANOVA. g, RNA-seq analysis of epitope-edited CD34+ HSPCs with or without stimulation. log-scale scatter plot of the mean gene expression values of the AAVS1 control and FLT3-, KIT- and CD123-edited cells, either at the baseline (top) or after stimulation with FLT3L, SCF or IL-3 (bottom). n = 3 biological replicates. Unstim., unstimulated. h, The absolute counts of total CD34+ and CD90+CD45RA cells (n = 4; top right) and of myeloid and erythroid colonies (n = 2; bottom right) of edited HSPCs. Left, representative colony-forming-unit (CFU) microphotographs. i, Primary and secondary xenotransplantation of FLT3N399 or AAVS1BE HSPCs. Top, human engraftment (hCD45+) by flow cytometry analysis in primary recipients. Data are mean ± s.d. Statistical analysis was performed using two-way ANOVA. n = 7 (FLT3N399) and n = 4 (AAVS1BE). Bottom, FLT3 editing was measured on peripheral blood, haematopoietic organs (BM and spleen (SP)) or CFUs in primary and secondary transplants. Data are mean ± s.d. Statistical analysis was performed using one-way ANOVA. LC, liquid culture; SP, spleen; W, week. Source Data
Fig. 4
Fig. 4. 4G8-CAR eradicates AML PDX while sparing FLT3N399 HSPC progeny.
a, Co-engraftment experiments of FLT3N399 or AAVS1BE HSPCs with AML PDX-1, treated with 4G8-CAR. b, FLT3 editing was measured on liquid culture, peripheral blood (weeks 8–9) and sorted CD33+CD19+ BM cells. Statistical analysis was performed using multiple unpaired t-tests. Data are mean ± s.d. c, Representative FACS plots of haematochimeric mouse BM, pregated on hCD45+. CAR T cells and AML were identified by CD3+ and mNeonGreen+, respectively. Data are mean ± s.d. d, FACS plots, gated on hCD45+CD3mNeonGreen, showing the depletion of B cells by 4G8-CAR. NG, mNeonGreen. e, The percentage of CD3+ cells within hCD45+mNeonGreen BM cells. Data are mean ± s.d. Statistical analysis was performed using one-way ANOVA. f, The percentage of AML cells within hCD45+CD3 BM cells. Data are mean ± s.d. g,h, The percentages of pre-B (CD19+CD10+CD34) (g) and pro-B (CD19+CD10+CD34+) (h) cells among hCD45+CD3mNeonGreen cells. Data are mean ± s.d. Statistical analysis was performed using one-way ANOVA, comparing FLT3N399 versus AAVS1BE. i, The composition of lineageCD34+CD38+CD10 progenitors was analysed using flow cytometry. Cells were defined as follows: GMPs (CD45RA+FLT3+), CMPs (CD45RAFLT3+) and mega-erythroid progenitors (MEPs, CD45RAFLT3). j, The GMP percentage within lineageCD34+CD38+. Data are mean ± s.d. k,l, Absolute counts of progenitors (k) and myeloid subsets (l) in the BM. Untreated mice were pooled together (grey bars), and 4G8-treated FLT3N399 and AAVS1BE mice are reported in pink and yellow, respectively. Data are mean ± s.d. The fold change in absolute counts (FLT3N399/AAVS1) for CAR-treated groups is reported. Statistical analysis was performed using one-way ANOVA comparing the FLT3N399 versus AAVS1BE conditions treated with 4G8-CARs. m, The composition of lineageCD34+CD38CD10 progenitors was determined using flow cytometry. Cells were defined as follows: HSCs (CD45RACD90+), MPPs (CD45RACD90) and lymphoid-primed MPPs (LMPPs, CD45RA+CD90). n, The LMPP percentage within lineageCD34+CD38 cells. Data are mean ± s.d. Statistical analysis was performed using one-way ANOVA. o, The absolute counts of lymphoid subsets. The fold change in absolute counts (FLT3N399/AAVS1) for CAR-treated groups is reported. Data are mean ± s.d. Statistical analysis was performed using one-way ANOVA comparing the FLT3N399 versus AAVS1BE conditions treated with 4G8-CAR. Source Data
Fig. 5
Fig. 5. Dual FLT3/CD123 epitope editing enables more effective AML immunotherapies.
a, The efficiency of multiplex FLT3N399CD123S59 editing measured on bulk HSPCs or FACS-sorted subsets. Data are mean ± s.d. Statistical analysis was performed using one-way ANOVA. b, Representative plots of dual FLT3/CD123 reporter cells showing loss of recognition by 4G8 and 7G3 monoclonal antibodies after multiplex editing. OE, overexpressed. c, Single- or dual-edited K562 reporters were FACS-sorted and co-cultured with dual-specificity FLT3/CD123 CAR T cells at different effector:target (E:T) ratios. The fraction of live target cells (left) and T cell activation (CD69+; right) are shown. Statistical analysis was performed using two-way ANOVA; the comparisons are reported in Supplementary Table 24. d, Representative plots of BM samples from mice engrafted with HSPCs only, HSPCs + PDX-2 or HSPCs + PDX-2 treated with 4G8/CSL362 CAR T cells. Plots were pregated on total hCD45+; CAR T cells were identified by CD3 and AML PDXs by mNeonGreen. e, The percentage of PDX cells within hCD45+CD3 BM cells of mice transplanted and treated as indicated. Data are mean ± s.d. Statistical analysis was performed using one-way ANOVA with correction for multiple comparisons. f, FLT3 (left) and CD123 (right) editing efficiencies measured on peripheral blood (week 9–10) and sorted CD33+ and CD19+ BM fractions at the end point. Data are mean ± s.d. Statistical analysis was performed using multiple unpaired t-tests. g, The absolute counts of progenitors (left) and myeloid (middle) and lymphoid (right) subsets in the BM. Untreated mice were pooled (grey bars), CAR-treated FLT3N399CD123S59 mice are shown in pink and CAR-treated AAVS1BE mice are shown in blue. The fold change in the absolute counts (FLT3N399CD123S59/AAVS1) for CAR-treated groups is reported above each population. Data are mean ± s.d. Statistical analysis was performed using one-way ANOVA. False-discovery rate (FDR)-adjusted P values of the comparison between the FLT3N399CD123S59 and AAVS1BE conditions treated with CAR T cells are reported. Full counts are provided in Supplementary Table 23. PMN, polymorphonucleate granulocytes; prolymph., prolymphocytes. Source Data
Extended Data Fig. 1
Extended Data Fig. 1. FLT3, KIT and CD123 epitope-engineering can be achieved by base editing.
a. Full length sequence logo of the FLT3 EC4 combinatorial library showing the amino-acid frequency at each position of ECD4 (357 to 421) in FACS-sorted 4G8- and 4G8+ cells. b. Top, design of Sleeping Beauty transposon encoding for FLT3 variants with a mCherry and puromycin N-acetyltransferase (PAC) reporter/resistance cassette. Bottom, flow cytometry plots showing loss of 4G8 recognition for N399D and N399G variants expressed in K562 cells. c. Generation of FLT3, KIT and CD123 reporter K562 cells through targeted homology-directed repair integration of a EF1α promoter upstream of the gene transcriptional start site (TSS). A dsDNA donor with 50-bp long homology arms was generated by PCR on a plasmid template encoding for a full EF1α promoter. K562 cells were electroporated with SpCas9 (FLT3, KIT) or AsCas12a nuclease (CD123) and gRNAs recognizing a region upstream of the coding sequence of each gene. 0.5 to 10 μg of dsDNA donor template was co-electroporated with Cas RNPs in 20 μL electroporation volume. Representative flow cytometry plots show the population of cells positive for the over-expressed gene, which were FACS-sorted and expanded. For FLT3 and CD123, single cell cloning of sorted cells was performed to isolate clones with the highest surface expression. All epitope-editing tests and optimization were performed on K562 reporter cells, unless otherwise specified. Dual FLT3/CD123 reporters were obtained through a second round of CD123-targeted RNP+donor electroporation on FLT3-expressing K562 cells (data shown in Fig. 6b). Similarly, triple FLT3/CD123/KIT+ K562 were generated by editing the KIT promoter in dual FLT3/CD123 reporter cells. d. Introduction of the FLT3 N399D mutation through CRISPR-Cas mediated homology directed repair. K562 reporter cells were electroporated with SpCas9 or AsCas12a nuclease, gRNAs and 200-bp ssODN template donor (or their reverse complement, rev.comp.) encoding for the N399D mutation. Additional silent mutations were included to reduce the risk of nuclease re-cutting after HDR repair. Cells were evaluated by flow cytometry 72h after editing. The percentage of FLT3+ cells (by control mAb BV10A4) but 4G8- is reported in the right bottom corner. e. Characterization of KIT mutations derived from epitope mapping. For amino-acid positions deriving from the KIT epitope mapping, substitutions that could be obtained with adenine BE (ABE, red) or cytidine BE (CBE, blue) were individually cloned in a Sleeping Beauty transposon and electroporated into HEK-293T cells. After puromycin selection, cells were stained with both Fab-79D and control Ab 104D2. The ratio between Fab-79D MFI and 104D2 MFI is reported for each mutation. To exclude variants affecting SCF binding to KIT, the same variants were incubated with AF488-conjugated SCF and control mAb 104D2 (which does not impair SCF binding). The ratio of SCF to 104D2 median fluorescence is reported in the bar plots. Horizontal lines show the reference mutation H378R. f. KIT H378R adenine base editing optimization. sgRNAs targeting codon H378 within exon 7 were co-electroporated with SpRY-ABE8e in K562 cells. Editing efficiency on gDNA is reported for each adenine within the protospacer (with position numbers relative to KIT-Y sgRNA). g. Top, design of Sleeping Beauty transposon encoding for KIT variants with a mTagBFP2 and puromycin N-acetyltransferase (PAC) reporter/resistance cassette. Bottom, flow cytometry plots showing loss of Fab79D recognition for KIT H378R expressed in HEK-293T cells. h. CD123 epitope screening by base editing. sgRNAs for targeted base editing of 7G3 contact residues were co-electroporated with 500 ng of adenine (ABE) or cytidine base editor (CBE) expression plasmids in CD123-reporter K562 cells. NGG (wild-type), NG- and SpRY- PMA-flexible Cas9 variants of the base editors were exploited to achieve on-target base deamination. The percentage of cells positive for control mAb 9F5 and negative for therapeutic clone 7G3 is reported in each plot. The unedited condition shows the gating strategy. BE4, evoAPOBEC1-BE4max. i. CD123 CBE with sgRNA-F results in loss of clone 6H6 and S18016F binding. The same conditions from the BE screening reported in Extended Data Fig. 1h were stained with CD123-targeting clones 6H6 and S18016F which have a different epitope than clone 7G3. j. Design of Sleeping Beauty transposon encoding for CD123 variants with co-expression of the common β-chain CSFR2B to allow intracellular signal transduction.
Extended Data Fig. 2
Extended Data Fig. 2. Epitope variant receptors show preserved ligand-mediated activation.
a. FLT3 epitope engineered variants preserve kinase activation. Western blot of proteins extracts from K562 cells expressing FLT3 variants by Sleeping Beauty transposase. Cells were serum-starved overnight and stimulated with different concentrations of human FLT3L for 10 min at 37 °C. pFLT3 Y589-591, total FLT3 and Actin were probed on the same lysates. Total FLT3 was probed after stripping of the pFLT3 membrane. Normalized pFLT3 signal intensity (on actin) is reported on the right. Two-way ANOVA, the p-value of the editing effect is reported. Uncropped blots are reported in Supplementary Fig. 2. b. KIT epitope engineered variant preserves kinase activation. Western blot of proteins extracts from NIH-3T3 cells expressing KIT variants by Sleeping Beauty transposase. Cells were serum-starved overnight and stimulated with different concentrations of human SCF for 10 min at 37 °C. pFLT3 Y719, total KIT and Actin were probed on the same lysates. Normalized pKIT signal intensity (on total KIT) is reported in the right plot. Two-way ANOVA, the p-value of the editing effect is reported. Uncropped blots are reported in Supplementary Fig. 2. c. CD123 epitope engineered variants preserve STAT5 activation. BaF3 cells expressing CD123 variants by Sleeping Beauty transposase were starved for murine IL-3 and stimulated with different concentrations of human IL-3. Cells were evaluated for STAT5 phosphorylation by intracellular flow cytometry after 48h (left, representative FACS plots show the CD123 S59P condition at different hIL-3 doses; right, pSTAT5 PE MFI). Two-way ANOVA, the p-value of the editing effect is reported. d. FLT3, KIT, CD123 epitope engineered variants induce proliferative responses similar to WT receptors. BaF3 cells expressing FLT3, KIT and CD123 variants by Sleeping Beauty transposase were starved for murine IL-3 overnight and stimulated with different concentrations of human FLT3, SCF and IL-3, respectively. Cells were cultured for 5 days and analysed by flow cytometry to obtain absolute counts (CountBeads). Plots report absolute counts normalized to the unstimulated condition. N = 4. e. Top: Bidirectional lentiviral vector expressing a 2nd generation CAR and a truncated Epidermal Growth Factor Receptor (EGFRt). f. Percentage of EGFRt+ (left) and fold expansion (right) of T cells after transduction with 4G8-CAR at different multiplicity of infection (MOI). Days, D.
Extended Data Fig. 3
Extended Data Fig. 3. Epitope-edited cells are protected by CAR-T cell killing.
a. CAR-T cell CD4/CD8 composition during in vitro culture. Fresh healthy donor-derived PBMC were cultured with CD3/CD28 Dynabeads (bead:cell ratio = 3:1), IL-7 5 ng/mL and IL-15 5 ng/mL and transduced at day (D) 2 with a lentiviral vector (LV) encoding for the 4G8 CAR. The culture composition was evaluated by flow cytometry at days 2, 4, 6, 12. The plot reports N = 5 conditions LV-transduced with different multiplicity of infection (MOI). Mean ± SD. b. CAR-T cell phenotype by flow cytometry. T cell subsets were evaluated by CD62L and CD45RA staining (CD45RA+62L+, Naïve/T stem memory cells; CD45RA-62L+, central memory, CM; CD45RA-62L-, effector memory, EM; CD45RA+62L-, terminally differentiated EM cells re-expressing CD45RA, EMRA). Representative FACS plots (left) and the culture composition by CD4+ and CD8+ subsets (right) are reported. D0 refers to uncultured peripheral blood T cells after Ficoll separation. Mean ± SD (N = 5). c. FLT3WT cells are eliminated by 4G8 CAR-T cell while FLT3N399 BE cells show selective resistance. 4G8 CAR-T cells co-culture assay with FLT3 reporter K562 cells either unmodified or FLT3N399 base edited. (Left) Representative flow cytometry plots at early timepoint (6h) gated on live cells (AnnexinV-7AAD-). T cells are identified by CellTrace marking, while K562 targets by FLT3 expression. (Left to Right) Target cell viability at 6h (%), T cell degranulation by CD107a surface staining at 6h (%) and FLT3 expression on surviving target cells at 48h (MFI, normalized on E:T = 0). N = 2. Two-way ANOVA, the p-value of the editing effect is reported. d. Epitope engineered receptors provide protection from CAR-T cells. Each row reports additional plots from co-cultures with FLT3, CD123 and KIT expressing K562 cells (same experiments reported in Fig. 2c, d, e). By column from left to right: CellTrace MFI of CAR-T cells at 48h of co-culture, Target cell viability after 48h of co-culture with CAR-T cells (%), Target cell viability after 48h of co-culture with untransduced T cells (%), absolute counts of live cells (AnnexinV-7AAD-, normalized on E:T = 0) after 48h of co-culture with untransduced T cells, CD69+ untransduced T cells after 48h of co-culture (%), FLT3, CD123 or KIT MFI on target cells after 48h of co-culture with untransduced T cells. Mean ± SD, N = 4. e. Experimental layout for co-colture assays with two populations of target cells, one expressing FLT3 and the other expressing CD123. Unmodified or epitope edited FLT3 and CD123 K562 reporter cells were mixed at ~1:1 ratio and co-cultured with either expressing 4G8 CAR, CSL362 CAR or untransduced T cells. The FLT3+/CD123+ % composition of live target cells (pre-gated on FLT3+ or CD123+) is reported as bar plots for each combination at different effector:target (E:T) ratios. Mean ± SD, N = 4.
Extended Data Fig. 4
Extended Data Fig. 4. Efficient base editing of FLT3, CD123 and KIT in CD34+ HSPCs.
a. Schematic representation of the plasmid template used for in vitro transcription (IVT) of base editor mRNAs. Type-IIS restriction enzyme BbsI was used to linearize the template. T7, T7 RNA polymerase promoter; UTR, untranslated region; HBB, haemoglobin β gene; polyA, poly-adenine sequence (~110-120 nt). (Bottom) Representative plot of purified IVT SpRY-ABE8e mRNA analysed with Agilent Fragment Analyzer RNA for quality control. >90% of IVT mRNA corresponds to the predicted size. b. SpRY-ABE8e V106W mRNA dose finding test on FLT3-reporter K562 cells base edited for FLT3N399 with sgRNA-18. Right, correlation of FLT3 editing efficiency by flow cytometry with mRNA x sgRNA dose and correlation of FLT3 editing efficiency by flow cytometry and by gDNA analysis. Spearman r2 and p values are reported. c. Optimization of CD34+ HSPC base editing by mRNA electroporation. Several SpRY-ABE8e mRNA variants were tested in a dual FLT3/CD123 editing experiment. Tested variables include: mRNA purification method (beads, sparQ PureMag magnetic beads; column, NEB Monarch RNA columns), dephosphorylation, substitution of UTP with N1-methyl-pseudo-uridine (N1m-U) or 5-methoxy-uridine (5me-U), capping technology (CleanCap, Trilink CleanCap AG; ARCA, NEB 3´-O-Me-m7G(5′)ppp(5′)G RNA Cap Structure Analog) and the addition of the K918N SpCas9 mutation (which has been reported to improve SpCas9 catalytic activity). Bar plots showing FLT3 and CD123 editing efficiencies by genomic DNA (gDNA) analysis (%) and absolute counts of bulk (CD34+) and stem-enriched (CD90+45RA-) cells at the end of in vitro culture. d. Optimization of culture conditions for base editing. CD34+ HSPCs were base edited with SpRY-ABE8e mRNA and FLT3N399 sgRNA with addition of supplements during electroporation (RNAsin, Promega RNAsin RNAse-inhibitor; glycerol) or with different culture conditions, including modulation of cytokine concentrations (standard: 100 ng/mL FLT3L, SCF and 50 ng/mL TPO; 1.5x: 150 ng/mL FLT3L, SCF and 75 ng/mL TPO; 3x: 300 ng/mL FLT3L, SCF and 150 ng/mL TPO; + IL-3: standard with addition of hIL-3 20 ng/mL), different stem-cell preserving compounds (standard: SR-1 0.75 μM, UM171 35 nM; SR-1 only 0.75 μM; UM171 only 35 nM; no SR-1/UM171), addition of anti-inflammatory compounds (PGE2, Prostaglandin-E2 10 μM; DEX, dexamethasone 1 μM). Bar plots showing FLT3 editing efficiencies by gDNA analysis (%) and absolute counts of bulk (CD34+) and stem-enriched (CD90+45RA-) cells at the end of in vitro culture. e. CD34+ HSPCs were electroporated at different timepoints (24h, 48h, 72h) after thawing to select the best timing for editing. Each condition was edited once for all combinations of two of our selected targets (FLT3, CD123, KIT). Bar plots show the editing efficiencies by gDNA analysis (%) and absolute counts of bulk (CD34+) and stem-enriched (CD90+45RA-) cells at the end of in vitro culture. f. Representative flow cytometry plots of the stem cell surface phenotype (CD90/CD45RA subsets) of FLT3, CD123, KIT and AAVS1 base edited CD34+ HSPCs. Plots are pre gated on Live CD34+133+ cells. g. Uncropped photomicrograph of colony forming assays plated with in vitro epitope edited CD34+ HSPCs (same conditions as Fig. 3h). h. Representative flow cytometry plots showing the gating strategy used for analysis of edited CD34+ HSPCs. From left to right, cells were gated for singlets (FSC-H/FSC-A plot), Live (PI/FSC-A plot; PI, propidium iodide), physical parameters (SSC-A/FSC-A plot), CD34+ (CD34/CD90 plot), CD133+ (CD34/CD133 plot), and CD45RA-90+, CD45RA-90-, CD45RA+90- (CD45RA/90 plot). After pre-gating on singlets (S), a bead (B) gate identifies CountBeads (FSC-AlowPIhigh, which are further gated on two additional fluorescent parameters to exclude debris (not shown). i. Epitope-edited HSPCs retain proliferative response to cytokine stimulation. FLT3, KIT and CD123 base edited CD34+ HSPCs were plated with different concentration of the respective ligand and cultured for 4 days. Absolute counts were obtained by flow cytometry using CountBeads. Editing efficiencies at experiment endpoint are reported (technical triplicate were pooled together for gDNA analysis). Mean ± SD. N = 4 on 2 healthy donors. Two-way ANOVA, the p-value of significant comparisons at each concentration are reported. j. Editing efficiencies of epitope-edited HSPCs cultured for 4 days with different concentration of the respective receptor ligand (same experiment at Extended Data Fig. 4h). No counterselection of the edited cells was observed. One-way ANOVA. k. BM lineage composition of NBSGW xeno-transplanted with FLT3- or AAVS1-edited HSPCs. Same primary xenotransplant reported in Fig. 3i. Mean ± SD. Multiple t-tests. FLT3N399 N = 7, AAVS1-BE N = 4. PMN, polymorphonucleate granulocytes; mono, monocytes; lin-, lineage-negative.
Extended Data Fig. 5
Extended Data Fig. 5. Epitope editing does not affect downstream signalling and transcriptional response of CD34+ HSPCs upon ligand stimulation.
a. Experimental layout for RNAseq and phospho-profiling by mass spectrometry of epitope edited CD34+ HSPCs. Cells were thawed and edited as previously described, cultured for 4 days to allow substitution of the receptor protein on the cell surface, starved for cytokines (24h) and stimulated with the respective ligand (FLT3L, IL-3, SCF). Cells were harvested at 6h and 24h after the start of stimulation for phospho-MS and RNAseq respectively. The experiments were performed in biological replicate (N = 3 and N = 2 CD34+ donors for RNAseq and MS, respectively). b. Volcano plots showing significantly differentially expressed genes (DEGs) in response to each receptor stimulation. The full list is available in Supplementary Tables 3 to 5. c. Heatmaps reporting the significant DEGs for each receptor/ligand couple (FDR-corrected p<0.05). Each column corresponds to a sample (see mapping reported above the heatmap and legend on the right), while rows correspond to gene transcripts. As depicted by the dendrogram, unbiased clustering shows predominant effects of the (1) stimulation and (2) donor, while editing conditions are distributed within each cluster. Full comparisons are available in Supplementary Tables 10–12. d. Enrichment analyses for the comparison of (from left to right) FLT3L, IL-3 and SCF vs unstimulated. Top row reports the GSEA analysis for the Biological Process (BP) gene ontology. The top 10 terms by significance for NES<0 or NES>0 are reported. Dark red, FDR<0.05 and NES>0, Light red FDR>0.05 and NES>0, Dark blue FDR<0.05 and NES<0, Light blue FDR>0.05 and NES<0. The bottom row reports top 10 terms by significance for KEGG pathways enrichment analysis. Dark red, FDR < 0.05, Light Red FDR > 0.05. The full list of terms is available in Supplementary Tables 7–9. e. Left, Heatmap of differentially expressed genes (DEGs) from the UT vs AAVS1 comparison (editing effect) on CD34+ HSPC RNAseq samples. Full list of DEGs is available in Supplementary Table 6. Right, enrichment analysis of the UT vs AAVS1 DEGS, the top 10 terms by significance for KEGG and Reactome pathways are reported. Full lists are available in Supplementary Tables 7–9. f. Phospho-proteomic analysis of edited CD34+ HSPCs by mass spectrometry. Scatter plot showing the concordance of the log Fold Change (LFC) of phosphorylated sites by MS upon stimulation in receptor edited vs AAVS1 control condition. Sites differentially with differential phosphorylation associated with the Stimulation (left column) or the Editing (right column) are reported in the scatter plots. Heatmaps reporting the phospho-sites for each comparison and editing condition are reported in Supplementary Fig. 3. Full lists of phospho-sites for each comparison are available as Supplementary Tables 13–15.
Extended Data Fig. 6
Extended Data Fig. 6. Hematopoietic cells derived from epitope-edited HSPCs show preserved function.
a. Editing efficiency of FLT3-, CD123- and KIT- edited CD34+ HSPCs differentiated in vitro toward myeloid, granulocyte, macrophage, dendritic cell and megakaryocyte lineages. N = 3 biological replicates. b. Reactive Oxygen Species (ROS) production of differentiated myeloid cells unstimulated or stimulated with PMA 5 ng/ul for 15 min at 37 °C, as measured by CellROX Green fluorescence. N = 3 biological replicates. Two-way ANOVA, the p-value of the editing effect is reported. c. Phagocytosis of E.coli loaded with pHrodo Green dye, which becomes fluorescent upon acidification of the phagolysosome. In vitro differentiated macrophages were incubated with E.coli for 60 min at 37 °C and then analysed by flow cytometry. Left, representative FACS plots. Right, % of phRodo+ macrophages. N = 3 biological replicates, technical duplicate. One-way ANOVA. d. Polarization of in vitro differentiated macrophages incubated with LPS or IL-4. Cells were stimulated with LPS 100 ng/mL or IL-4 20 ng/mL and then analysed by flow cytometry. The % of cells with and M1-like or M2-like phenotypes are reported in the bar plots. N = 3 biological replicates. Two-way ANOVA, the p-value of the editing effect is reported. e. Phospho-flow of in vitro differentiated myeloid cells stimulated with IL-4, PMA/ionomycin, GM-CSF, IFN type-I, IL-6 or LPS. MFI of each phosphorylated marker was scaled to the range between the FMO control and the highest measured value. The heatmaps show comparable phosphorylation patterns between editing conditions. f. In vitro differentiation of classical dendritic cells and expression of co-stimulatory surface markers upon LPS stimulation. Top left, representative FACS plot showing gating for CD1c+CD11c+ DCs. Top right, MFI of surface markers on gated cDC. Two-way ANOVA, the p-value of the editing effect is reported. Bottom, HLA-DR and CD86 MFI on cDC stimulated with LPS. N = 3 biological replicates. Two-way ANOVA, the p-value of the editing effect is reported. g. In vitro differentiation of granulocytes and NETosis induction by PMA stimulation. Left, representative FACS plots showing composition of differentiation culture with SSCint and SSChi populations (both are >80% CD33+66b+). Upon PMA stimulation and NETosis induction, the released nucleic acids are stained by DAPI and PI. Right, bar plots reporting the culture composition by DAPI+ and/or PI+ (%). N = 3 biological replicates, technical duplicates. Two-way ANOVA, the p-value of the editing effect is reported. h Differentiation of megakaryocytes from CD34+ HSPCs. Left, representative FACS plot showing surface expression of CD61 and CD42b. Right, culture composition of in vitro differentiated megakaryocytes. Bar plots report the % of CD34, C41, CD42b positive cells. N = 3 biological replicates. Two-way ANOVA, the p-value of the editing effect is reported. i DNA staining (PI) shows the generation of polyploid megakaryocytes up to 16N. Left, representative FACS plot showing the relationship between surface CD61 and DNA content. Right, culture composition of gated megakaryocytes by ploidy. Two-way ANOVA, the p-value of the editing (column) effect is reported.
Extended Data Fig. 7
Extended Data Fig. 7. Epitope-edited HSPCs show preserved hematopoietic reconstitution and multilineage differentiation capacity.
a. Human engraftment by flow cytometry (% hCD45+) in the peripheral blood at 12 weeks (W12) and in the bone marrow at week 17 (BM) at endpoint of secondary recipient NBSGW mice xenotransplanted with BM cells from the experiment depicted in Fig. 3i. Each primary was transplanted in one secondary recipient. Mean ± SD. Comparison by 2-way ANOVA, the p-value of the editing effect is reported. b. Absolute counts of progenitor (left), myeloid (centre) and lymphoid (right) lineages in the BM of secondary xenotransplanted mice. AAVS1BE N = 4, FLT3N399 N = 7. Mean ± SD. HSC, hematopoietic stem cells; MPP, multipotent progenitors; LMPP, lymphoid-primed multipotent progenitors; CMP, common myeloid progenitors; GMP, granulo-mono progenitors; myeloblasts, defined as CD33/66b+19-14-11c-34-SSClow; mono, monocytes; iPMN, immature polymorphonucleate granulocytes; mature PMN, mature granulocytes. Multiple t-tests (only significant comparison are reported). c. Human engraftment by flow cytometry (% hCD45+) in the peripheral blood at 9, 11 weeks (W9, W11) and in the BM of NBSGW xenotransplanted with 1 M CD34+ HSPCs, either AAVS1BE or KITH378 edited. Mean ± SD. Comparison by two-way ANOVA, the p-value of the editing effect is reported. d. Absolute counts of progenitor (left), myeloid (centre) and lymphoid (right) lineages in the BM of mice from C. AAVS1 N = 4, KITH378 N = 4. Multiple t-tests (only significant comparison are reported). e. Human engraftment by flow cytometry (% hCD45+) in the peripheral blood at 11 weeks (W11) and in the bone marrow at week 14 (BM) of secondary recipient NBSGW mice xenotransplanted with BM cells from primary mice engrafted with KITH378 or AAVS1BE CD34+ HSPCs (experiment described in A). Each primary was transplanted in one secondary recipient. Comparison by two-way ANOVA, the p-value of the editing effect is reported. f Absolute counts of progenitor (left), myeloid (centre) and lymphoid (right) lineages in the BM of secondary xenotransplanted mice. AAVS1 N = 4, KITH378 N = 4. Multiple t-tests (only significant comparison are reported). g. KIT editing efficiencies measured on liquid culture (LC), total blood cells at week 9 after transplant (W9), on FACS-sorted B (CD19) and myeloid (CD33) BM cells at the end of the experiment, and on total BM from secondary recipients. Mean ± SD. One-way ANOVA. h. Left, representative FACS plots showing KIT staining with both therapeutic (Fab-79D) and control (104D2) mAb clones on BM hCD45+33+ cells from secondary xenotransplanted mice. Loss of Fab-79D staining in vivo is consistent with the genomic KIT editing efficiency (reported in G). Right, % of Fab79D+ cells within total KIT+ cells by control staining with clone 104D2. Unpaired t-test. i Human engraftment by flow cytometry (% hCD45+) in the peripheral blood and BM at week 14 of NBSGW mice xenotransplanted with CD123S59 or AAVS1BE CD34+ HSPCs, in primary (left) or secondary (right) transplants. Comparison by two-way ANOVA, the p-value of the editing effect is reported. j. CD123 editing efficiencies measured on liquid culture (LC), total blood cells at week 8 and 10 after transplant (W8, W10), on FACS-sorted B (CD19) and myeloid (CD33) BM cells at the end of the experiment, and on total BM from secondary recipients. Mean ± SD. One-way ANOVA. k. Representative FACS plots showing CD123 staining with both therapeutic (7G3) and control (9F5) mAb clones on BM lineage-CD34+ cells from secondary xenotransplanted mice. Loss of 7G3 staining in vivo is consistent with the genomic CD123 editing efficiency (reported in J). l. Left, schematic representation of a lentiviral vector encoding for the mNeonGreen fluorescent protein under a hPGK promoter used to transduce human PDXs. Right, representative flow cytometry plots show the transduction efficiency of patient-derived AML xenografts on bone marrow (PDX-1) or spleen (PDX-2) samples. PDX cells were transduced ex vivo overnight, transplanted into NBSGW mice for expansion, FACS-sorted for mNeonGreen+ cells and injected into secondary recipients. m. Genetic features (left) and surface immunophenotype (right) at thawing of AML PDX used for in vivo experiments. Genetic mutations and the % of positive cells for each marker is reported in the heatmap. ITD, internal tandem duplication; TKD, tyrosine kinase domain mutation. n. Effect of cultured, non-CAR-transduced T cells on healthy human engraftment in NBSGW mice. Mice were engrafted with 1M CD34+ HSPCs and treated with 2.5 M healthy donor untransduced T cells, expanded in vitro as previously described. While there is no Ag-specific impact on lineage composition, we observed significant depletion of HSCs (0.08x), slight expansion of monocytes (2.57x) and a trend towards B cell increase. Left, representative FACS plots of lineage-CD34+38-10- progenitors, with HSC gating (CD45RA-90+) highlighted in red. Centre, human BM graft composition as % of hCD45+CD3- (to exclude exogenous T cells). Multiple unpaired t-tests, only significant p values are reported. Right, correlation between T cell expansion (CD3+ w/in hCD45+) and decrease in HSC frequency in mice treated with untransduced T cells.
Extended Data Fig. 8
Extended Data Fig. 8. Off-target analyses of FLT3, CD123 and KIT epitope editing.
a GUIDE-Seq experimental design on 293T cells. GUIDE-Seq results were filtered by number of gRNA mismatches+bulge <6. The detected on-target locus is highlighted in blue. b Estimation plots of off-target deamination at predicted sites by NGS sequencing for FLT3-sgRNA-18, CD123-sgRNA-R, KIT-sgRNA-Y and FLT3-sgRNA-16. Loci with significant excess deamination compared to control are highlighted in blue. Additional information on predicted OT sites is reported in Supplementary Fig. 3 and Supplementary Tables 17–20. c Random deamination within RNAseq data of edited CD34+ HSPCs. The proportion of A-to-G conversion observed on the top 5% reads by coverage on RNAseq samples of edited CD34+ HSPCs is reported. Sample editing condition, whether it was stimulated with each ligand and donor source are reported below. Threshold and coverage are reported in Supplementary Table 21. d. On-target editing efficiency and indel formation in CD34+ HSPCs (%). Indel frequency was calculated on NGS samples as the proportion of reads harbouring any deletion or base insertion within the sgRNA sequence.
Extended Data Fig. 9
Extended Data Fig. 9. FLT3N399 HSPCs are resistant to 4G8-CAR in vivo.
a. Peripheral blood lineage composition of NBSGW mice xeno-transplanted with AAVS1BE and FLT3N399 HSPCs at 8 weeks. Mean ± SD. AAVS1BE N = 13, FLT3N399 N = 18. Unpaired t-tests. b. Percent of AML cells (by mNeonGreen fluorescence) on total BM-derived CFUs plated with samples from the experiment reported in Fig. 4. Mean ± SD. One-way ANOVA. c. Percent of immature granulocytes (CD33/66b+14-10-11c-SSChigh) within CD33/66b+ BM cells. Same experiment reported in Fig. 4. Mean ± SD. One-way ANOVA. d. Lineage-negative CD34+ progenitors are depleted by 4G8 CAR-T in vivo and protected by FLT3N399 editing (experiment reported in Fig. 4). (Left) Representative flow cytometry plots of lineage-neg cells (mNeonGreen-CD3-19-14-11c-56-) with gating of CD34+ progenitors (% reported within the gate). (Right) % of lin-CD34+ cells within hCD45+3-mNeonGreen- BM cells. Mean ± SD. One-way ANOVA. e. Relative composition of BM lin-CD34+ of mice from the experiment reported in Fig. 4. Mean ± SD. two-way ANOVA with multiple comparison (only significant AAVS1 vs FLT3N399 comparisons are reported). HSC, hematopoietic stem cells; MPP, multipotent progenitors; LMPP, lymphoid-primed multipotent progenitors; CMP, common myeloid progenitors; GMP, granulo-mono progenitors; MEP, mega-erythroid progenitors. f. FLT3 expression (MFI) on myeloid (left) and lymphoid (right) BM subsets at experimental endpoint. LMPP, MPP and HSC from 4G8 CAR treated AAVS1BE conditions are not evaluable (NE) due to low cell number. Mean ± SD. Multiple unpaired t-tests. g. CAR-T cell phenotype by flow cytometry in the BM of mice from Fig. 4. CD45RA+62L+, Naïve; CD45RA-62L+, central memory, CM; CD45RA-62L-, effector memory, EM; CD45RA+62L, terminally differentiated EM cells re-expressing CD45RA, EMRA. h. Bar plots reporting (from left to right) % of EGFRt+ within BM CD3+ cells, PD1 (CD279) MFI and CD69 MFI on BM CD8+ and CD4+ CAR T cells. Mean ± SD. Comparisons between AAVS1BE and FLT3N399 conditions by one-way ANOVA are reported. i. Peripheral blood lineage composition of NBSGW mice xeno-transplanted with AAVS1BE and CD123S59 HSPCs at 10 weeks (experiment reported in Extended Data Fig. 10). Mean ± SD (N = 11). Unpaired t-tests.
Extended Data Fig. 10
Extended Data Fig. 10. CD123S59 HSPCs are resistant to CSL362-CAR in vivo.
a. Xeno-transplants of CD123S59 or AAVS1-BE HSPCs co-engrafted with AML PDX-1 and treated with 5M CSL362 CAR-T. b. Representative FACS plots of BM samples from mice engrafted with HSPCs+PDX-1 treated with CSL362 CAR-T or untreated. Plots are pre-gated on total human CD45+; CAR-T cells are identified by CD3 staining, while AML PDX cells are mNeonGreen+. c. CD123 editing on PB (week 8-10) and sorted CD33+/CD19+ BM cells. CD123S59 N = 6, AAVS1 BE N = 5. Mean ± SD. Statistical comparison by multiple unpaired t-test. d. Bar plots showing the % of AML PDX cells within hCD45+CD3- BM cells. Mean ± SD. e. Percentage of CD3+ cells within hCD45+mNeonGreen- BM cells. Mean ± SD. One-way ANOVA. f. Absolute counts of total hCD45+3-mNeonGreen- cells in the BM. Mean ± SD. One-way ANOVA. g. Percentage of pro-B cells (CD19+10-34-) within human CD45+3-mNeonGreen- BM cells. Mean ± SD. Statistical comparison of CD123S59 vs AAVS1-BE conditions by one-way ANOVA. h. Left: representative FACS plots showing depletion of BM myeloid cells (CD33/66b+19-, highlighted by the orange gate) by CSL362 CAR-T in mice transplanted with CD123S59 or AAVS1 BE HSPCs. Right: representative FACS plots showing depletion of granulocytes (PMN, CD33/66b+19-14-SSChigh, orange gate) i. Bar plots showing the % of total myeloid cells (CD33/66b+19- within hCD45+ cells), (j) PMN (CD33/66b+19- within CD33/66b+19- cells), (k) immature PMN (CD33/66b+19-14-10-11c-SSChigh within CD33/66b+19- cells). Mean ± SD. Statistical comparison of CD123S59 vs AAVS1 BE conditions by one-way ANOVA. l. Representative flow cytometry plots showing loss of dendritic cells (DC) subsets by CSL362 CAR-T in mice transplanted with CD123S59 or AAVS1 BE HSPCs. Left: conventional DC (cDC, CD33/66b+14-11c+FLT3+SSClow), plots are gated on CD33/66b+14-SSClow cells. Right: plasmacytoid DC (pDC, CD33/66b+14-11c-FLT3+CD123highSSClow), plots are gated on CD33/66b+14-11c-SSClow cells. m. and n. Percentage of cDC and pDC within hCD45+3-mNeonGreen- cells, respectively. o. Percentage of lineage-CD34+ progenitors within hCD45+3-mNeonGreen- cells. Mean ± SD. Statistical comparison of CD123S59 vs AAVS1-BE conditions by one-way ANOVA. p. Lineage-negative CD34+ progenitors are depleted by CSL362 CAR-T and protected by CD123S59 BE. Left, representative flow cytometry plots of lineage-negative cells (mNeonGreen-CD3-19-14-11c-56-) with gating of CD34+ progenitors. Right, representative flow cytometry plots of lin-CD34+38-10- cells with gating of HSC (CD45RA-90+), MPP (CD45RA-90-), LMPP (CD45RA+90-) subsets. q and r. Absolute counts of progenitors (q) and myeloid and lymphoid lineage subsets (r) in the BM. Untreated mice are pooled together (grey bars), while CSL362-treated CD123S59 and AAVS1-BE mice are reported in pink and blue, respectively. The fold change in absolute counts (CD123S59/ AAVS1) for CAR treated groups is reported above each population bar plot. Mean ± SD. One-way ANOVA with multiple comparison. FDR-adjusted p-values of the comparison between CD123S59 vs AAVS1 BE treated with 4G8-CAR are reported (p < 0.05 in bold).
Extended Data Fig. 11
Extended Data Fig. 11. Susceptibility of AML PDX to targeted immunotherapies and improved efficacy of dual-specific CAR-T cells.
a. CD123 expression (MFI) on myeloid (left) and lymphoid (right) BM subsets at the endpoint (experiment reported in Extended Data Fig. 10). Mean ± SD. Statistical differences by multiple unpaired t-test are reported. b. 4G8-CAR deplete PDX-1 in vivo but fail to eradicate PDX-2. NSBGW female mice were xeno-transplanted with AML PDX cells and, after 10 days, treated with 4G8 CAR-T cells. Experimental endpoint was 18 days after CAR-T administration. From left to right, bar plots report the % of AML PDX cells within total CD45+ cells in the bone marrow (BM), % of AML PDX cells within total CD45+ cells in the spleen (SP), absolute counts of BM T cells, the FLT3 MFI on surviving AML cells in the BM and the FLT3 MFI on surviving AML cells in the SP. Mean ± SD. One-way ANOVA with multiple comparison. c. 4G8-CAR T cells deplete PDX-1 in vivo but fail to eradicate PDX-2 in mice pre-engrafted with AAVS1BE and FLT3N399 HSPCs. NBSGW mice were xeno-transplanted with edited HSPCs and, after 11 weeks, injected with PDX-1 or PDX-2 cells. After 10 days, mice were treated with 2.5 M 4G8 CAR-T cells, and the outcome was evaluated after 2 weeks. Left, bar plots reporting the % of AML cells within total BM hCD45+ cells and within CFU assays plated with total BM cells. Mean ± SD. One-way ANOVA with multiple comparison. Right, FLT3 editing efficiency within total BM and FACS-sorted CD33+ and CD19+ subsets. 4G8-CAR deplete non-edited hematopoietic cells, resulting in higher editing efficiencies in the CAR-treated condition. Mean ± SD. Comparisons by t-test. d. Combinations of CAR-T cells have improved efficacy against PDX-2 in vivo. NBSGW mice were xeno-transplanted with 0.75 M PDX-2 cells and, after 10 days, treated with 2.5 M 4G8 CAR or combinations of 4G8 + CSL362, 4G8 + Fab79D or CSL362 + Fab79D CAR T cells (2.5 M each). The outcome was evaluated after 2 weeks. The bar plots show the % and absolute counts of AML cells within total BM hCD45+ cells. Mean ± SD. One-way ANOVA with multiple comparison (vs untreated condition). e. Dual FLT3/CD123 specific CAR-T cell in vitro co-culture assay with single and dual FLT3/CD123 epitope-edited HSPCs (same experiment reported in Fig. 5c). From Left to Right, T cell degranulation (CD107a+, top-right), median fluorescent intensity (MFI) of CellTrace (bottom-left), and FLT3 and CD123 expression (MFI) on target cells (bottom-centre and right). Mean ± SD (N = 4). Statistical comparisons are reported in Supplementary Table 24. f. Peripheral blood lineage composition of NBSGW mice xeno-transplanted with AAVS1BE and dual-edited FLT3N399/CD123S59 HSPCs at 9 weeks (same experiment as Fig. 5D). Mean ± SD. Unpaired t-tests.
Extended Data Fig. 12
Extended Data Fig. 12. Triple epitope-edited cells are resistant to multi-specific FLT3/CD123/KIT CAR-T cells.
a. Triple epitope-edited cells are resistant to FLT3/CD123/KIT triple specific CAR-T cells. Triple FLT3/CD123/KIT reporter K562 were edited as previously described for all 3 targets and then FACS-sorted to isolate single-, double- and triple-edited cells, along with unedited K562. Purified populations were then co-cultured at different effector:target ratios with FLT3/CD123/KIT triple specific CAR-T cells obtained by co-transducing healthy-donor derived with LV vectors encoding the 4G8, CSL362 and 79D CAR constructs. Untransduced T cells were also included as a control. Co-cultures were incubated for 48h and then analysed by flow. N = 4 technical replicates. b. Interferon-γ and TNFα production by T cells assessed by flow cytometry (% of IFNγ+ and TNFα+ T cells). One-way ANOVA with multiple comparison. c. From left to right, target cell viability (AnnexinV-7AAD-), T cell activation (CD69+), T cell degranulation (surface CD107a+), T cell proliferation (CellTrace violet dilution), Target antigen expression (% of triple FLT3+/CD123+/KIT+ cells). Top row reports conditions cultured with FLT3/CD123/KIT CAR-T cells, bottom row conditions cultured with untransduced T cells.

References

    1. Brentjens RJ, et al. CD19-targeted T cells rapidly induce molecular remissions in adults with chemotherapy-refractory acute lymphoblastic leukemia. Sci. Transl. Med. 2013;5:177ra38. doi: 10.1126/scitranslmed.3005930. - DOI - PMC - PubMed
    1. Grupp SA, et al. Chimeric antigen receptor-modified T cells for acute lymphoid leukemia. N. Engl. J. Med. 2013;368:1509–1518. doi: 10.1056/NEJMoa1215134. - DOI - PMC - PubMed
    1. Isidori A, et al. Immunotherapy in acute myeloid leukemia: where we stand. Front. Oncol. 2021;11:656218. doi: 10.3389/fonc.2021.656218. - DOI - PMC - PubMed
    1. Hofmann S, et al. Chimeric antigen receptor (CAR) T cell therapy in acute myeloid leukemia (AML) J. Clin. Med. 2019;8:200. doi: 10.3390/jcm8020200. - DOI - PMC - PubMed
    1. Haubner S, et al. Coexpression profile of leukemic stem cell markers for combinatorial targeted therapy in AML. Leukemia. 2018;33:64–74. doi: 10.1038/s41375-018-0180-3. - DOI - PMC - PubMed

Publication types

MeSH terms