. 2023 Sep;621(7977):171-178.
doi: 10.1038/s41586-023-06497-4. Epub 2023 Aug 30.

Identification of an alternative triglyceride biosynthesis pathway

Affiliations

Identification of an alternative triglyceride biosynthesis pathway

Gian-Luca McLelland et al. Nature. 2023 Sep.

Abstract

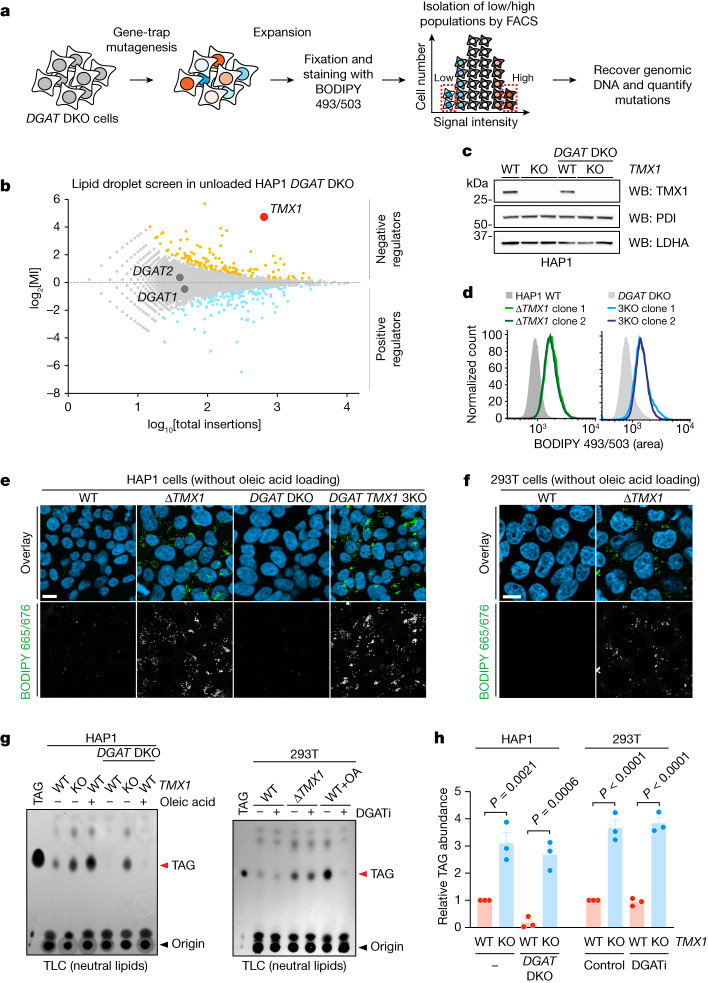
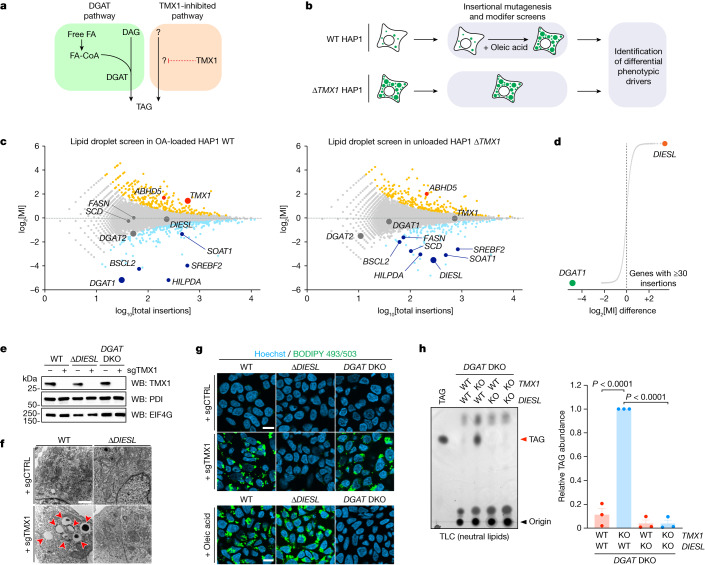
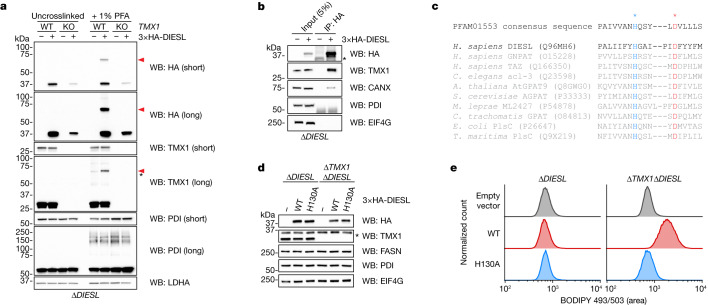
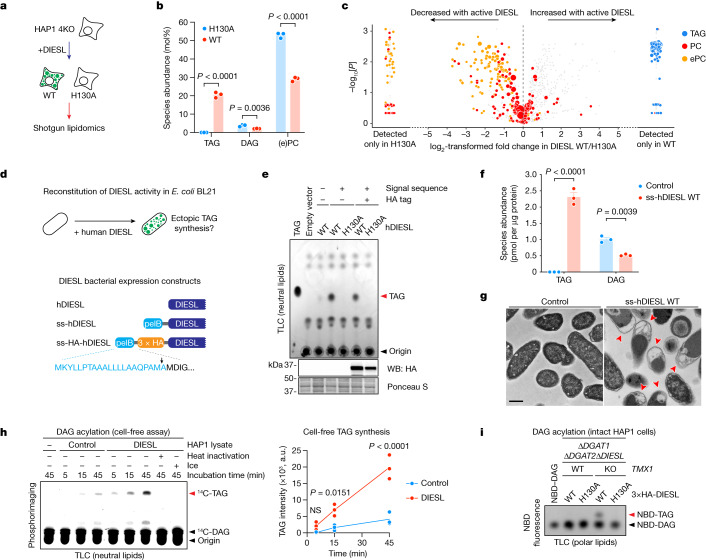
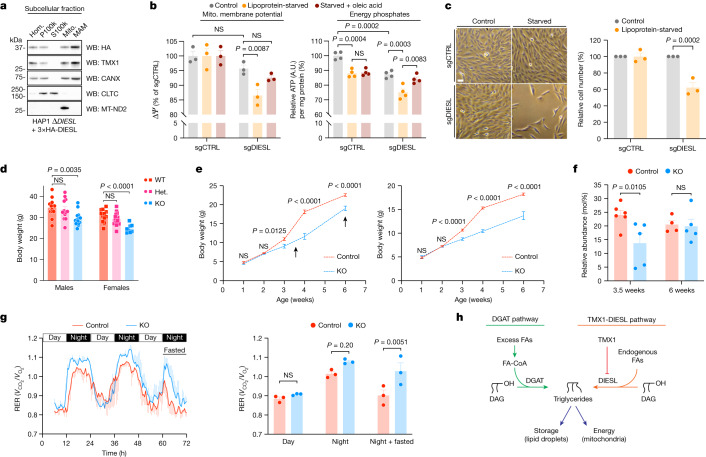
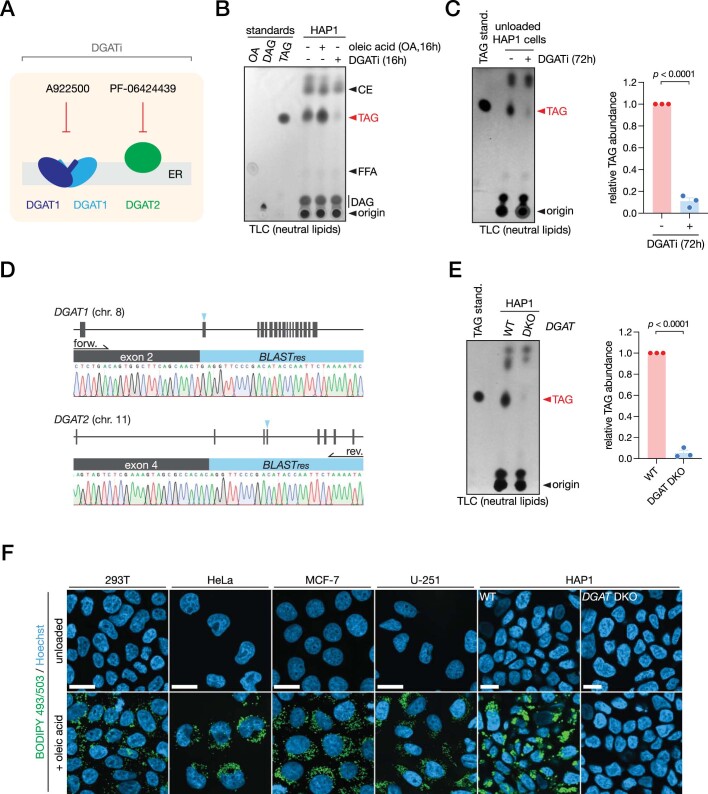
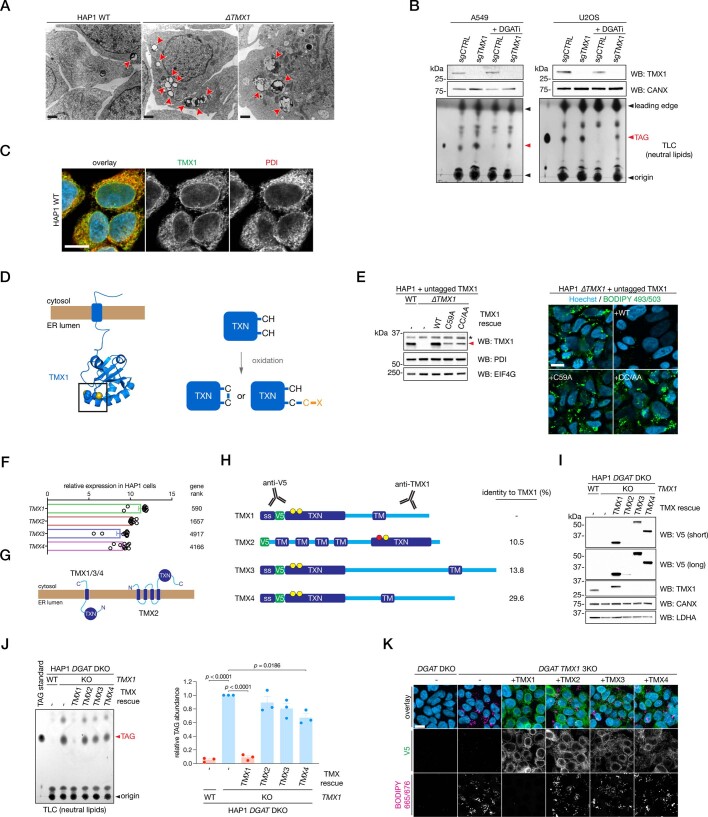
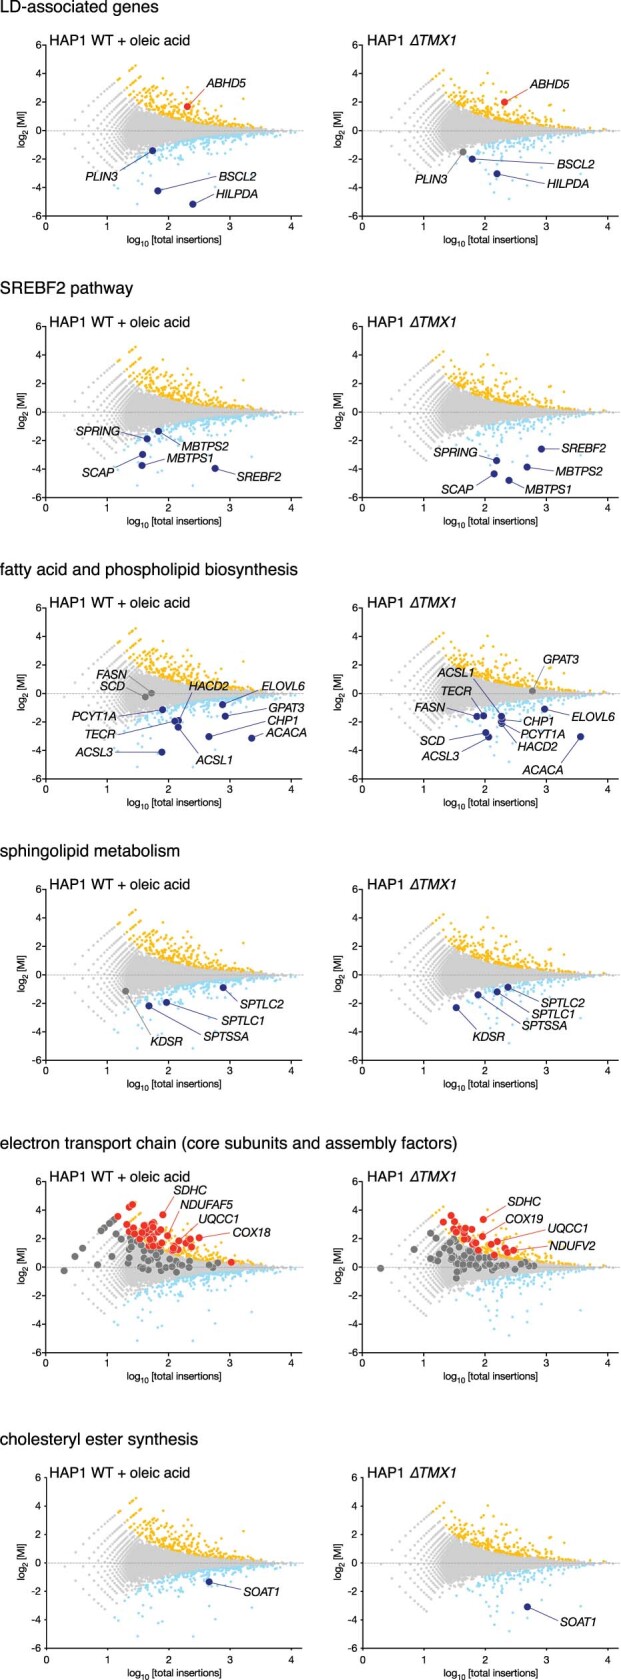
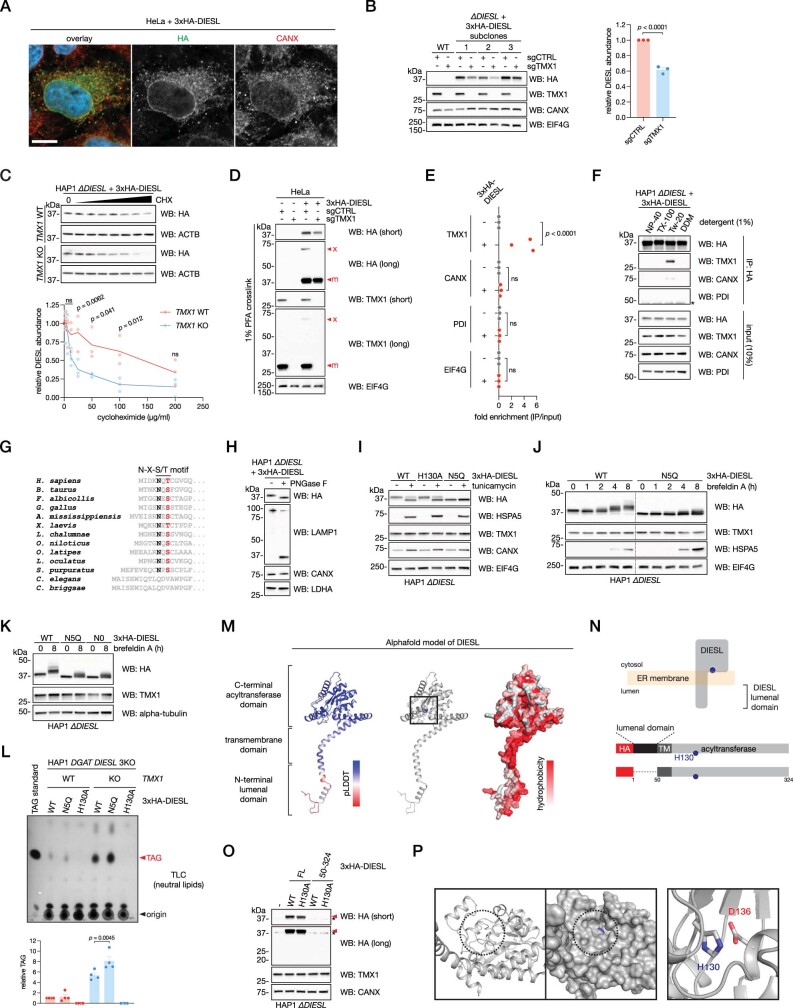
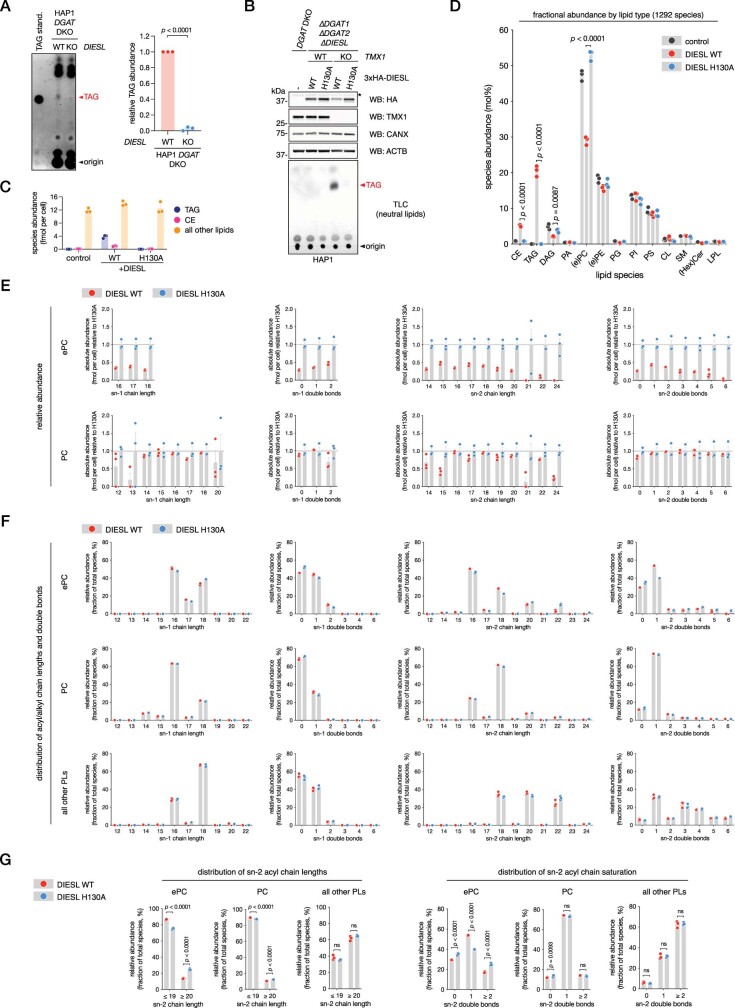
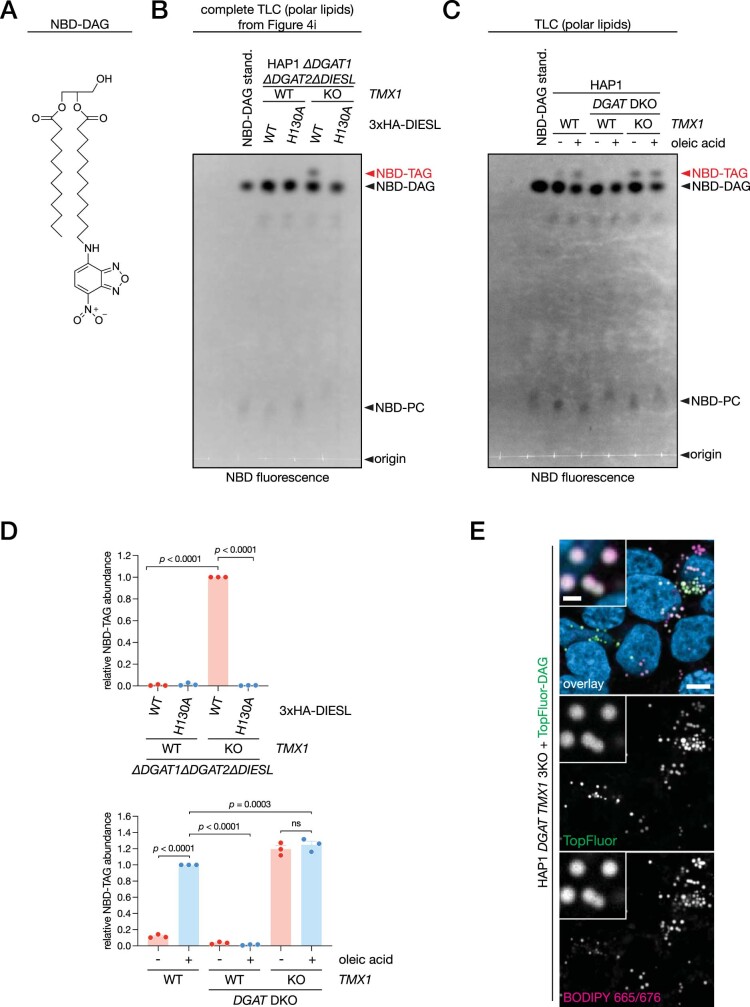
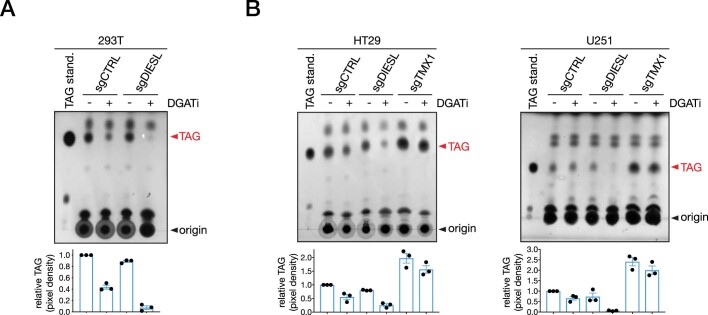
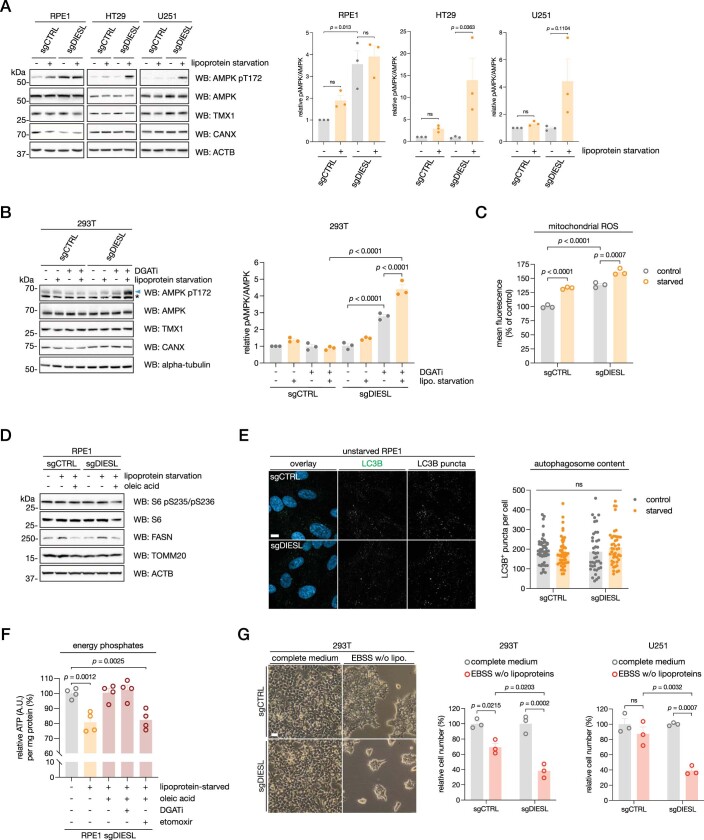
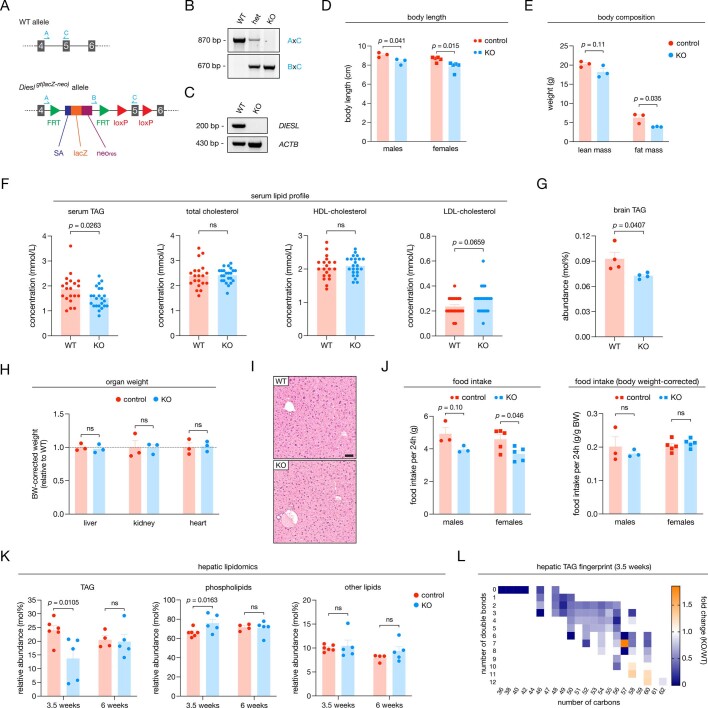
Triacylglycerols (TAGs) are the main source of stored energy in the body, providing an important substrate pool for mitochondrial beta-oxidation. Imbalances in the amount of TAGs are associated with obesity, cardiac disease and various other pathologies1,2. In humans, TAGs are synthesized from excess, coenzyme A-conjugated fatty acids by diacylglycerol O-acyltransferases (DGAT1 and DGAT2)3. In other organisms, this activity is complemented by additional enzymes4, but whether such alternative pathways exist in humans remains unknown. Here we disrupt the DGAT pathway in haploid human cells and use iterative genetics to reveal an unrelated TAG-synthesizing system composed of a protein we called DIESL (also known as TMEM68, an acyltransferase of previously unknown function) and its regulator TMX1. Mechanistically, TMX1 binds to and controls DIESL at the endoplasmic reticulum, and loss of TMX1 leads to the unconstrained formation of DIESL-dependent lipid droplets. DIESL is an autonomous TAG synthase, and expression of human DIESL in Escherichia coli endows this organism with the ability to synthesize TAG. Although both DIESL and the DGATs function as diacylglycerol acyltransferases, they contribute to the cellular TAG pool under specific conditions. Functionally, DIESL synthesizes TAG at the expense of membrane phospholipids and maintains mitochondrial function during periods of extracellular lipid starvation. In mice, DIESL deficiency impedes rapid postnatal growth and affects energy homeostasis during changes in nutrient availability. We have therefore identified an alternative TAG biosynthetic pathway driven by DIESL under potent control by TMX1.


Conflict of interest statement

T.R.B. is a co-founder and scientific advisor of Scenic Biotech. G.-L.M. and T.R.B. are inventors on a patent application related to this work.

Figures

Fig. 1
Fig. 1. TMX1 suppresses alternative TAG accumulation.
a, Schematic of a haploid genetic screen in DGAT DKO cells using the stain BODIPY 493/503. Low and high represent the 5% of cells with the lowest and highest fluorescent signal, respectively. b, Fishtail plot depicting genetic regulators of lipid droplets in a screen of DGAT DKO HAP1 cells. Significant positive and negative regulators are coloured light blue and orange, respectively. The mutational index (MI) represents the ratio of inactivating gene-trap mutations per gene recovered from each (high and low) population (see Methods for a complete description). c, Immunoblot of TMX1 levels in HAP1 cell lines. WB, western blot; PDI, protein disulfide isomerase; LDHA, lactate dehydrogenase A. d, Quantitative increase in lipid droplets (visualized by BODIPY 493/503) in TMX1-knockout (ΔTMX1) HAP1 cells, as measured by flow cytometry. e, Lipid droplets, visualized by BODIPY 665/676 (green in the overlay), in HAP1 cell lines, including a double-DGAT and TMX1 triple knockout (3KO). Blue, Hoechst 33342. Scale bar, 10 μm. f, Lipid droplets (visualized by BODIPY 665/676) in ∆TMX1 293T cells. Blue, Hoechst 33342. Scale bar, 10 μm. g, TLC of neutral lipids in HAP1 (left) and 293T (right) cell lines. Cells were pulsed with 50 µM oleic acid (OA) for 24 h where indicated. 293T cells were additionally treated with 10 µM (each) DGAT inhibitor (DGATi) where indicated. h, Quantification of the increase in TAG induced by TMX1 deletion in HAP1 and 293T cell lines, normalized to WT cells. Data are mean ± s.e.m. of n = 3 independent experiments (two-way ANOVA, Bonferroni correction; each cell line was analysed separately). Source Data
Fig. 2
Fig. 2. DIESL drives TAG accumulation in the absence of TMX1.
a, Schematic representation of the DGAT pathway (green box) and the putative TMX1-inhibited pathway (orange box). FA, fatty acid or fatty acyl. b, Set-up of the modifier screens used to identify the regulators of each pathway. c, Fishtail plots of lipid droplet screens in WT HAP1 cells treated with oleic acid (OA) (left) and in ∆TMX1 HAP1 cells (right). Significant positive and negative regulators are coloured light blue and orange, respectively; larger dots indicate the genes of interest. d, Difference in mutational index (log2-transformed) between the two screens for every gene with at least 30 insertions in each screen. e, Immunoblot of TMX1 in WT, ∆DIESL and DGAT DKO HAP1 cells transduced with a synthetic guide RNA targeting TMX1 (sgTMX1). f, Ultrastructural analysis of lipid droplets (red arrowheads) in WT and ∆DIESL cells after loss of TMX1. Scale bar, 1 μm. g, Lipid droplets, visualized by BODIPY 665/676, in WT, ∆DIESL and DGAT DKO cells transduced with the indicated sgRNA or treated with 200 µM oleic acid for 24 h. sgCTRL is a control sgRNA. Scale bars, 10 μm. h, TLC analysis of neutral lipids (left) and quantification of TAG (right) in DGAT DKO HAP1 cells also lacking DIESL and/or TMX1. Bars represent mean ± s.e.m. of n = 3 independent experiments (two-way ANOVA, Bonferroni correction). Source Data
Fig. 3
Fig. 3. The TMX1–DIESL enzymatic complex drives alternative triglyceride synthesis.
a, Immunoblot analysis of TMX1 and haemagglutinin (HA)-tagged DIESL (3×HA–DIESL) in HAP1 cells lacking endogenous DIESL (and TMX1), with or without crosslinking by 1% paraformaldehyde (PFA). Red arrowheads indicate the DIESL–TMX1 heterodimer, and the asterisk indicates a non-DIESL band. b, Co-immunoprecipitation of TMX1 with DIESL from rescued HAP1 cells (the asterisk indicates antibody chains). CANX, calnexin; PDI, protein disulfide isomerase; EIF4G, eukaryotic translation initiation factor 4G. c, Sequence conservation of catalytic dyads composed of a histidine (H, blue asterisk) and an aspartate (D, red asterisk) across acyltransferases (Uniprot accession numbers in parentheses). Species are Homo sapiens, Caenorhabditis elegans, Arabidopsis thaliana, Saccharomyces cerevisiae, Mycobacterium leprae, Chlamydia trachomatis, Escherichia coli and Thermotoga maritima. d, Western blot of HAP1 cells rescued with WT or catalytic-dead (H130A) DIESL (the asterisk indicates a non-specific band). FASN, fatty acid synthase. e, Analysis of lipid droplets (BODIPY 493/503 fluorescence intensity) in DIESL-rescued HAP1 cells by flow cytometry.
Fig. 4
Fig. 4. TAG synthesis by DIESL.
a, Lipidomic analysis of 4KO (∆DGAT1DGAT2DIESLTMX1) HAP1 cells. b, Relative abundance of TAG, DAG and (e)PC in 4KO HAP1 cells reconstituted with 3×HA–DIESL. Bars represent mean ± s.e.m. of n = 3 independent samples (two-way ANOVA, Bonferroni correction). c, Change in abundance of detected lipids (1,183 species) between 4KO HAP1 cells expressing WT or H130A DIESL. PC (red), ePC (orange) and TAG (blue) are indicated. Circle size depicts the relative, scaled abundance of the indicated molecule. d, Reconstitution of TAG synthesis in E.coli by DIESL (top) and schematic representation of human (h) DIESL constructs for expression in E. coli (bottom). Blue, pectate lysate B (pelB) signal sequence (ss); black arrowhead, cleavage site. e, TLC separation of neutral lipids and immunoblot analysis from E. coli expressing the indicated construct. f, Absolute abundance of TAG and DAG in E. coli expressing either ss-hDIESL or empty vector. Bars represent mean ± s.e.m. of n = 3 independent samples (two-way ANOVA, Bonferroni correction). g, Ultrastructural analysis of E.coli expressing ss-hDIESL H130A (control) or WT. Red arrowheads indicate lipid-rich inclusions. Scale bar, 500 nm. h, Left, cell-free reconstitution of TAG synthesis by DIESL. Lysates from control 4KO HAP1 cells or those expressing 3×HA-DIESL were incubated with 50 µM 14C-DAG for the indicated time period at 37 °C unless otherwise indicated. Lipid extracts were separated by TLC and analysed by phosphorimaging. Right, intensities were quantified for n = 3 independent experiments. The line connects the mean of each time point for both conditions (two-way ANOVA, Bonferroni correction). NS, not significant. i, Acylation assay of NBD–DAG. HAP1 cell lines were treated with 25 µM NBD–DAG for 1 h before TLC analysis of polar lipids (to accommodate the charge on the NBD group). NBD-tagged lipids were identified by NBD fluorescence. Source Data
Fig. 5
Fig. 5. DIESL deficiency in cells and mice.
a, Subcellular fractionation of HAP1 cells. Hom., homogenate; P100k, pellet obtained by ultracentrifugation at 100,000g; S100k, 100,000g supernatant; Mito., mitochondria; MAM, mitochondria-associated membrane of the ER. Markers of light membranes and cytosol (CLTC), as well as mitochondria (MT-ND2), are included. b, Mitochondrial membrane potential (∆ψ, left) and ATP levels (right) in RPE1 cells, cultured in either complete medium (control), medium lacking lipoproteins or lipoprotein-deficient medium supplemented with 50 µM oleic acid for 24 h. Bars represent mean ± s.e.m. of n = 3 (∆ψ) or n = 4 (ATP) independent experiments, respectively (two-way ANOVA, Bonferroni correction). c, Bright-field images (left) and quantification of viability (right) of the RPE1 cells from b. Bars represent mean ± s.e.m. of n = 3 independent experiments (two-way ANOVA, Bonferroni correction). Scale bar, 50 μm. d, Body weight of adult (22–28-week-old) mice. Bars represent mean ± s.e.m. of n = 8–15 mice (one-way ANOVA, Bonferroni correction). Het., heterozygous mice. e, Postnatal growth curves of male (left) and female (right) mice (Control designates both WT and heterozygous mice). Bars represent mean ± s.e.m. of n = 5–17 mice (two-way ANOVA, Bonferroni correction); male and female mice were analysed separately. f, Hepatic TAG levels in male mice, quantified at 3.5 and 6 weeks (arrows in e), expressed as a percentage of total lipids quantified (Extended Data Fig. 9l). Bars represent mean ± s.e.m. of n = 4–6 livers per condition (two-way ANOVA performed on the entire dataset, Bonferroni correction). g, Respiration exchange ratio (RER). Left, an increased RER indicates preferential carbohydrate oxidation (instead of lipids). Right, quantification of RER in male mice. Bars represent mean ± s.e.m. of n = 3 mice (two-way ANOVA, Bonferroni correction). h, The DGAT pathway (green) acylates DAG using exogenously derived fatty acyl-CoA (FA-CoA) whereas the TMX1–DIESL pathway (orange) uses endogenous fatty acyl chains derived from membrane phospholipids or their precursors. Source Data
Extended Data Fig. 1
Extended Data Fig. 1. Characterization of TAG synthesis and lipid storage in HAP1 cells and other cell lines.
a, Schematic representation of DGAT1- and DGAT2-specific inhibitors. b, TLC separation of neutral lipids from HAP1 cells treated with 50 µM oleic acid or 10 µM (each) DGATi for 16 h. CE, cholesteryl ester; TAG, triacylglycerol; DAG, diacylglycerol; FFA, free fatty acid; OA, oleic acid. c, TLC analysis of neutral lipids (left) and quantification of TAG (right) from HAP1 cells treated with 10 µM (each) DGATi for 72 h. Bars represent mean ± SEM of n = 3 independent experiments (Student’s t test, two-tailed). d, Sequencing peaks of the mutated DGAT1 and DGAT2 loci from a HAP1 DGAT DKO clone where a blasticidin resistance (BLASTres) cassette was integrated at each locus. Arrows represent the direction of amplification. e, TLC analysis of neutral lipids (left) and TAG quantification (right) from HAP1 WT and DGAT DKO cells. Bars represent mean ± SEM of n = 3 independent experiments (Student’s t test, two-tailed). f, Panel of cell lines treated with 200 µM oleic acid for 24 h. Neutral lipid loading is visualized by lipid droplets stained with BODIPY 493/503. Scale bars for HAP1 cells, 10 microns; scale bars for other cell lines, 20 microns. Source Data
Extended Data Fig. 2
Extended Data Fig. 2. TMX1 uniquely controls TAG accumulation.
a, Ultrastructural analysis of lipid droplets (red arrowheads) in HAP1 WT and TMX1 KO cells. Scale bars, 1 micron. b, TLC analysis of neutral lipids and Western blot analysis of proteins extracted from A549 (left) and U2OS (right) cells, transduced with Cas9 and a control sgRNA (sgCTRL) or sgRNA targeting TMX1 (sgTMX1), treated with 10 µM (each) DGATi for 72 h. c, Confocal imaging of TMX1 (green) and PDI (ER marker, red) in HAP1 cells. Hoechst 33342, blue; scale bar, 10 microns. d, Representation of TMX1 as the solution structure of its thioredoxin domain (PDB ID 1X5E) anchored to the membrane (left; the black box highlights the redox cysteines) as well as the TMX1 redox cycle (right). e, Immunoblot analysis from (left) and imaging of lipid droplets in (right) HAP1 ∆TMX1 cells rescued with untagged TMX1 WT, C59A or C56A/C59A (CC/AA) constructs. * indicates a non-specific band. Scale bar, 10 microns. f, Relative expression of TMX family members in HAP1 cells as determined by RNAseq. g, Topological representation of TMX family members. h, Domain structure of TMX family members. Location of antibody binding and sequence homology to TMX1 are indicated. Yellow and red circles represent catalytic cysteine and serine residues, respectively. ss, signal sequence; V5, simian virus 5 epitope tag; TXN, thioredoxin domain; TM, transmembrane helix. i, Immunoblot analysis of HAP1 DGAT TMX1 3KO cells expressing V5-tagged TMX family members. j, TLC analysis of neutral lipids (left) and quantification (right) in cells from i. Bars represent mean ± SEM of n = 3 independent experiments (one-way ANOVA, Bonferroni correction). k, Confocal imaging of lipid droplets (stained with BODIPY 665/676) in cells from i. Scale bar, 10 microns. Source Data
Extended Data Fig. 3
Extended Data Fig. 3. Genetics of lipid droplet regulation.
Genes related to the indicated cellular processes are labeled in the lipid droplet screens performed in oleic acid-loaded HAP1 WT cells (left column) and HAP1 ∆TMX1 cells (right column). Significant (FDR-corrected p < 0.05) positive and negative regulators are coloured light blue and orange, respectively. Genes of interest are coloured dark blue, red and dark grey.
Extended Data Fig. 4
Extended Data Fig. 4. DIESL is an ER membrane glycosylated acyltransferase that physically interacts with TMX1.
a, Localization of 3xHA-DIESL (green) in HeLa cells co-stained with the ER marker CANX (red). Hoechst 33342, blue; scale bar, 10 microns. b, HAP1 cells rescued with 3xHA-DIESL were subcloned, and three independent clones were then transduced with Cas9 and a control sgRNA (sgCTRL) or an sgRNA targeting TMX1 (sgTMX1). DIESL levels were assessed by immunoblot (left) and quantified (right). Bars represent mean ± SEM (Student’s t test, two-tailed) of n = 3 independent cell lines from one representative experiment. c, TMX1-dependent DIESL half-life was analyzed by a 24 hour-long cycloheximide chase in HAP1 cells rescued with 3xHA-DIESL, with or without TMX1 deletion. DIESL protein levels were analyzed by immunoblot (top) and quantified (bottom), normalized to ACTB. The cycloheximide concentration ranged from 200 to 3.125 µg/ml, using successive two-fold dilutions. Bars represent mean ± SEM of n = 3 independent experiments (two-way ANOVA, Bonferroni correction; ns, not significant). d, HeLa cells expressing 3xHA-DIESL were transduced with Cas9 and a control sgRNA (sgCTRL) or an sgRNA targeting TMX1 (sgTMX1). Cells were crosslinked with PFA prior to lysis and immunoblot analysis. x and m indicate the cross-linked TMX1-DIESL complex and corresponding monomer, respectively. e, Quantification of the 3xHA-DIESL coimmunoprecipitation of TMX1 in HAP1 cells shown in Fig. 3b. Fold enrichment over input is shown for TMX1, as well as CANX, PDI an EIF4G for n = 3 independent experiments (two-way ANOVA, Bonferroni correction; ns, not significant). f, TMX1 was co-immunoprecipitated from HAP1 cells rescued with DIESL in a buffer containing the indicated detergent (* indicates an antibody chain). Tw-20, Tween-20; DDM, n-dodecyl-beta-maltoside. g, An N-glycosylation motif (N-X-S/T) is conserved at the DIESL N-terminus. h, Deglycosylation of DIESL N-glycans by PNGaseF. Glycosylation was assessed by immunoblot, where LAMP1 served as a positive control. i, DIESL is glycosylated at N5 at the steady-state. HAP1 ∆DIESL cells reconstituted with the indicated 3xHA-DIESL construct were treated with 1 µg/ml tunicamycin (an inhibitor of N-linked glycosylation) for 16 h. The lower and higher HA bands represent the unglycosylated and N-glycosylated forms of 3xHA-DIESL, respectively. j, HAP1 ∆DIESL cells rescued with 3xHA-DIESL were treated with 5 µg/ml brefeldin A for the indicated period of time, and DIESL glycosylation status was assessed by immunoblot. The N5Q mutant is not glycosylated. k, N5Q is the single N-glycosylation site, as this construct and a mutant lacking arginines (N0, where all arginines have been mutated to glutamine) show an identical band pattern upon brefeldin A treatment. l, TLC analysis of neutral lipids (top) and quantification of TAG (bottom) in HAP1 DGAT DIESL 3KO cells, with or without additional ablation of TMX1, reconstituted with the indicated 3xHA-DIESL construct. Bars represent mean ± SEM of n = 4 independent experiments (one-way ANOVA, Bonferroni correction). m, AlphaFold model of human DIESL (Q96MH6) colored by pLDDT (left), active site histidine (centre) or hydrophobicity (right). n, Schematic of DIESL in the ER membrane with the lumenal domain indicated (top) and depiction of DIESL constructs with or without the 49 amino acid-containing, N-terminal lumenal domain (bottom). o, Immunoblot of HAP1 ∆DIESL cells reconstituted with full-length DIESL (FL) or DIESL lacking the lumenal domain (50-324), each with (WT) or without (H130A) an intact active site. * indicates a non-specific band. p, Depiction of the DIESL catalytic pocket as modeled by Alphafold (left) with H130 in blue, depicting both the backbone (left) and the surface (right), as viewed from the surface of the membrane, as well as the DIESL catalytic dyad (right). Source Data
Extended Data Fig. 5
Extended Data Fig. 5. Perturbation of the lipidome by DIESL.
a, TLC analysis of neutral lipids (left) and TAG quantification (right) in HAP1 DGAT DKO and DGAT DIESL 3KO cells. Bars represent mean ± SEM of n = 3 independent experiments (Student’s t test, two-tailed). b, TLC separation of neutral lipids and immunoblot analysis of HAP1 cell lines reconstituted with 3xHA-DIESL WT or H130A (* indicates a non-specific band). c, Absolute lipid abundance in HAP1 4KO cells (∆DGAT1∆DGAT2∆DIESL∆TMX1) reconstituted with 3xHA-DIESL WT or H130A as determined by shotgun lipidomics. CE, cholesteryl ester; TAG, triacylglycerol. Bars represent mean ± SEM of n = 3 independent samples. d, Lipidome of 4KO cells, either naïve (control) or expressing WT or H130A DIESL. Each species is represented as percent of the total lipid abundance in the respective samples, where 1292 unique lipid species were detected. Bars represent mean ± SEM of n = 3 biologically-independent cell lines examined in a single experiment (two-way ANOVA, Bonferroni multiple-comparison correction; all significant differences between WT and H130A cells are indicated). CE, cholesteryl ester; TAG, triacylglycerol; DAG, diacylglycerol; PA, phosphatidic acid; (e)PC, (ether-linked) phosphatidylcholine; (e)PE, (ether-linked) phosphatidylethanolamine; PG, phosphatidylglycerol; PI, phosphatidylinositol; PS, phosphatidylserine; CL, cardiolipin; SM, sphingomyelin; (Hex)Cer, (hexosyl)ceramide; LPL, lysophospholipid. e, Relative abundance of ePC and PC species (grouped by acyl chain length and saturation) in HAP1 4KO cells expressing WT and H130A DIESL, expressed as a fraction of the levels in H130A cells. Bars represent mean ± SEM of n = 3 biologically-independent cell lines examined in a single experiment. f, Distribution of ePC, PC and all other phospholipid (PL) species (grouped by acyl chain length and saturation) in HAP1 4KO cells expressing WT and H130A DIESL, expressed as a percentage of the total amount of that species detected in that condition. Bars represent mean ± SEM of n = 3 biologically-independent cell lines examined in a single experiment. g, Distribution of ePC, PC and all other phospholipid(PL) species, grouped by sn-2 chain length (left) and saturation (right), in HAP1 4KO cells expressing WT and H130A DIESL. Bars represent mean ± SEM of n = 3 biologically-independent cell lines examined in a single experiment (two-way ANOVA, Bonferroni multiple-comparison correction; ns, not significant). Source Data
Extended Data Fig. 6
Extended Data Fig. 6. NBD-DAG acylation by DIESL in HAP1 cells.
a, Chemical structure of NBD-DAG. b, Complete TLC plate from Fig. 4i. c, Analysis of NBD-DAG acylation (by NBD fluorescence) by TLC separation of polar lipids. HAP1 WT, DGAT DKO and DGAT DIESL 3KO cells were incubated with 25 µM NBD-DAG in the presence or absence of 50 µM oleic acid for one hour prior to lipid extraction. d, Quantification of NBD-TAG in TLCs from b (top) and c (bottom). Bars represent mean ± SEM of n = 3 independent samples (two-way ANOVA, Bonferroni correction; ns, not significant). e, Confocal imaging of HAP1 DGAT TMX1 3KO labeled with 50 µM TopFluor-DAG. After fixation, membranes were extracted with 0.1% TX-100 and lipid droplets were subsequently stained with BODIPY 665/676. Hoechst 33342, blue; scale bar, 5 and 1 microns. Source Data
Extended Data Fig. 7
Extended Data Fig. 7. Steady-state DIESL activity.
a, TLC analysis of neutral lipids extracted from 293T cells treated with 10 µM (each) DGATi for 48 h. Cells were edited using CRISPR/Cas9 with a sgRNA targeting DIESL (sgDIESL) or a control sgRNA (sgCTRL). Bars represent mean ± SEM of TAG intensity from n = 3 independent experiments. b, TLC analysis of neutral lipids extracted from HT29 (left) and U251 (right) cells, treated with 10 µM (each) DGATi for 48 h. Cells were edited as in a with sgRNAs targeting DIESL (sgDIESL) or TMX1 (sgTMX1), as well as a control sgRNA (sgCTRL). Bars represent mean ± SEM of TAG intensity from n = 3 independent experiments. Source Data
Extended Data Fig. 8
Extended Data Fig. 8. DIESL maintains mitochondrial function.
a, Immunoblot analysis (left) and quantification (right) of phosphorylated AMPK in the indicated cell lines transduced with Cas9 and either a control sgRNA (“sgCTRL”) or an sgRNA targeting DIESL (“sgDIESL”). Cells were cultured in complete medium (DMEM with lipoproteins) or in lipoprotein-depleted medium for 24 h (RPE1 cells) or 48 h (HT29 and U251 cells). Bars represent mean ± SEM of n = 3 independent experiments (two-way ANOVA, Bonferroni correction; ns, not significant). b, Immunoblot analysis (left) and quantification (right) of AMPK phosphorylation in 293T cells, transduced with Cas9 and the indicated sgRNA, cultured as in a for 48 h, additionally treated with 10 µM (each) DGATi where indicated. * represents a non-specific band. Bars represent mean ± SEM of n = 3 independent experiments (two-way ANOVA, Bonferroni correction). c, Mitochondrial ROS measurements in RPE1 cells cultured in lipoprotein-replete or -depleted conditions for 24 h. Cells were stained with MitoTracker Red CM-H2XROS and fluorescence was analyzed by flow cytometry. Bars represent mean ± SEM of n = 3 independent experiments (two-way ANOVA, Bonferroni correction). d, Immunoblot analysis of S6 phosphorylation in RPE1 cells cultured in complete medium or lipoprotein-depleted medium with or without 50 µM oleic acid for 24 h. FASN levels are a control for lipid starvation. e, Imaging (left) and quantification (right) of autophagosome content of RPE1 cells cultured in lipoprotein-replete or -depleted conditions for 24 h. Autophagosomes were identified by LC3B puncta (green), which were thresholded. Hoechst 33342, blue. Scale bar, 10 microns. Bars represent mean ± SEM of n = 40 to 51 cells (two-way ANOVA, Bonferroni correction; ns, not significant). f, Quantification of ATP levels in RPE1 sgDIESL cells cultured for 24 h under the indicated conditions; 50 µM oleic acid, 10 µM (each) DGATi, 20 µM etomoxir. Bars represent mean ± SEM of n = 4 independent experiments (one-way ANOVA, Bonferroni correction; ns, not significant). g, Brightfield images of 293T cells (left), and quantification of cell number of 293T cells (centre) and U251 cells (right) cultured under the indicated conditions for 24 h. Bars represent mean ± SEM of n = 3 independent experiments (two-way ANOVA, Bonferroni correction; ns, not significant). Scale bar, 50 microns. Source Data
Extended Data Fig. 9
Extended Data Fig. 9. Characterization of Diesl KO mice.
a, Depiction of the loss-of-function allele harbored by Diesl KO mice. The disruptive gene-trap (SA, splice acceptor), lacZ and neomycin resistance cassette (neores) are integrated between exons 4 and 5 of the mouse Diesl gene. A, B and C represent primers used to map the integration of the cassette. b, PCR amplification of the Diesl/Tmem68 genetic locus and integration of the gene-trap. PCR products were separated by agarose gel electrophoresis. Primer pairs indicated in the figure correspond to those denoted in a. c, DIESL mRNA was detected by RT-PCR using cDNA prepared from mouse liver, with primers spanning the exon junction of exons 4 and 5. ACTB mRNA was used as a loading control. PCR products were separated by agarose gel electrophoresis. d, Body length of adult male (circles) and female (squares) WT and Diesl KO mice. Bars represent mean ± SEM of n = 3 to 5 mice examined in a single experiment (two-tailed Student’s t test). e, Body composition of adult WT and Diesl KO male mice as determined by MRI. Bars represent mean ± SEM of n = 3 male mice (two-way ANOVA, Bonferroni correction). f, Serum lipid profile of adult male mice of the indicated genotype, as determined by assay. Bars represent mean ± SEM of n = 20 to 24 mice examined in a single experiment (two-tailed Student’s t test; ns, not significant). g, Whole-brain TAG content of 6-week-old male mice of the indicated genotype as measured by mass spectrometry. Bars represent mean ± SEM of n = 4 mice (two-tailed Student’s t test). h, Body weight- (BW-) corrected weights of organs harvested from adult WT and Diesl KO male mice. Bars represent mean ± SEM of n = 3 mice (two-way ANOVA, Bonferroni correction; ns, not significant). i, Representative images of liver sections, collected from adult WT and Diesl KO male mice, stained with H&E. Scale bar, 50 microns. j, Food intake of adult male (circles) and female (squares) WT and Diesl KO mice, measured over a 24-hour period (left) and then corrected for body weight (BW, right). Bars represent mean ± SEM of n = 3 to 5 mice examined in a single experiment (two-way ANOVA, Bonferroni correction; ns, not significant). k, Categorized hepatic lipid levels in male mice (fed ad libitum), measured at 3.5 and 6 weeks using shotgun lipidomics, expressed as a percentage of total lipids measured in the sample. Bars represent mean ± SEM of n = 4 to 6 livers per condition, examined in a single experiment (two-way ANOVA performed on the entire dataset, Bonferroni correction; ns, not significant). l, TAG fingerprint in the liver of male mice (fed ad libitum) measured at 3.5 weeks of age, expressed as the fold-change of the average of the Diesl KO (n = 5 mice) over the average of WT mice (n = 6 mice). Source Data

References

    1. Shulman GI. Ectopic fat in insulin resistance, dyslipidemia, and cardiometabolic disease. N. Engl. J. Med. 2014;371:1131–1141. doi: 10.1056/NEJMra1011035. - DOI - PubMed
    1. Quehenberger O, Dennis EA. The human plasma lipidome. N. Engl. J. Med. 2011;365:1812–1823. doi: 10.1056/NEJMra1104901. - DOI - PMC - PubMed
    1. Walther TC, Chung J, Farese RV., Jr Lipid droplet biogenesis. Annu. Rev. Cell Dev. Biol. 2017;33:491–510. doi: 10.1146/annurev-cellbio-100616-060608. - DOI - PMC - PubMed
    1. Dahlqvist A, et al. Phospholipid:diacylglycerol acyltransferase: an enzyme that catalyzes the acyl-CoA-independent formation of triacylglycerol in yeast and plants. Proc. Natl Acad. Sci. USA. 2000;97:6487–6492. doi: 10.1073/pnas.120067297. - DOI - PMC - PubMed
    1. Cases S, et al. Identification of a gene encoding an acyl CoA:diacylglycerol acyltransferase, a key enzyme in triacylglycerol synthesis. Proc. Natl Acad. Sci. USA. 1998;95:13018–13023. doi: 10.1073/pnas.95.22.13018. - DOI - PMC - PubMed