. 2023 Sep;621(7980):796-803.
doi: 10.1038/s41586-023-06478-7. Epub 2023 Aug 30.

Hippocampal representation during collective spatial behaviour in bats

Affiliations

Hippocampal representation during collective spatial behaviour in bats

Angelo Forli et al. Nature. 2023 Sep.

Abstract

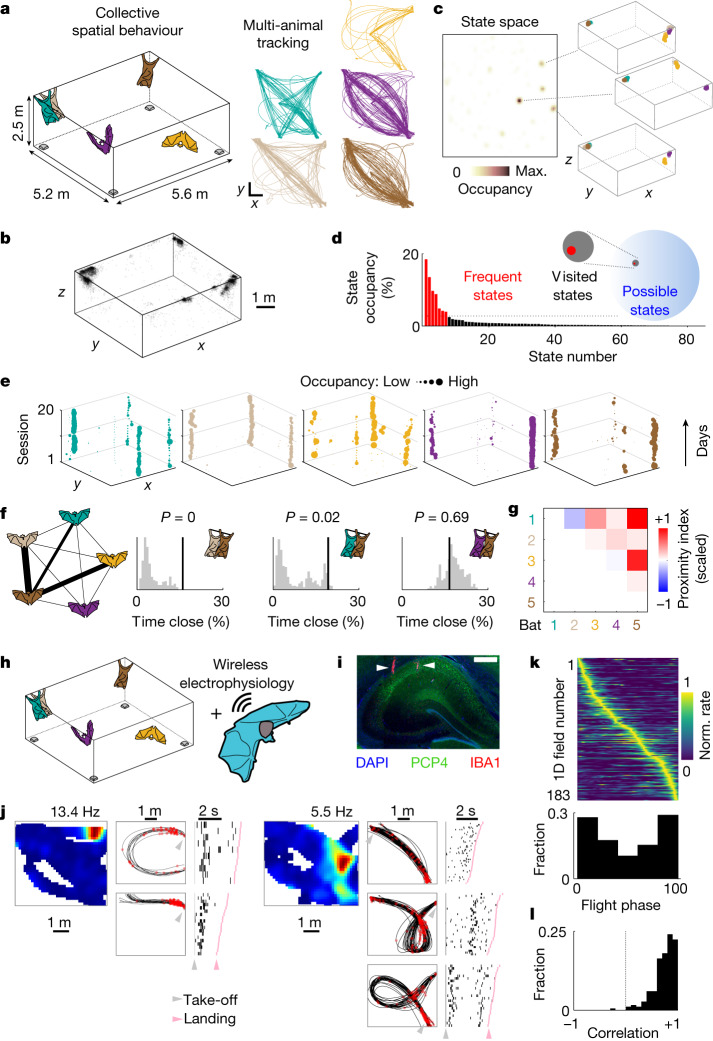
Social animals live and move through spaces shaped by the presence, motion and sensory cues of multiple other individuals1-6. Neural activity in the hippocampus is known to reflect spatial behaviour7-9 yet its study is lacking in such dynamic group settings, which are ubiquitous in natural environments. Here we studied hippocampal activity in groups of bats engaged in collective spatial behaviour. We find that, under spontaneous conditions, a robust spatial structure emerges at the group level whereby behaviour is anchored to specific locations, movement patterns and individual social preferences. Using wireless electrophysiological recordings from both stationary and flying bats, we find that many hippocampal neurons are tuned to key features of group dynamics. These include the presence or absence of a conspecific, but not typically of an object, at landing sites, shared spatial locations, individual identities and sensory signals that are broadcasted in the group setting. Finally, using wireless calcium imaging, we find that social responses are anatomically distributed and robustly represented at the population level. Combined, our findings reveal that hippocampal activity contains a rich representation of naturally emerging spatial behaviours in animal groups that could in turn support the complex feat of collective behaviour.


Conflict of interest statement

The authors declare no competing interests.

Figures

Fig. 1
Fig. 1. Collective spatial behaviour and hippocampal electrophysiology in groups of bats.
a, Left, schematic of the experiment: groups of bats were tracked by a RTLS (sample devices shown in grey). Right, the tracked positions of five bats during a representative session (different colours, top view). In this case, a bowl of food (banana) was placed in the centre of the room. Scale bars, 1 m. b, The resting positions from all of the bats and sessions (random subsample of 7,685 points; reward locations are excluded). c, Colour-coded occupancy in the state space for one representative session: each state corresponds to a configuration of five bats. The three most common configurations are shown on the right (different bats are indicated by different colours). Max., maximum. d, The state occupancy distribution for the same session shown in c. Frequent states (Methods) are indicated in red. Inset, scaled representation of the number of possible, visited and frequent states for that session. Note that, as a group, an extremely limited fraction of all of the possible states is occupied. e, Preferred resting locations (xy projection) of each bat (different colours) across consecutive sessions (vertical axis) involving the same group. The marker size was scaled to occupancy. f, Left, schematic of the social structure from one representative session. The edge thickness is proportional to the significance of social proximity (Methods; thick edges, P < 0.001, P < 0.01 and P < 0.05; thin edges, not significant). Right, empirical values (black lines), shuffled distributions (grey histograms) and associated P values (top) for the percentage of time that specific bat pairs spent in close contact. The pairs are from the graph on the left. g, Matrix of average proximity indexes (Methods; scaled to the maximal observed value) for the same group and sessions shown in e. h, Schematic of the experimental paradigm for wireless electrophysiology recordings during collective behaviour. i, A coronal section of the dorsal hippocampus in one recorded bat, stained for 4′,6-diamidino-2-phenylindole (DAPI), PCP4 and IBA1 (Methods). The white arrows denote tetrode tracks. Scale bar, 500 µm. Tetrode localization in the hippocampus was histologically confirmed for each recorded bat (n = 5 bats). j, Spatial firing of two example cells recorded in the group context. 2D firing field (top view, peak firing rate indicated) is shown on the left. Firing on repeated flight paths is shown both in space (middle; trajectories are shown in black and spikes are shown in red) and time (right; raster plots, sorted by flight duration relative to take-off and landing). k, Top, the trial-averaged activity from all significant firing fields recorded on flight paths across bats, rescaled from take-off to landing and sorted by location of peak activity. Bottom, the distribution of the fields’ peak location as a function of flight phase (0 is take-off, 100 is landing) for the same 1D fields shown on top (n = 183 1D fields from 95 cells, 3 bats). Norm., normalized. l, Correlation values between firing fields calculated on random halves of the trials, for the same fields as in k. Source Data
Fig. 2
Fig. 2. Hippocampal activity is modulated by the social nature of flights.
a, Left, histogram and cumulative distribution (CDF) of the distance from the nearest-neighbour (NN) bat at landing. Right, flights are divided into social (red area) and non-social (grey area) on the basis of the nearest-neighbour bat distance (Methods). b, An example unit modulated by the social nature of a flight. Left, top view of flight paths during social (red, bat at the landing spot) and non-social (black) flights. Note that trajectories for social and non-social flights are highly overlapping. Right, the average firing rate (top) and raster plot (bottom) during social (red) versus non-social (black) flights. The shaded areas indicate the s.e.m. Flights are sorted by nearest-neighbour bat distance at landing (right). Scale bars, 1 m. c, 2D heat map of positions relative to take-off or landing locations when social modulation of firing rates occurred (normalized to maximum incidence (max. inc.); n = 34 cells × location; 10 around take-off, 24 around landing, 31 cells from 3 bats). d, The distribution of firing modulation relative to the baseline (the same cells and locations as in c). e, Landing positions from all bats (randomly subsampled for visualization; black) and average trajectories of the object (blue) for all sessions. Note that the object (which was controlled from outside the room) moves between common landing locations for the bats. f, An example unit modulated by the presence of a bat at the landing location, but not by the object. Left, top view of landing trajectories during flights landing on an empty location (black), close to an object (blue) or to a bat (red). Note that trajectories are highly overlapping. Right, the average firing rate (top) and raster plot (bottom) during the flight types described above. The shaded areas indicate the s.e.m. g, Left, the distribution of firing modulation relative to the baseline for neurons modulated by an object (blue, n = 15 cells × location, 14 cells from 2 bats) or a bat (red, n = 33 cells × location, 29 cells from 2 bats). The triangles indicate the respective median values. Right, summary of the numbers of cells that were responsive to a bat (red) and/or to an object (blue). Responses to the bat were significantly different compared with responses to the object (P < 0.05; Methods) for the large majority of both cell classes (84% bat modulated, 71% object modulated). h, Schematic of flights to a specific target bat (left; purple bat) and flights not to the target bat (right; the target bat is absent). i, Three representative units showing modulation of firing, around take-off or landing, for flights to a target bat that was present (colour) or absent (grey). The average firing modulation (top; shaded area is s.e.m.) and raster plots (bottom) are shown. j,k, Positions relative to take-off or landing locations (j) and the distribution of firing modulation relative to the baseline (k) as described in c and d, respectively, but for cells modulated by a specific target bat (n = 89 cells × location × target bat; 47 around take-off, 42 around landing, 58 cells from 3 bats). l, Modulation for flights to a specific target bat (vertical axis) versus flight to any bat (equivalent to social versus non-social; horizontal axis). Each marker represents a triplet (cell × location × target bat, n = 88 triplets, 58 cells from 3 bats). The marker colour indicates the fraction of flights that share the same class (to the target or not to the target, or to any or to none). Note that modulation is significantly higher (above the unity line) for specific bats compared with the presence or absence of any bat (P = 5 × 10−14, Wilcoxon signed-rank test). m, Modulation scores (Methods) for flights to a specific target bat versus flights to different target bats. The line colour indicates the fraction of flights that share the same class (to the target, not to the target) when considering the target bat and a different bat (n = 56 pairs, 19 cells from 3 bats; P = 9.5 × 10−11, Wilcoxon signed-rank test). n, Top, schematic of social proximity between the recorded bat (grey) and either the target bat (purple) or a different bat (brown). Bottom, the normalized proximity index (bars represent the average, markers show single values; Methods) between the recorded bat and either the target or a different bat (n = 30 cells from 3 bats; P = 0.03, Wilcoxon signed-rank test). The error bars represent the s.e.m. *P < 0.05, ***P < 0.001. Source Data
Fig. 3
Fig. 3. During rest, hippocampal neurons are sensitive to others’ behaviour but not identity.
a, Top, schematic of the flights of other bats while the recorded bat is not moving. Bottom, the number of flights from other bats during the recorded sessions. b, Accelerometer signal (absolute deviation from g; colour bar; Methods) recorded from the implanted bats around take-off of other bats. Fifty traces corresponding to the raw accelerometer signal during low-mobility trials (top inset) or high-mobility trials (bottom inset) are shown on the right. c, Two representative units that were significantly modulated around the take-off of other bats. Top, raster plots. Bottom, the average firing rate. The shaded areas indicate the s.e.m. Note the decrease in firing around the take-off of other bats. d, The trial-averaged firing rate for all units that were significantly modulated around the take-off of other bats (n = 128 cells from 3 bats), sorted by the time of significant modulation. The average across all cells is shown below. The shaded area indicates the s.e.m. e, The average firing rate in stationary bats and echolocation rate (z-scored, median number of take-off events per cell was 118) around the take-off of other bats (n = 84 cells from 3 bats). The shaded area indicates the s.e.m. f, The selectivity index (SI) of hippocampal responses during flights of specific bats: empirical (vertical axis) versus shuffled (horizontal axis) data. A selectivity index was calculated for each resting position of the recorded bat (n = 149 cells × position from 113 cells, 3 bats). Significant values (Methods) are shown in green. Source Data
Fig. 4
Fig. 4. Functional and anatomical organization of social responses at the population level.
a, Schematic of the experimental paradigm for wireless imaging during collective behaviour. b, Left, a coronal section of the dorsal hippocampus from one imaged bat: GRIN lens profile (white dotted lines) and neurons expressing GCaMP6f (green) that were stained for nuclear DAPI (blue). Scale bar, 500 µm. Right, intensity correlation image for one representative FOV showing the imaged cells (bright white). c, Fluorescence time series from 115 simultaneously imaged ROIs during group spatial behaviour. Inset, magnification of calcium activity around flights of the imaged bat (blue lines). The cells are from the FOV shown in b. d, Example activity traces and respective averages for socially modulated ROIs during social (red traces and the bottom portion of the heat maps) or non-social (black traces and top portion of the heat maps) flights around landing. The shaded areas indicate the s.e.m. e, Left, each dot represents the first two principal components (PCs) of ensemble activity around single trials of social (red) or non-social (black) landing. All landings are pooled together (Methods), and activity is shown for socially modulated versus unmodulated cells. Right, the distance between centroids (principal component space) for the neural activity around social versus non-social landings for socially modulated (magenta) or unmodulated (grey) cells (P = 1.2 × 105, Wilcoxon signed-rank test, n = 25 landings from 24 FOVs, 3 bats). f, The accuracy in decoding social versus non-social landing (grey area) or the landing position (among the two most common, white area), using activity from different cell ensembles (Methods). Note that, in both cases, chance level is 0.5 (from left to right, P = 6.49 × 10−6, P = 0.97, P = 6.48 × 10−6, P = 1.2 × 10−5 and P = 0.30, one-sided Wilcoxon signed-rank test; n = 25 landings from 24 FOVs, 3 bats). NS, non-significant. g, Top, segmented cell profiles for the same FOV shown in b (socially modulated cells shown in magenta). Bottom, cumulative distribution function of the pairwise cell distances for socially modulated cells (magenta) and a matched number of randomly sampled neurons (1,000 samples per FOV, black). Inset, a magnified region of the plot. P = 0.156, two-sample Kolmogorov–Smirnov test; NS, P > 0.05. n = 3,548 pairwise distances from n = 24 FOVs, 3 bats. px, pixels. The box plots in e and f show the maximum and minimum values (whiskers), median (centre line) and the 25th to 75th percentiles (box limits). Source Data
Extended Data Fig. 1
Extended Data Fig. 1. Real-Time-Location-System for tracking multiple animals.
a, Schematic depiction of the Real-Time-Location-System. A set of static anchors (grey) communicate with a mobile tag (inset) for localization. The tag is mounted on a collar, carried by a bat. b, Arrangement of the anchors in the experimental room: eight anchors are mounted on the ceiling (purple), four on the walls (blue) and four on the ground (cyan). c, Two example flights executed by a bat simultaneously tracked with the RTLS system and a marker-based system with millimetre-resolution (Methods). d, Distribution of tracking errors in the xy (parallel to the floor) and z (vertical) dimensions. Tracking errors are calculated as the difference between the RTLS position and the marker-based position (n = three bats tracked by both systems across eight sessions), after rigid registration of the coordinate systems.
Extended Data Fig. 2
Extended Data Fig. 2. Group foraging datasets and associated behavioural quantifications.
a, Description of the main datasets included in this study. From top to bottom, each row indicates name of the dataset, food source (Methods), total number of recorded sessions, total number of bats simultaneously involved in the daily sessions. b, Number of flights executed by individual bats (different colours) across the corresponding dataset (a). For this panel, as well as for c-e, single session values are reported (markers), together with summary statistics for each bat (box: median, lower, and upper quartiles; lines: minimum and maximum values that are not outliers, ‘n’ corresponds to the number of sessions for each bat in the examined dataset). c, Exploration ratio (fraction of visited locations, Methods) of individual bats across the sessions from the corresponding dataset (a). d, Fraction of samples during rest that were part of a clustered location (Methods) for individual bats across the sessions from the corresponding dataset (a). e, Fraction of time spent close to a feeding location, for individual bats across the sessions from the corresponding dataset (a). f, Average spatial correlation between occupancy maps of individual bats on consecutive sessions (session j and session j+1; solid line) and average spatial correlation between occupancy maps from different bats on the same session (dashed line). Data are shown for all the sessions associated with a given dataset (a). Stars above the plot indicate the significance level of the difference between self-correlations and others-correlations (p = 2 x10⁻⁴, 4 x10⁻⁴, 6 x10⁻⁵, 0.016, 2 x 10⁻³, 4 x10⁻³, Wilcoxon signed rank test, ***: p < 0.001, **: p < 0.01; *: p < 0.05, number of sessions indicated in ‘a’).
Extended Data Fig. 3
Extended Data Fig. 3. Proximity index stability over days.
a, Colour-coded maps for the proximity index matrices across days. Each entry of the matrix represents the proximity index between a pair of bats on a given experimental day (Dataset 1, Methods). b, Correlation between proximity indexes for all bat pairs on a given day and the mean pairwise proximity index across all other days. Values refer to the same group of five bats and are averaged across three different datasets (Datasets 1,3 and 4; minimal shared days of exposure: 13 days). c, Epochs from three example recorded bats, showing the evolution across days of their proximity indexes (columns) relative to other bats (coloured numbers on the left of the first example bat). Arrows indicate cases of stable social preferences (additional stable preferences can be easily identified).
Extended Data Fig. 4
Extended Data Fig. 4. Hippocampal spatial activity in the group context.
a, Example colour-coded firing rate maps in 2D (x, y). Average firing rate in each x-y spatial location is represented from 0 Hz (dark blue) to the peak rate for the cell (red, noted to the top-right of each map). Total number of spatially informative cells in 2D: 108 out of 147 flight-active cells from three bats (Methods). b, Trial-averaged activity from all significant firing fields recorded on flight paths (n = 183 fields from 95 units and three bats; Methods), calculated on random halves of the trials. Activity is rescaled between takeoff (Flight Phase: 0) and landing (Flight Phase: 100). The plot on the left is sorted by the location of peak activity; same sorting is applied to the plot on the right.
Extended Data Fig. 5
Extended Data Fig. 5. Example socially modulated neurons around landing.
Example cells whose firing is modulated by the social nature of a flight around landing time. The proximity of another bat to the landing location (red firing profile and lower part of the raster plots) can correspond to both an increase (a, b and d) or a decrease (c and e) in the firing rate of the recorded cells. This modulation is not associated to systematic differences in landing positions (note the fairly random profiles of x and y coordinates at landing). a-e, For each unit, the top part of the panel shows the average firing rate around landing for social (red) vs. nonsocial (black) flights. Shaded areas represent SEM. The bottom part of the panel displays the spike raster plot around landing, the distance from nearest-neighbour bat (NN-bat) and the x, y coordinates at landing for all the flights executed during the session, sorted by the NN-bat distance.
Extended Data Fig. 6
Extended Data Fig. 6. Modulation scores calculation.
Description of the procedure for the calculation of the modulation scores (Methods). Scores were calculated for a given neuron and anchoring location (takeoff or landing, pink circle on the left, positionj) with enough flights (Methods). Scores were calculated for two cases: social vs. nonsocial flights, by considering the nearest-neighbour bat distance at landing (NN-bat) or flights to target bat vs. not to target bat, by considering the distance from a specific bat at landing (bati). Here we describe the procedure for social vs. nonsocial flights (a similar method was applied for flights to target bat vs. not to target bat, Methods). Flights were sorted based on the NN-bat distance at landing and classified as social (landing close to a bat, red) or nonsocial (landing far from a bat, blue). A subsample of five social vs. five nonsocial flights was extracted at random – to balance the number of social vs. nonsocial trials - and firing frequency, position, heading and acceleration in the time bin of interest were calculated. The differences between average firing frequency, position, heading and acceleration for social vs. nonsocial flights were tested for significance by comparing their empirical values against a shuffled distribution obtained by randomly permuting the category of a flight (social vs. nonsocial) 100 times and recalculating the same differences on the considered subsample of flights. This procedure was repeated 100 times, across different random subsamples of five social vs. five nonsocial flights, thus obtaining 100 p-values for differences in the variables of interest. Modulation scores for each of the four variables of interest (firing, position, heading and acceleration) were calculated as the fraction of subsamples with significant (p < 0.05) differences in the associated variable between social and nonsocial flights.
Extended Data Fig. 7
Extended Data Fig. 7. Modulation scores for socially modulated neurons.
Modulation scores for differences in firing, position, heading and acceleration for the socially modulated neurons (n = 34 cells x locations; 10 around takeoff, 24 around landing, 31 cells from three bats). The threshold (red dashed line) indicates the minimal firing score and the maximal positional and kinematic scores, to be classified as a socially modulated neuron under this conservative exclusion criteria (Methods). Bars represent the average, markers represent single values.
Extended Data Fig. 8
Extended Data Fig. 8. Object experiment: additional quantifications and single unit responses.
a, Illustration of the experiment involving three bats and an object (red Styrofoam ball, pictures). The object could be moved between locations in the room where bats land for resting (perch) or feeding (feeder). Scale-preserving representation of a typical bat (perching pose) and the object that was used in the experiments is shown on the right. b, Histogram of the distances at landing relative to the object (top) or the bats (bottom). Flights are divided into object/bat-present (blue/red area) or absent (grey areas), based on the respective distances (Methods). c, Top: trial-averaged activity from all significant spatial firing fields recorded during the object-experiment on flight paths (n = 84 fields from 2 bats), rescaled from takeoff to landing and sorted by location of peak activity. Bottom: distribution of the fields’ peak location as a function of flight phase (0 is takeoff, 100 is landing) for the same 1D fields shown on top. d, Example units recorded during the object experiment. Left of each example: Top view of landing trajectories during flights landing in the location (triangle) when it is empty (black), object is present (blue) or bat is present (red). Note that trajectories are highly overlapping. Right of each example: average firing rate (top) and raster plot (bottom) during the above flight types. Shaded areas indicate SEM. Note that units can also be largely unaffected by the presence of an object or a bat at the landing location (last example on the right).
Extended Data Fig. 9
Extended Data Fig. 9. Features of the socially modulated neurons for specific target bats.
a, Modulation scores for differences in firing, position, heading and acceleration for the socially modulated neurons around flights to specific target bats (n = 89 cells x location x target bat; 47 around takeoff, 42 around landing, 58 cells from three bats). The threshold (red dashed line) indicates the minimal firing score and the maximal positional and kinematic scores, to be classified as a socially modulated neuron under this conservative exclusion criteria (Methods). Bars represent the average, markers represent single values. b, Distribution of the average distance between positions (during neural modulation) for flights to target bat vs. flights not to target bat, for all the socially modulated neurons shown in (a) (light blue), compared with the average field-width calculated for all significant 1D-fields (n = 183 fields from 95 units and three bats, light brown). The average field width is calculated as the average width in x, y, and z (where the firing frequency dropped below the half-maximal frequency at the centre of the field). Note that positional differences between flights for socially modulated cells are much smaller than the typical field size (p = 3.8 x 10⁻²⁰, n = 89 pairs of flights to target bat vs. not to target bat, n = 183 1D-fields, Wilcoxon rank sum test). c, Fraction of detected cells modulated by a target bat binned by the number of days of exposure to the experiment (chi-square goodness-of-fit test against a uniform distribution: p = 0.0012, n = 45 cells from three bats). d, same as in c, for cells modulated by a target bat using less stringent criteria not involving the modulation scores (Methods). Incidence of socially modulated cells was significantly different from a uniform distribution (p = 0.008, n = 65 cells from three bats, chi-square goodness-of-fit test). e, Social modulation for flights to a specific target bat (vertical axis) versus number of days of exposure to the experiment (horizontal axis). Each marker represents a triplet (cell x location x target bat; n = 89 triplets, 58 cells from three bats). Line represents the least-squares interpolating line. ns means non-significant correlation (c = 0.12, p = 0.25). f, same as in e, for cells modulated by a target bat using less stringent criteria (Methods). Pearson’s c = 0.02, p = 0.74, n = 194 cells x location x target bat, 87 cells from three bats. g, Social modulation for flights to a specific target bat (vertical axis) versus distance from the target bat at the time of the modulation (horizontal axis). Each marker represents a triplet (cell x location x target bat, n = 89 triplets, 58 cells from three bats). Line represents the least-squares interpolating line (c = 0.17, p = 0.1). Correlation was not significant also when separately considering cells modulated around takeoff or landing (c = -0.13, p = 0.37, n = 47 around takeoff, c = −0.15, p = 0.34, n = 42 around landing). h, Same as in g, but for modulated cells during social vs. nonsocial flights (n = 34 cells x location, 31 cells from three bats; c = 0.06, p = 0.73). i, Distributions of the number of positions per neuron and number of target bats per position, for all the socially modulated neurons included in (a). Note that most of the cells are socially modulated around one single location and for a single target bat. ns indicates non-significant correlation.
Extended Data Fig. 10
Extended Data Fig. 10. Interplay between spatial and social responses in empirical and simulated data.
a, Venn diagram summarizing the numbers of cells that were spatially informative on flight paths (green) and/or socially modulated by a target bat (magenta). b, Distribution of spatial information for different cell classes (blue vs green in a), p = 0.012, Wilcoxon rank sum-test. c, Distribution of the fields’ peak location as a function of flight phase (0 is takeoff, 100 is landing) for the same cell classes shown in b. d, Top: schematic description of the simulations, generated by combining observed group behaviour (top) with simulated neurons (bottom). e, Top: trial-averaged activity from all significant spatial firing fields generated by simulating three different neuronal types (Methods), rescaled from takeoff to landing and sorted by location of peak activity. Bottom: distribution of the fields’ peak location as a function of flight phase (0 is takeoff, 100 is landing) for the same 1D fields shown on top. f, Accuracy above chance for decoding the landing location (left), the social nature of a flight (centre) or both (right), using activity from different simulated cell classes, as a function of the number of neurons (max corresponds to ~30 neurons for all cell classes, methods).
Extended Data Fig. 11
Extended Data Fig. 11. Examining alternative reward-related explanations for the social modulation.
a, Left: Schematic description of leader-follower dynamics, where flights to food reward of one bat are preceded or followed by similar flights of another bat at a brief time interval. Right: Incidence of significantly coupled pairs of bats across datasets (Methods). b, Left: Schematic description of the first reward-related alternative explanation: neural responses are caused by reward being blocked by another bat. Right: 2D-distribution of landing locations where cells were socially modulated (or modulated by a specific target bat) vs. reward locations in the same sessions. Note that there is little overlap between the two. c, Left: Schematic description of the second reward-related alternative explanation: neural responses are associated with opportunistic behaviour of other bats, after the recorded bat came back from reward locations. Right: 2D-distribution of takeoff locations preceding locations where cells were socially modulated (or modulated by a specific target bat) vs. reward locations in the same sessions. Note the little overlap between the two. d, Left: Schematic description of the third reward-related alternative explanation: neural responses reflect availability of reward at the next flight, according to the presence (reward available) or absence (reward potentially blocked) of a specific bat at the landing spot. Middle: Probability of the next flight to reward, depending on presence or absence of the target bat at the landing spot (for cells modulated by a specific target bat, n = 89 cells x location x target bat; 58 cells from three bats, p = 1.5 x10⁻⁴, Wilcoxon signed rank test). Error bars represent SEM. Right: Median interval between landing and the takeoff of next flight to reward for the same cells, depending on the presence or absence of the target bat at the landing spot (n = 15 intervals from 11 cells, three bats, p = 0.73, Wilcoxon rank sum test). e, Left: Schematic description of the fourth reward-related alternative explanation: neural responses reflect an opportunity to scrounge some reward from the target bat. Right: Median interval between the time of the neural response and the last reward of the target bat. Note that most rewards are collected minutes before the neural response. Number of socially modulated cells or cells modulated by a specific target bat are reported in the main text. NS: p > 0.05, ***: p < 0.001.
Extended Data Fig. 12
Extended Data Fig. 12. Increase of echolocation emitted by the flying bats around flight time during group foraging.
a, Top: average waveform for all echolocation clicks detected in one representative session (n = 7294 clicks from a session involving six bats). Bottom: distribution of inter-click-intervals detected over all sessions involving sound recordings. Each bar represents the mean fraction of inter-click-intervals at the corresponding time bin, averaged across sessions (n = 33 sessions involving 5-7 bats, 3115-18452 clicks per session). Error bars represent s.d. Note the bimodal nature of the distribution, as expected from the temporal features of echolocation from single bats, where clicks are typically emitted in pairs (intra-pair interval ~ 20 ms) separated by ~100 ms (inter-pair interval). b, Velocity profiles (blue) and detected clicks (black) around takeoff from two example flights (same session as reported in ‘a’). c, Raster plots aligned to takeoff (left) and landing (right) showing detected echolocation clicks around flight times (same session as in ‘a’, 389 flights from six bats). The average echolocation rate is shown below the raster. Shaded areas indicate SEM. Note the sharp rise in echolocation rate at takeoff. d, Left: Schematic of the examined flights, where one single bat is flying towards the side of the room where the recording microphone (MIC) is located. Centre: Amplitude of all detected echolocation pulses for the examined flights (n = 25671 echolocation pulses from 1397 flights), normalized to the first one in the flight, as a function of the distance of the flying bat from the wall where the microphone is located. Distance classes (far, intermediate, and close, obtained by partitioning the distance range into three equal intervals) are indicated on top. Right: Box plots (lines indicate max and min values, rectangle indicates 25th-75th percentiles and dots indicate median) for the normalized click amplitude at the distances indicated in the middle panel (n = 5731, 8638 and 11300 echolocation pulses at far, intermediate and close, respectively; Kruskal-Wallis test with Tukey multiple comparison test, *** represents significance levels of multiple comparisons: p = 0 for all pairs). e, Histogram of the inter-click intervals for flights where one, three or five bats (maximum) were flying at the same time. Jamming indicates an increase in the clicks separated by less than 100 ms and more than 20 ms. f, Relationship between echolocation and the wing-beat cycle. Left: examples from four different bats showing the accelerometer signal during flight and the timing of detected echolocation pulses (vertical lines). Note that click pairs tend to occur around the downstroke. Right: Distribution of click phase relative to the wing-beat cycle for all detected clicks (86,099) when one bat is flying.
Extended Data Fig. 13
Extended Data Fig. 13. Additional analyses related to hippocampal responses in stationary bats around others’ takeoff.
a, b, Activity from an example neuron (same on both panels) during stationary epochs of the recorded bat and aligned to takeoff of other bats. Trials in a are sorted based on the overall mobility of the recorded bat (Methods). Trials in b are sorted by the distance of the recorded bat from the bat that was taking off. For both panels: schematic representation (left), raster plot of all spikes and average firing frequency (centre) across conditions (red vs. black: low mobility vs. high mobility; yellow vs. black: close vs. far takeoff events). Shaded areas represent SEM. Plot on the right of panel a: accelerometer signal (absolute deviation from g) recorded from the stationary bat around takeoff of the other bats. Plot on the right of panel b: takeoff distance of the other bats from the recorded bat. c, Firing rate relative to baseline for the same cells (n = 106 from three bats) averaged across three different conditions: takeoff events happening close (yellow, < 1 m) to the recorded bat during low mobility epochs, same but for far takeoffs (blue, > 1 m) and for all takeoffs (no mobility or distance constrain) for comparison (black). Activity is aligned to takeoff and shaded areas represent SEM. d, Magnitude of the social modulation (Methods) around others’ flights for the same cells during low mobility-close takeoffs and low mobility-far takeoffs (p = 0.006, Wilcoxon sign rank test, 106 cells from three bats). e, Left: Average firing rate in stationary bats (z-scored) for the same cells (n = 75 cells from three bats) around takeoff of other bats on trials with detected echolocation (green) or without detected echolocation (brown). Shaded areas indicate SEM. Right: Delays between responses with or without echolocation for the subset of units (n = 39) fulfilling criteria for accurate delay estimation (Methods). f, Average firing rate (normalized to baseline) around echolocation pulses emitted when no bats are flying (n = 84 cells from three bats, modulated around takeoff of other bats) vs. shuffled rate (dotted line), calculated by randomly sampling from the same epochs. Shaded areas indicate SEM.
Extended Data Fig. 14
Extended Data Fig. 14. Additional data related to wireless imaging during collective foraging.
a, Representative FOVs from three imaged bats (intensity correlation images). Bright square borders result from motion correction; bright circular borders correspond to the edges of the GRIN lens. b, Top: Number of extracted ROIs for the imaged FOVs across three bats (different colours). Centre and Bottom: distribution of the cell diameters (2 µm per pixel) and the peak-to-noise ratios for the extracted ROIs (n = 2109 ROIs from 24 FOVs across three bats). c, Decoding accuracy for social-nonsocial landing (grey area) or landing position (among the two most common) from the activity of spatially modulated cells. Note that in both cases, the chance level is 0.5 (n=25 landings from 24 FOVs across three bats, p = 0.1 for social, p = 7x10⁻⁶ for position, one-sided Wilcoxon signed rank test). d, Distribution of the pairwise cell distances for socially modulated cells (magenta) and a matched number of randomly sampled neurons (1000 samples per FOV, black). The two distributions are not significantly different (two-sample Kolmogorov-Smirnov test, p = 0.156, n = 24 FOVs from three bats). Box plots in b and c report max and min values (vertical lines), median (horizontal line) and 25th-75th percentiles (rectangle).

Similar articles

Cited by

References

    1. Couzin ID. Collective cognition in animal groups. Trends Cogn. Sci. 2009;13:36–43. - PubMed
    1. Egert-Berg K, et al. Resource ephemerality drives social foraging in bats. Curr. Biol. 2018;28:3667–3673. - PubMed
    1. Bachorec E, et al. Spatial networks differ when food supply changes: foraging strategy of Egyptian fruit bats. PLoS ONE. 2020;15:e0229110. - PMC - PubMed
    1. Testard C, et al. Rhesus macaques build new social connections after a natural disaster. Curr. Biol. 2021;31:2299–2309. - PMC - PubMed
    1. Dibnah AJ, et al. Vocally mediated consensus decisions govern mass departures from jackdaw roosts. Curr. Biol. 2022;32:R455–R456. - PubMed