

Tabby2: a user-friendly web tool for forecasting state-level TB outcomes in the United States
- PMID: 37649031
- PMCID: PMC10469407
- DOI: 10.1186/s12916-023-02785-y
Tabby2: a user-friendly web tool for forecasting state-level TB outcomes in the United States
Abstract
Background: In the United States, the tuberculosis (TB) disease burden and associated factors vary substantially across states. While public health agencies must choose how to deploy resources to combat TB and latent tuberculosis infection (LTBI), state-level modeling analyses to inform policy decisions have not been widely available.
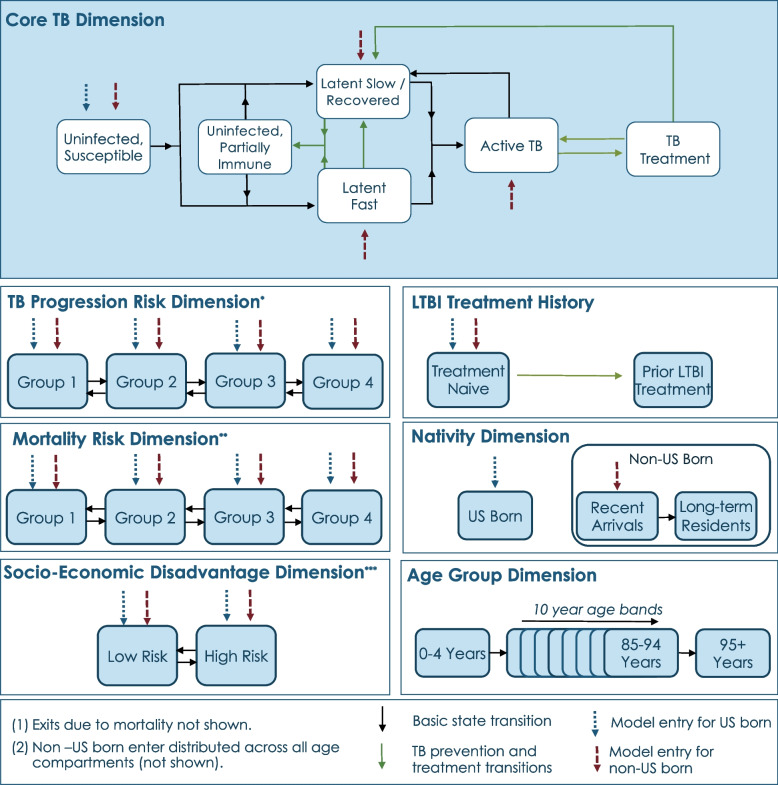
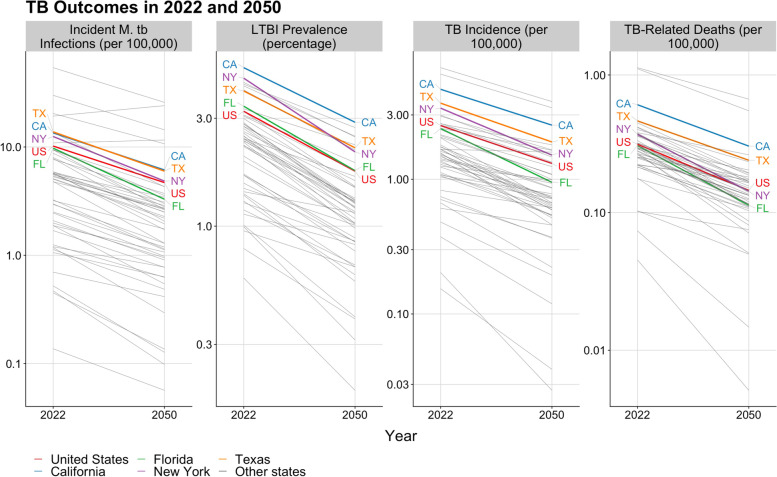
Methods: We developed a mathematical model of TB epidemiology linked to a web-based user interface - Tabby2. The model is calibrated to epidemiological and demographic data for the United States, each U.S. state, and the District of Columbia. Users can simulate pre-defined scenarios describing approaches to TB prevention and treatment or create their own intervention scenarios. Location-specific results for epidemiological outcomes, service utilization, costs, and cost-effectiveness are reported as downloadable tables and customizable visualizations. To demonstrate the tool's functionality, we projected trends in TB outcomes without additional intervention for all 50 states and the District of Columbia. We further undertook a case study of expanded treatment of LTBI among non-U.S.-born individuals in Massachusetts, covering 10% of the target population annually over 2025-2029.
Results: Between 2022 and 2050, TB incidence rates were projected to decline in all states and the District of Columbia. Incidence projections for the year 2050 ranged from 0.03 to 3.8 cases (median 0.95) per 100,000 persons. By 2050, we project that majority (> 50%) of TB will be diagnosed among non-U.S.-born persons in 46 states and the District of Columbia; per state percentages range from 17.4% to 96.7% (median 83.0%). In Massachusetts, expanded testing and treatment for LTBI in this population was projected to reduce cumulative TB cases between 2025 and 2050 by 6.3% and TB-related deaths by 8.4%, relative to base case projections. This intervention had an incremental cost-effectiveness ratio of $180,951 (2020 USD) per quality-adjusted life year gained from the societal perspective.
Conclusions: Tabby2 allows users to estimate the costs, impact, and cost-effectiveness of different TB prevention approaches for multiple geographic areas in the United States. Expanded testing and treatment for LTBI could accelerate declines in TB incidence in the United States, as demonstrated in the Massachusetts case study.
Keywords: Epidemiology; Infectious disease; Mathematical modeling; Tuberculosis; Web application.
© 2023. BioMed Central Ltd., part of Springer Nature.
Conflict of interest statement
The authors declare that they have no competing interests.
Figures


References
-
- US Department of Health and Human Services, Centers for Disease Control and Prevention (CDC). Reported Tuberculosis in the United States, 2018, 2019, 2020. https://www.cdc.gov/tb/statistics/reports/2018/default.htm; https://www.cdc.gov/tb/statistics/reports/2019/default.htm;https://www.cdc.gov/tb/statistics/reports/2020/default.htm. Accessed 14 Apr 2022.
-
- Bibbins-Domingo K, Grossman DC, Curry SJ, Bauman L, Davidson KW, Epling JW, García FA, Herzstein J, Kemper AR, Krist AH, Kurth AE. Screening for latent tuberculosis infection in adults: US Preventive Services Task Force recommendation statement. JAMA. 2016;316(9):962–969. doi: 10.1001/jama.2016.11046. - DOI - PubMed
Publication types
MeSH terms
Grants and funding
LinkOut - more resources
Full Text Sources
Medical
