

Whole-genome sequencing reveals adaptations of hairy-footed jerboas (Dipus, Dipodidae) to diverse desert environments
- PMID: 37649052
- PMCID: PMC10469962
- DOI: 10.1186/s12915-023-01680-5
Whole-genome sequencing reveals adaptations of hairy-footed jerboas (Dipus, Dipodidae) to diverse desert environments
Abstract
Background: Environmental conditions vary among deserts across the world, spanning from hyper-arid to high-elevation deserts. However, prior genomic studies on desert adaptation have focused on desert and non-desert comparisons overlooking the complexity of conditions within deserts. Focusing on the adaptation mechanisms to diverse desert environments will advance our understanding of how species adapt to extreme desert environments. The hairy-footed jerboas are well adapted to diverse desert environments, inhabiting high-altitude arid regions, hyper-arid deserts, and semi-deserts, but the genetic basis of their adaptation to different deserts remains unknown.
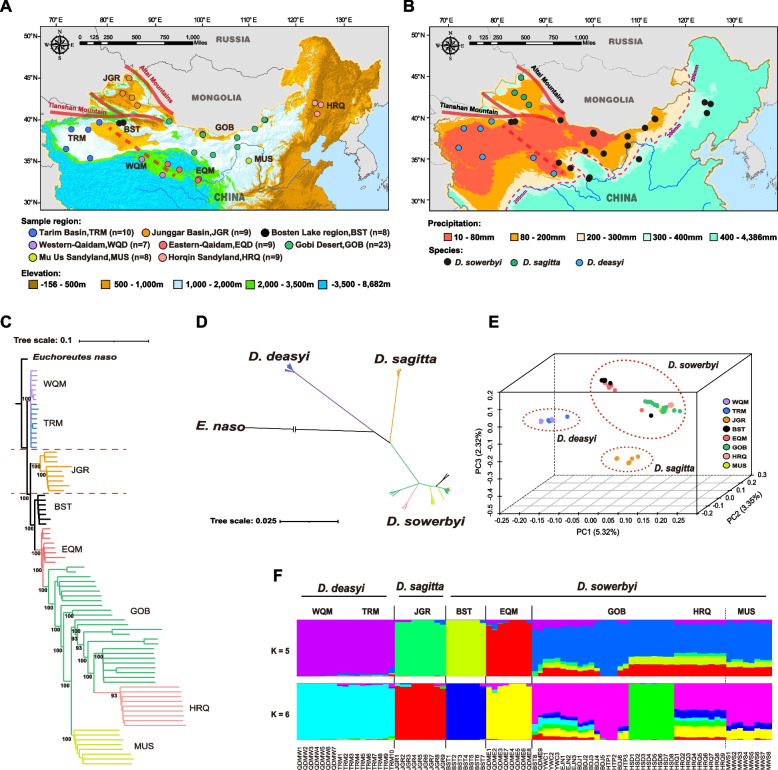
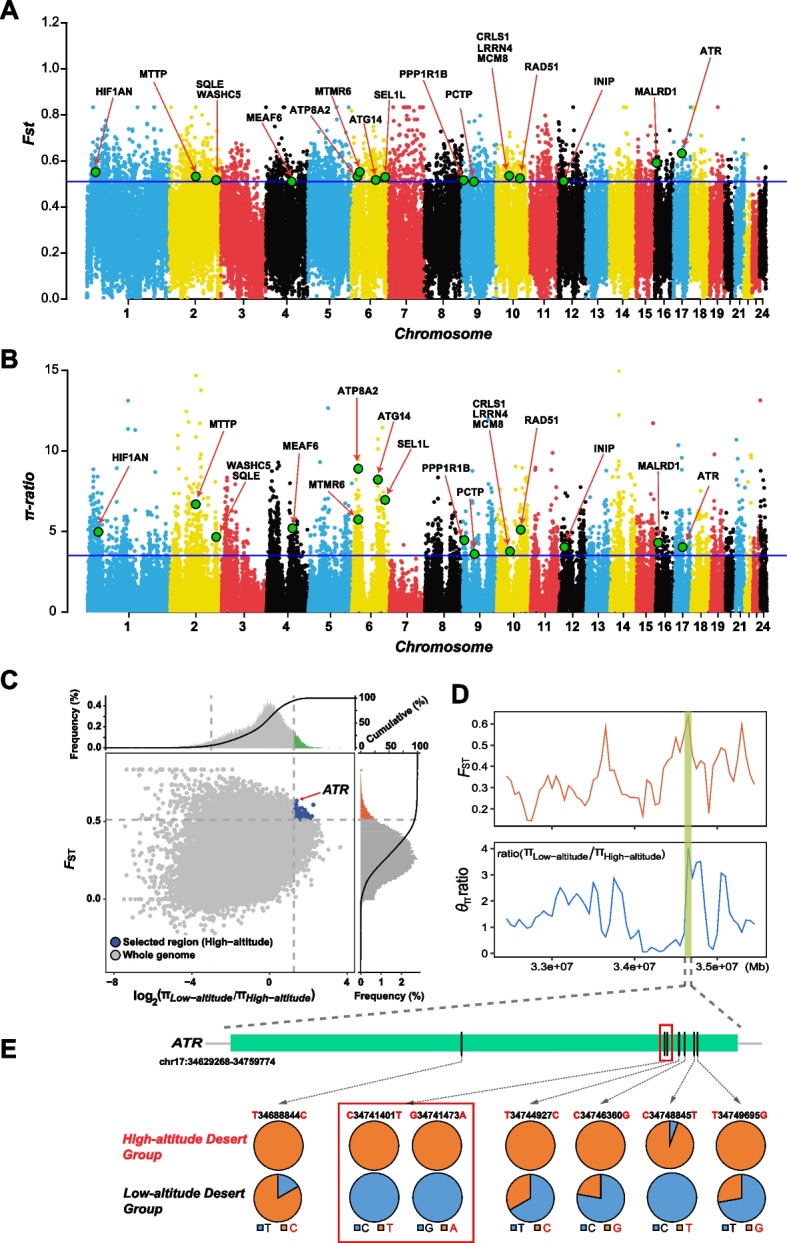
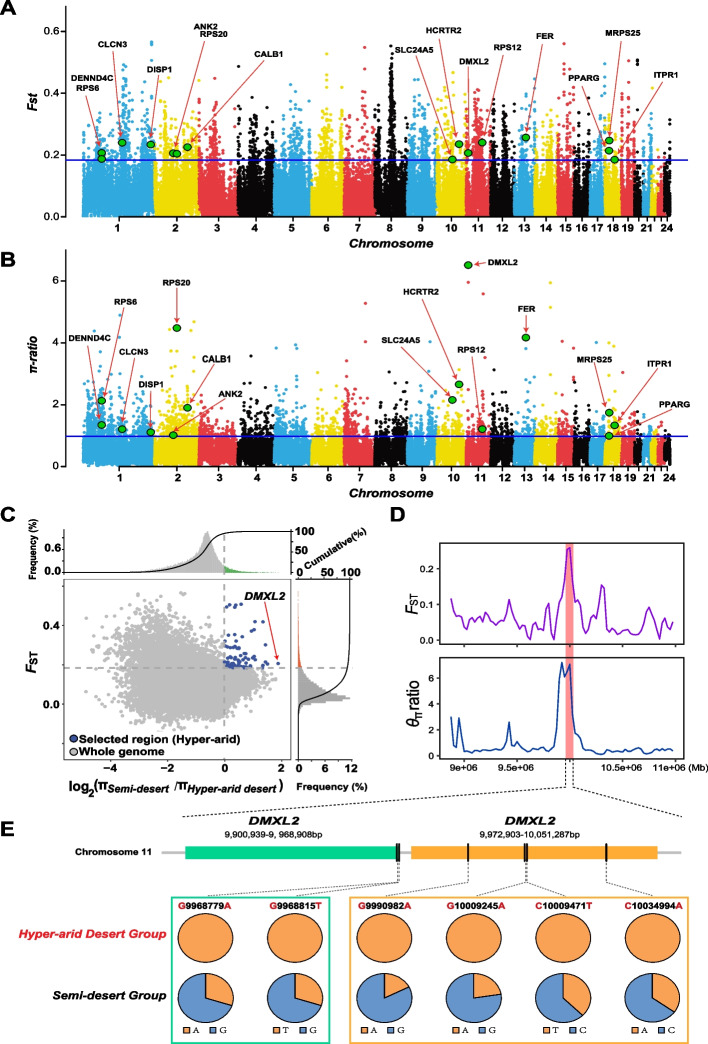
Results: Here, we sequenced the whole genome of 83 hairy-footed jerboas from distinct desert zones in China to assess how they responded under contrasting conditions. Population genomics analyses reveal the existence of three species in hairy-footed jerboas distributed in China: Dipus deasyi, Dipus sagitta, and Dipus sowerbyi. Analyses of selection between high-altitude desert (elevation ≥ 3000m) and low-altitude desert (< 500m) populations identified two strongly selected genes, ATR and HIF1AN, associated with intense UV radiation and hypoxia in high-altitude environments. A number of candidate genes involved in energy and water homeostasis were detected in the comparative genomic analyses of hyper-arid desert (average annual precipitation < 70mm) and arid desert (< 200mm) populations versus semi-desert (> 360mm) populations. Hyper-arid desert animals also exhibited stronger adaptive selection in energy homeostasis, suggesting water and resource scarcity may be the main drivers of desert adaptation in hairy-footed jerboas.
Conclusions: Our study challenges the view of deserts as homogeneous environments and shows that distinct genomic adaptations can be found among desert animals depending on their habitats.
Keywords: Dipus; Energy homeostasis; High-altitude adaptation; Hyper-arid adaptation; Population genomics; Water balance.
© 2023. BioMed Central Ltd., part of Springer Nature.
Conflict of interest statement
The authors declare that they have no competing interests.
Figures
Similar articles
-
Whole-Genome Sequencing of Native Sheep Provides Insights into Rapid Adaptations to Extreme Environments.Mol Biol Evol. 2016 Oct;33(10):2576-92. doi: 10.1093/molbev/msw129. Epub 2016 Jul 8. Mol Biol Evol. 2016. PMID: 27401233 Free PMC article.
-
Life in Deserts: The Genetic Basis of Mammalian Desert Adaptation.Trends Ecol Evol. 2021 Jul;36(7):637-650. doi: 10.1016/j.tree.2021.03.007. Epub 2021 Apr 13. Trends Ecol Evol. 2021. PMID: 33863602 Free PMC article. Review.
-
Genomic Insights into Tibetan Sheep Adaptation to Different Altitude Environments.Int J Mol Sci. 2024 Nov 19;25(22):12394. doi: 10.3390/ijms252212394. Int J Mol Sci. 2024. PMID: 39596459 Free PMC article.
-
Whole-genome sequencing of Tarim red deer (Cervus elaphus yarkandensis) reveals demographic history and adaptations to an arid-desert environment.Front Zool. 2020 Oct 16;17:31. doi: 10.1186/s12983-020-00379-5. eCollection 2020. Front Zool. 2020. PMID: 33072165 Free PMC article.
-
Desert Microbes for Boosting Sustainable Agriculture in Extreme Environments.Front Microbiol. 2020 Jul 22;11:1666. doi: 10.3389/fmicb.2020.01666. eCollection 2020. Front Microbiol. 2020. PMID: 32793155 Free PMC article. Review.
Cited by
-
The multi-tissue gene expression and physiological responses of water deprived Peromyscus eremicus.BMC Genomics. 2024 Aug 8;25(1):770. doi: 10.1186/s12864-024-10629-z. BMC Genomics. 2024. PMID: 39118009 Free PMC article.
-
Four new genome sequences of the Pallas's cat (Otocolobus manul): an insight into the patterns of within-species variability.Front Genet. 2024 Dec 9;15:1463774. doi: 10.3389/fgene.2024.1463774. eCollection 2024. Front Genet. 2024. PMID: 39720181 Free PMC article.
-
When the tap runs dry: The multi-tissue gene expression and physiological responses of water deprived Peromyscus eremicus.bioRxiv [Preprint]. 2024 Jan 25:2024.01.22.576658. doi: 10.1101/2024.01.22.576658. bioRxiv. 2024. Update in: BMC Genomics. 2024 Aug 8;25(1):770. doi: 10.1186/s12864-024-10629-z. PMID: 38328088 Free PMC article. Updated. Preprint.
References
-
- Ward D. The biology of deserts. New York: Oxford University Press; 2016.
-
- Willmer P, Stone G, Johnston I. Environmental physiology of animals. Oxford: Wiley; 2004.
Publication types
MeSH terms
LinkOut - more resources
Full Text Sources
Miscellaneous
