. 2023 Nov 1;11(11):1524-1537.
doi: 10.1158/2326-6066.CIR-23-0151.

Sequential Exposure to IL21 and IL15 During Human Natural Killer Cell Expansion Optimizes Yield and Function

Affiliations

Sequential Exposure to IL21 and IL15 During Human Natural Killer Cell Expansion Optimizes Yield and Function

Caimei Zhang et al. Cancer Immunol Res. .

Abstract

Natural killer (NK) cells are frequently expanded for the clinic using irradiated, engineered K562 feeder cells expressing a core transgene set of membrane-bound (mb) IL15 and/or mbIL21 together with 41BBL. Prior comparisons of mbIL15 to mbIL21 for NK expansion lack comparisons of key attributes of the resulting NK cells, including their high-dimensional phenotype, polyfunctionality, the breadth and potency of cytotoxicity, cellular metabolism, and activity in xenograft tumor models. Moreover, despite multiple rounds of K562 stimulation, studies of sequential use of mbIL15- and mbIL21-based feeder cells are absent. We addressed these gaps and found that using mbIL15- versus mbIL21-based feeder cells drove distinct phenotypic and functional profiles. Feeder cells expressing mbIL15 alone drove superior functionality by nearly all measures, whereas those expressing mbIL21 alone drove superior yield. In combination, most attributes resembled those imparted by mbIL21, whereas in sequence, NK yield approximated that imparted by the first cytokine, and the phenotype, transcriptome, and function resembled that driven by the second cytokine, highlighting the plasticity of NK cell differentiation. The sequence mbIL21 followed by mbIL15 was advantageous in achieving significant yields of highly functional NK cells that demonstrated equivalent in vivo activity to those expanded by mbIL15 alone in two of three xenograft models. Our findings define the impact of mbIL15 versus mbIL21 during NK expansion and reveal a previously underappreciated tradeoff between NK yield and function for which sequential use of mbIL21-based followed by mbIL15-based feeder cells may be the optimal approach in many settings.


Figures

Figure 1. Exposure to K562 expressing mbIL21 gives superior NK yield. A, Surface expression of CD64, 41BBL, CD40, IL15, and IL21 on the K562 feeders (K)-IL15, K-IL21, and K-IL15-IL21. B, Workflow of our NK cell expansion process. On day 10, NK cells were repeatedly stimulated with either the same type of feeders or switched from K-IL15 to K-IL21 and vice versa. C, Dynamic population doubling and cell volume of NK cells after K562 feeder exposure. D, Viability of NK cells on day 10 and day 20 of the expansion was determined by staining with Annexin V-PE and 7-AAD (5–6 donors). E, Expansion fold of NK cells on day 10 and day 20 from 11 donors, except for K-WT from 5 donors. The results are expressed as mean ± SE; *, P < 0.05 and **, P < 0.01 by fitting mixed model with multiple paired t test.
Figure 1.
Exposure to K562 expressing mbIL21 gives superior NK yield. A, Surface expression of CD64, 41BBL, CD40, IL15, and IL21 on the K562 feeders (K)-IL15, K-IL21, and K-IL15-IL21. B, Workflow of our NK cell expansion process. On day 10, NK cells were repeatedly stimulated with either the same type of feeders or switched from K-IL15 to K-IL21 and vice versa. C, Dynamic population doubling and cell volume of NK cells after K562 feeder exposure. D, Viability of NK cells on day 10 and day 20 of the expansion was determined by staining with Annexin V-PE and 7-AAD (5–6 donors). E, Expansion fold of NK cells on day 10 and day 20 from 11 donors, except for K-WT from 5 donors. The results are expressed as mean ± SE; *, P < 0.05 and **, P < 0.01 by fitting mixed model with multiple paired t test.
Figure 2. The distinct phenotype of NK cells from different stimulation conditions. A, Representative flow plots of CD56 and CD16 expression on freshly isolated NK cells and expanded NK cells. B, The percentages of different NK cell subsets based on the expression of CD56 and CD16 in freshly isolated NK cells and expanded NK cells (N = 4 donors). C, The percentage and MFI of CD16 (N = 6–11 donors). **, P < 0.01 by one-way ANOVA with paired t tests. D–F, 28-color flow cytometry analysis (from 1 of 2 donors, the other donor showed similar results) showing the subpopulations of expanded NK cells. UMAP (top) and the quantification of clusters (bottom; D), individual clusters (E), and the heat map of protein surface expression in the individual cluster (F). Pooled: the combination of cells from five groups. The percentage of activating receptors (NKp44, NKp30, and NKG2D), cell death ligands (CD178 and CD253; G; N = 10 donors), and inhibitory receptors (PD1, LAG3, TIGIT, TIM3, CD96, Siglec-7, and CD200R; H; N = 7 donors) in freshly isolated NK cells and expanded NK cells. The results are expressed as mean ± SE; *, P < 0.05 and **, P < 0.01 by a two-way ANOVA with multiple paired t test.
Figure 2.
The distinct phenotype of NK cells from different stimulation conditions. A, Representative flow plots of CD56 and CD16 expression on freshly isolated NK cells and expanded NK cells. B, The percentages of different NK cell subsets based on the expression of CD56 and CD16 in freshly isolated NK cells and expanded NK cells (N = 4 donors). C, The percentage and MFI of CD16 (N = 6–11 donors). **, P < 0.01 by one-way ANOVA with paired t tests. D–F, 28-color flow cytometry analysis (from 1 of 2 donors, the other donor showed similar results) showing the subpopulations of expanded NK cells. UMAP (top) and the quantification of clusters (bottom; D), individual clusters (E), and the heat map of protein surface expression in the individual cluster (F). Pooled: the combination of cells from five groups. The percentage of activating receptors (NKp44, NKp30, and NKG2D), cell death ligands (CD178 and CD253; G; N = 10 donors), and inhibitory receptors (PD1, LAG3, TIGIT, TIM3, CD96, Siglec-7, and CD200R; H; N = 7 donors) in freshly isolated NK cells and expanded NK cells. The results are expressed as mean ± SE; *, P < 0.05 and **, P < 0.01 by a two-way ANOVA with multiple paired t test.
Figure 3. Constant K-IL15 exposure or sequential K-IL21 and then K-IL15 drives greater NK cytotoxicity. Cytotoxicity of NK cells against K562 cells (9–10 donors; A), U251 cells (7 donors), RPMI-8226 cells (5 donors), SKOV3 cells (3 donors), ASPC1(3 donors), MM.1S cells (3 donors), and Raji cells (3 donors; B) was assessed by luciferase activity during coculture with tumor cells at different E:T ratio for 24 hours. The results are expressed as mean ± SE; *, P < 0.05 and **, P < 0.01 by fitting mixed model with multiple paired t test. C, ADCC of NK cells was assessed by luciferase activity during coculture with U251 or SKOV3 cells in the presence of or absence of trastuzumab 2 μg/mL for 24 hours (5 donors). D, The secretion of cytokine GMCSF and TNFa by expanded NK cells during coculture with K562 cells for 24 hours (3 donors). *, P < 0.05 by two-way ANOVA with multiple paired t test. E, PSI of expanded NK cells. The Isoplexis single-cell 32-plex Secretome Assay was performed to expanded NK cells after restimulation with TLR7/8 agonist (R848) 1 μg/mL overnight.
Figure 3.
Constant K-IL15 exposure or sequential K-IL21 and then K-IL15 drives greater NK cytotoxicity. Cytotoxicity of NK cells against K562 cells (9–10 donors; A), U251 cells (7 donors), RPMI-8226 cells (5 donors), SKOV3 cells (3 donors), ASPC1(3 donors), MM.1S cells (3 donors), and Raji cells (3 donors; B) was assessed by luciferase activity during coculture with tumor cells at different E:T ratio for 24 hours. The results are expressed as mean ± SE; *, P < 0.05 and **, P < 0.01 by fitting mixed model with multiple paired t test. C, ADCC of NK cells was assessed by luciferase activity during coculture with U251 or SKOV3 cells in the presence of or absence of trastuzumab 2 μg/mL for 24 hours (5 donors). D, The secretion of cytokine GMCSF and TNFa by expanded NK cells during coculture with K562 cells for 24 hours (3 donors). *, P < 0.05 by two-way ANOVA with multiple paired t test. E, PSI of expanded NK cells. The Isoplexis single-cell 32-plex Secretome Assay was performed to expanded NK cells after restimulation with TLR7/8 agonist (R848) 1 μg/mL overnight.
Figure 4. Metabolic profiles of NK cells expanded under different conditions. Representative (left) and summarized (right) OCR (A) and ECAR (B) of expanded NK cells simultaneously measured in Seahorse Cell Stress Test. Basal OCR is the measurement before adding Oligo, and SRC is the difference of OCR between maximal measurement (after adding FCCP) and the basal measurement. Basal ECAR is the measurement before adding oligo and glycolytic capacity was the measurement of ECAR after adding Oligo. C, OCR versus ECAR under resting and stress conditions. D, ATP production rate by mitochondrial respiration and glycolysis. All the summarized data of Seahorse assays are from 3 donors. E, The mitochondrial membrane potential of NK cells was detected by MitoProbe TMRM Assay (N = 4 donors). F, Glucose uptake of NK cells was measured by 2-NBDG fluorescent tracer (N = 4 donors). G, The normalized cytotoxicity of NK cells pretreated with glycolysis inhibitor, 2-DG. The cytotoxicity of expanded NK cells against K562 was assessed by luciferase assay after pretreating NK cells with 2-DG 20 mmol/L overnight (N = 5 donors). The surface expression of CD98 (H) and CD71 (I) on NK cells was detected by flow cytometry (N = 8). The results are expressed as mean ± SE. *, P < 0.05 and **, P < 0.01 by two-way ANOVA with multiple paired t tests or one-way ANOVA with paired t tests.
Figure 4.
Metabolic profiles of NK cells expanded under different conditions. Representative (left) and summarized (right) OCR (A) and ECAR (B) of expanded NK cells simultaneously measured in Seahorse Cell Stress Test. Basal OCR is the measurement before adding Oligo, and SRC is the difference of OCR between maximal measurement (after adding FCCP) and the basal measurement. Basal ECAR is the measurement before adding oligo and glycolytic capacity was the measurement of ECAR after adding Oligo. C, OCR versus ECAR under resting and stress conditions. D, ATP production rate by mitochondrial respiration and glycolysis. All the summarized data of Seahorse assays are from 3 donors. E, The mitochondrial membrane potential of NK cells was detected by MitoProbe TMRM Assay (N = 4 donors). F, Glucose uptake of NK cells was measured by 2-NBDG fluorescent tracer (N = 4 donors). G, The normalized cytotoxicity of NK cells pretreated with glycolysis inhibitor, 2-DG. The cytotoxicity of expanded NK cells against K562 was assessed by luciferase assay after pretreating NK cells with 2-DG 20 mmol/L overnight (N = 5 donors). The surface expression of CD98 (H) and CD71 (I) on NK cells was detected by flow cytometry (N = 8). The results are expressed as mean ± SE. *, P < 0.05 and **, P < 0.01 by two-way ANOVA with multiple paired t tests or one-way ANOVA with paired t tests.
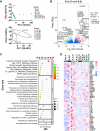
Figure 5. Transcriptional profiles of NK cells expanded under different conditions. A, PCA of the expression profiles from the bulk RNA-seq of 4 donors’ samples for seven groups (top) and K-IL15 and K-IL21 groups (bottom). B, Volcano plot for the differentially expressed genes (Padj > 0.05; log2 fold change >2) in samples from all four donors in the K-IL15 versus K-IL21 group. C, Bubble plot of the selected gene sets enriched in K-IL15–expanded NK cells versus K-IL21–expanded NK cells. NES, normalized enrichment score. D, Heat map of normalized expression of both upregulated and downregulated genes differentially expressed from bulk RNA-seq. Each column represents one donor.
Figure 5.
Transcriptional profiles of NK cells expanded under different conditions. A, PCA of the expression profiles from the bulk RNA-seq of 4 donors’ samples for seven groups (top) and K-IL15 and K-IL21 groups (bottom). B, Volcano plot for the differentially expressed genes (Padj > 0.05; log2 fold change >2) in samples from all four donors in the K-IL15 versus K-IL21 group. C, Bubble plot of the selected gene sets enriched in K-IL15–expanded NK cells versus K-IL21–expanded NK cells. NES, normalized enrichment score. D, Heat map of normalized expression of both upregulated and downregulated genes differentially expressed from bulk RNA-seq. Each column represents one donor.
Figure 6. In vivo antitumor efficacy of NK cells expanded from different conditions in various mouse tumor models. Schematic diagram of the timeline (A), tumor bioluminescence images (B), quantification (C), mouse survival curves (D), and blood and tissue NK cells (E) of the mouse Burkitt lymphoma model. NSG mice were intravenously (i.v.) injected with Raji-CBG cells (1e5/mouse) followed by intravenous injection with frozen expanded NK cells (15e6 cells/mouse) 2 days later (8 mice/group). Blood and tissue NK cells were measured on day 4 after NK cell injection in another experiment. **, P < 0.01; and ***, P < 0.001 by one-way ANOVA with t test. *, P < 0.05 by survival analysis (Kaplan–Meier). Schematic diagram of the timeline (F), tumor bioluminescence images (G), and the summarized tumor growth (H) of the mouse multiple myeloma model. NSG mice received an intraosseous injection of RPMI8226-CBG (2e6 cells/mouse) following busulfan preconditioning. Expanded NK cells (20e6/mouse) from 3 donors were delivered by intravenous injection weekly for 3 weeks (6 mice/group). Human rIL2 (12,500 IU/mouse) was intraperitoneally delivered to the mice twice per week for both the lymphoma and multiple myeloma models. Schematic diagram of the timeline (I) and tumor flux (J) of the peritoneal carcinomatosis mouse model. NSG mice received intraperitoneal injection with U251-CBG cells (1e6 cells/mouse) and then freshly expanded NK cells (3e6 cells/mouse) were given 5 hours later (10 mice/group, except for 5 mice in the K-IL15-IL21 due to low yield for that expansion). The results are expressed as mean ± SE. **, P < 0.01 versus Medium group; and # P < 0.05 versus K-IL21 group by two-way ANOVA with multiple t tests.
Figure 6.
In vivo antitumor efficacy of NK cells expanded from different conditions in various mouse tumor models. Schematic diagram of the timeline (A), tumor bioluminescence images (B), quantification (C), mouse survival curves (D), and blood and tissue NK cells (E) of the mouse Burkitt lymphoma model. NSG mice were intravenously (i.v.) injected with Raji-CBG cells (1e5/mouse) followed by intravenous injection with frozen expanded NK cells (15e6 cells/mouse) 2 days later (8 mice/group). Blood and tissue NK cells were measured on day 4 after NK cell injection in another experiment. **, P < 0.01; and ***, P < 0.001 by one-way ANOVA with t test. *, P < 0.05 by survival analysis (Kaplan–Meier). Schematic diagram of the timeline (F), tumor bioluminescence images (G), and the summarized tumor growth (H) of the mouse multiple myeloma model. NSG mice received an intraosseous injection of RPMI8226-CBG (2e6 cells/mouse) following busulfan preconditioning. Expanded NK cells (20e6/mouse) from 3 donors were delivered by intravenous injection weekly for 3 weeks (6 mice/group). Human rIL2 (12,500 IU/mouse) was intraperitoneally delivered to the mice twice per week for both the lymphoma and multiple myeloma models. Schematic diagram of the timeline (I) and tumor flux (J) of the peritoneal carcinomatosis mouse model. NSG mice received intraperitoneal injection with U251-CBG cells (1e6 cells/mouse) and then freshly expanded NK cells (3e6 cells/mouse) were given 5 hours later (10 mice/group, except for 5 mice in the K-IL15-IL21 due to low yield for that expansion). The results are expressed as mean ± SE. **, P < 0.01 versus Medium group; and # P < 0.05 versus K-IL21 group by two-way ANOVA with multiple t tests.

Similar articles

Cited by

References

    1. Laskowski TJ, Biederstadt A, Rezvani K. Natural killer cells in antitumour adoptive cell immunotherapy. Nat Rev Cancer 2022;22:557–75. - PMC - PubMed
    1. Yoon SR, Kim TD, Choi I. Understanding of molecular mechanisms in natural killer cell therapy. Exp Mol Med 2015;47:e141. - PMC - PubMed
    1. Böttcher JP, Bonavita E, Chakravarty P, Blees H, Cabeza-Cabrerizo M, Sammicheli S, et al. . NK cells stimulate recruitment of cDC1 into the tumor microenvironment promoting cancer immune control. Cell 2018;172:1022–37. - PMC - PubMed
    1. Kirchhammer N, Trefny MP, Natoli M, Brücher D, Smith SN, Werner F, et al. . NK cells with tissue-resident traits shape response to immunotherapy by inducing adaptive antitumor immunity. Sci Transl Med 2022;14:eabm9043. - PubMed
    1. Robertson MJ, Ritz J. Biology and clinical relevance of human natural killer cells. Blood 1990;76:2421–38. - PubMed

Publication types