

Metabolomics analysis of visceral leishmaniasis based on urine of golden hamsters
- PMID: 37649093
- PMCID: PMC10469881
- DOI: 10.1186/s13071-023-05881-3
Metabolomics analysis of visceral leishmaniasis based on urine of golden hamsters
Abstract
Background: Leishmaniasis is one of the most neglected tropical diseases and is spread mainly in impoverished regions of the world. Although many studies have focused on the host's response to Leishmania invasion, relatively less is known about the complex processes at the metabolic level, especially the metabolic alterations in the infected hosts.
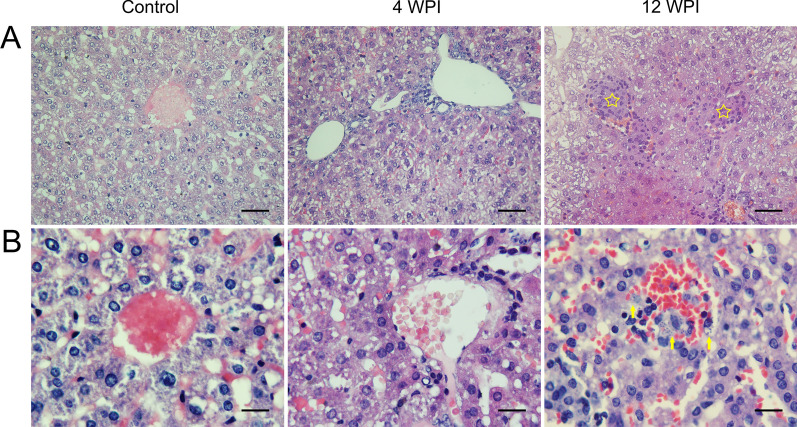
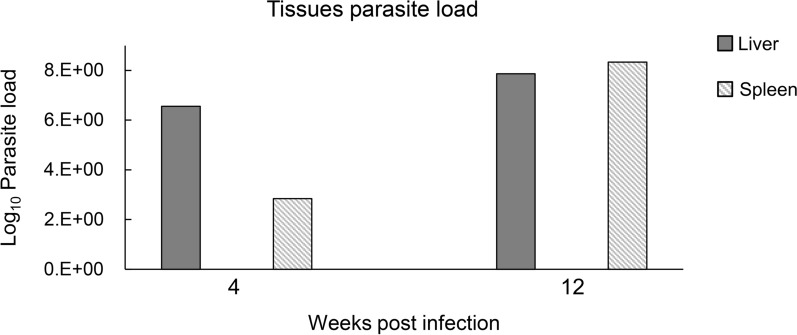
Methods: In this study, we conducted metabolomics analysis on the urine of golden hamsters in the presence or absence of visceral leishmaniasis (VL) using the ultra-performance liquid chromatography (UPLC) system tandem high-resolution mass spectrometer (HRMS). The metabolic characteristics of urine samples, along with the histopathological change and the parasite burden of liver and spleen tissues, were detected at 4 and 12 weeks post infection (WPI), respectively.
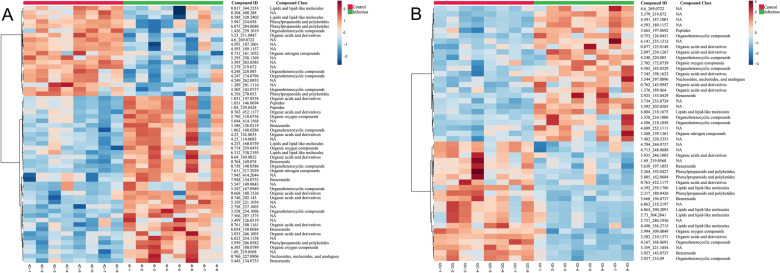
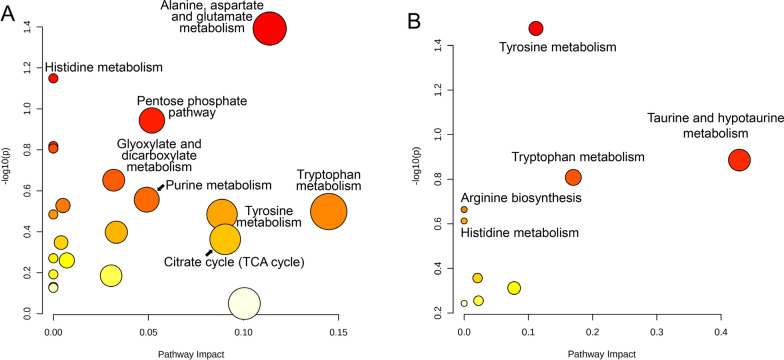
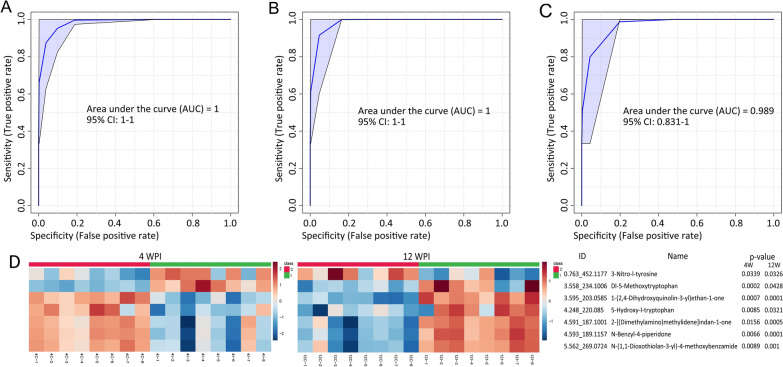
Results: Amino acid metabolism was extensively affected at both stages of VL progression. Meanwhile, there were also distinct metabolic features at different stages. At 4 WPI, the significantly affected metabolic pathways involved alanine, aspartate and glutamate metabolism, the pentose phosphate pathway (PPP), histidine metabolism, tryptophan metabolism and tyrosine metabolism. At 12 WPI, the markedly enriched metabolic pathways were almost concentrated on amino acid metabolism, including tyrosine metabolism, taurine and hypotaurine metabolism and tryptophan metabolism. The dysregulated metabolites and metabolic pathways at 12 WPI were obviously less than those at 4 WPI. In addition, seven metabolites that were dysregulated at both stages through partial least squares-discriminant analysis (PLS-DA) and receiver-operating characteristic (ROC) tests were screened to be of diagnostic potential. The combination of these metabolites as a potential biomarker panel showed satisfactory performance in distinguishing infection groups from control groups as well as among different stages of infection.
Conclusion: Our findings could provide valuable information for further understanding of the host response to Leishmania infection from the aspect of the urine metabolome. The proposed urine biomarker panel could help in the development of a novel approach for the diagnosis and prognosis of VL.
Keywords: Biomarker panel; Leishmania; Metabolomics; Visceral leishmaniasis.
© 2023. BioMed Central Ltd., part of Springer Nature.
Conflict of interest statement
The authors declare that they have no competing interests.
Figures


Similar articles
-
Integration of hepatic lipidomics and transcriptomics reveals dysregulation of lipid metabolism in a golden hamster model of visceral leishmaniasis.Front Immunol. 2025 May 20;16:1595702. doi: 10.3389/fimmu.2025.1595702. eCollection 2025. Front Immunol. 2025. PMID: 40463366 Free PMC article.
-
Metabolic characterization and biomarkers screening for visceral leishmaniasis in golden hamsters.Acta Trop. 2022 Jan;225:106222. doi: 10.1016/j.actatropica.2021.106222. Epub 2021 Oct 30. Acta Trop. 2022. PMID: 34757045
-
Tissue/Biofluid Specific Molecular Cartography of Leishmania donovani Infected BALB/c Mice: Deciphering Systemic Reprogramming.Front Cell Infect Microbiol. 2021 Jul 29;11:694470. doi: 10.3389/fcimb.2021.694470. eCollection 2021. Front Cell Infect Microbiol. 2021. PMID: 34395309 Free PMC article.
-
[Plasma metabolomics in a deep vein thrombosis rat model based on ultra-high performance liquid chromatography-electrostatic field orbitrap high resolution mass spectrometry].Se Pu. 2022 Aug;40(8):736-745. doi: 10.3724/SP.J.1123.2021.12024. Se Pu. 2022. PMID: 35903841 Free PMC article. Chinese.
-
Hamster, a close model for visceral leishmaniasis: Opportunities and challenges.Parasite Immunol. 2020 Oct;42(10):e12768. doi: 10.1111/pim.12768. Epub 2020 Jul 15. Parasite Immunol. 2020. PMID: 32594532 Review.
Cited by
-
Development of shotgun metabolomic profile analysis for detecting canine visceral leishmaniasis using flow-through pinhole paper spray mass spectrometry.Analyst. 2025 Jul 21;150(15):3457-3464. doi: 10.1039/d5an00451a. Analyst. 2025. PMID: 40590608 Free PMC article.
-
Advances and Challenges in the Diagnosis of Leishmaniasis.Mol Diagn Ther. 2025 Mar;29(2):195-212. doi: 10.1007/s40291-024-00762-6. Epub 2025 Jan 22. Mol Diagn Ther. 2025. PMID: 39843806 Review.
-
Untargeted Liquid Chromatography-High-Resolution Mass Spectrometry Metabolomic Investigation Reveals Altered Lipid Content in Leishmania infantum Lacking Lipid Droplet Protein Kinase.Trop Med Infect Dis. 2024 Sep 10;9(9):208. doi: 10.3390/tropicalmed9090208. Trop Med Infect Dis. 2024. PMID: 39330897 Free PMC article.
-
Integration of hepatic lipidomics and transcriptomics reveals dysregulation of lipid metabolism in a golden hamster model of visceral leishmaniasis.Front Immunol. 2025 May 20;16:1595702. doi: 10.3389/fimmu.2025.1595702. eCollection 2025. Front Immunol. 2025. PMID: 40463366 Free PMC article.
-
A nuclear magnetic resonance spectroscopy metabolomic approach to renal dysfunction in canine leishmaniasis.Vet Anim Sci. 2025 Mar 5;28:100440. doi: 10.1016/j.vas.2025.100440. eCollection 2025 Jun. Vet Anim Sci. 2025. PMID: 40230618 Free PMC article.
References
-
- WHO. Global leishmaniasis surveillance, 2017–2018, and first report on 5 additional indicators. WHO Weekly Epidemiological Record, No 25, 2020. Available from: https://www.who.int/publications/i/item/who-wer9525.
-
- Burza S, Croft SL, Boelaert M. Leishmaniasis. Lancet. 2018;392:951–970. - PubMed
-
- Zhou Z, Li Y, Zhang Y, Li S. Prevalence of visceral leishmaniasis in China during 2015–2018. Chin J Parasitol Parasit Dis. 2020;38:339–345.
-
- Yuan D, Qin H, Zhang J, Liao L, Chen Q, Chen D, et al. Phylogenetic analysis of HSP70 and cyt b gene sequences for Chinese isolates and ultrastructural characteristics of Chinese Leishmania sp. Parasitol Res. 2017;116:693–702. - PubMed
MeSH terms
Substances
Grants and funding
LinkOut - more resources
Full Text Sources
