. 2023 Sep;13(9):e1375.
doi: 10.1002/ctm2.1375.

Impaired resolution of blood transcriptomes through tuberculosis treatment with diabetes comorbidity

Affiliations

Impaired resolution of blood transcriptomes through tuberculosis treatment with diabetes comorbidity

Clare Eckold et al. Clin Transl Med. 2023 Sep.

Abstract

Background: People with diabetes are more likely to develop tuberculosis (TB) and to have poor TB-treatment outcomes than those without. We previously showed that blood transcriptomes in people with TB-diabetes (TB-DM) co-morbidity have excessive inflammatory and reduced interferon responses at diagnosis. It is unknown whether this persists through treatment and contributes to the adverse outcomes.

Methods: Pulmonary TB patients recruited in South Africa, Indonesia and Romania were classified as having TB-DM, TB with prediabetes, TB-related hyperglycaemia or TB-only, based on glycated haemoglobin concentration at TB diagnosis and after 6 months of TB treatment. Gene expression in blood at diagnosis and intervals throughout treatment was measured by unbiased RNA-Seq and targeted Multiplex Ligation-dependent Probe Amplification. Transcriptomic data were analysed by longitudinal mixed-model regression to identify whether genes were differentially expressed between clinical groups through time. Predictive models of TB-treatment response across groups were developed and cross-tested.

Results: Gene expression differed between TB and TB-DM patients at diagnosis and was modulated by TB treatment in all clinical groups but to different extents, such that differences remained in TB-DM relative to TB-only throughout. Expression of some genes increased through TB treatment, whereas others decreased: some were persistently more highly expressed in TB-DM and others in TB-only patients. Genes involved in innate immune responses, anti-microbial immunity and inflammation were significantly upregulated in people with TB-DM throughout treatment. The overall pattern of change was similar across clinical groups irrespective of diabetes status, permitting models predictive of TB treatment to be developed.

Conclusions: Exacerbated transcriptome changes in TB-DM take longer to resolve during TB treatment, meaning they remain different from those in uncomplicated TB after treatment completion. This may indicate a prolonged inflammatory response in TB-DM, requiring prolonged treatment or host-directed therapy for complete cure. Development of transcriptome-based biomarker signatures of TB-treatment response should include people with diabetes for use across populations.

Keywords: diabetes; transcriptome; treatment; tuberculosis.


Conflict of interest statement

G. W. holds patents about methods of tuberculosis diagnosis and tuberculosis biomarkers which are unrelated to the current study. No other authors have any declared conflicts of interest.

Figures
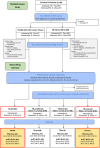
FIGURE 1
FIGURE 1
Recruitment of participants with TB into the TANDEM study, and selection of participants for inclusion in the gene expression analyses. The TANDEM study was a multi‐centre, multidisciplinary project investigating various factors in TB and diabetes co‐morbidity. This bioprofiling study was nested within the TANDEM Master study, in which 2185 TB patients were recruited to undergo screening for diabetes. They were initially classified into those with diabetes or without diabetes and were recruited into the bioprofiling sub‐study if they met the inclusion and exclusion criteria. Study participants were followed up at time points shown, with blood samples taken for gene expression analyses. The primary aim was to compare people with TB and with TB‐DM comorbidity through TB treatment. Secondarily, we analysed gene expression in TB patients with stable (TB‐preDM) or transient (TBrel‐IH) elevated glycaemia, as we discovered that this also impacted gene expression.
FIGURE 2
FIGURE 2
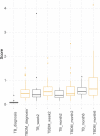
Molecular degree of perturbation plots representing change in global gene expression in blood relative to patients with TB‐only at TB diagnosis. Gene expression was determined by RNA‐Seq of whole venous blood from pulmonary TB patients from all three clinical locations with (TB‐DM: n = 34) or without (TB‐only: n = 18) concomitant diabetes, at TB diagnosis and during TB treatment. The bars show the median and 1.5*inter‐quartile range.
FIGURE 3
FIGURE 3
MaSigPro analysis of change in gene expression through TB treatment in blood samples from patients in all three populations combined (South Africa, Indonesia and Romania). MaSigPro identified genes that behave similarly between patient groups using hierarchical clustering. Results are shown for log‐transformed normalised count for the TB‐only group or TB‐DM. Bars show mean ± 1 SEM. Data were filtered to remove lowly abundant transcripts prior to analysis.
FIGURE 4
FIGURE 4
Gene expression through treatment in TB patients with pre‐diabetes or TB‐related intermediate hyperglycaemia, relative to TB‐DM and TB‐only patients. The expression of genes in the Core 102 genelist (Table S7) was summed for those genes within each MaSigPro gene cluster (Figure 3) for individual patients (log2 scale). Only MaSigPro clusters with >3 genes in the core gene list are shown. Points show the mean ± SEM for each of the four clinical groups at each timepoint.
FIGURE 5
FIGURE 5
Modular activity of the most significant modules in TB‐DM relative to TB‐only in (A) South Africa and (B) Indonesia. Modular analysis was performed between TB‐DM and TB‐only patients and the most statistically significant were chosen (p value < .05). Modular activity calculated by summing the expression of genes within a module and dividing by the number of genes within that module.
FIGURE 6
FIGURE 6
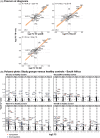
Gene expression profiles in TBrel‐IH and TB‐DM are not completely normalised to healthy control profiles at the end of TB treatment. (A) Scatter plots representing Pearson correlations between expression of all genes in targeted dcRT‐MLPA panel in TB patients relative to healthy controls (y‐axes) versus the other study groups relative to healthy controls (x‐axes), plotted as log2 FC. Red line corresponds to line of best fit and shaded bands indicate confidence intervals. Genes regulated log2 FC < ‐ .6 or > .6 are annotated. (B) Differential Expression Analysis was performed on GAPDH‐normalised log2‐transformed targeted gene expression data of the South African cohort. Volcano plots representing DEGs at diagnosis and at different timepoints post TB treatment initiation of TB patients categorised based on their diabetes/glycaemia status compared with the healthy controls. The y‐axis scales of all plots are harmonised per study group. p Values, ‐log10‐transformed for better visualisation, are plotted against log2 FC. Genes with p < .05 and log2 FC  < ‐.6 or > .6 were labelled as DEGs.
FIGURE 7
FIGURE 7
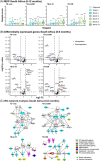
TB treatment response in TB patients is dependent on diabetes/glycaemia status. MDP and differential expression analyses were performed on GAPDH‐normalised log2‐transformed targeted gene expression data of the South African cohort. (A) MDP analyses of the different study groups showing the impact of TB treatment on the overall gene perturbation over time. Samples of patients at diagnosis were used as baseline controls. (B) Volcano plots representing DEGs regulated during TB treatment of TB patients categorised based on their diabetes/glycaemia status. The y‐axis scales of all plots are harmonised per study group. p Values, ‐log10‐transformed for better visualisation, are plotted against log2 FC. Genes with p < .05 and log2 FC  < ‐.6 or > .6 were labelled as DEGs. (C) IPA interactive network analyses of DEGs regulated during TB treatment. The various shapes of the nodes represent the functional classes of the gene products. Gene modules are indicated by distinctive colours.
FIGURE 8
FIGURE 8
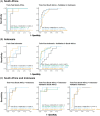
Identification of common host biomarker signatures associated with TB treatment response irrespective of population heterogeneity and diabetes/glycaemia severity. South African, Indonesian or pooled cohort transcriptomic datasets of TB patients independent of their diabetes/glycaemia status were used to train the models. Receiver operating characteristic (ROC) curves (sensitivity plotted against 1‐specificity) and area under the curve (AUC) with 95% confidence intervals (CI) show the classifying performance of the trained models. (A) The model trained on 70% of the South African dataset was tested in the remaining 30% of the South African dataset split into the different TB study groups (left panel) and validated using the complete dataset of the Indonesian cohort split into the different TB study groups (right panel). (B) The model trained on 70% of the Indonesian dataset was tested in the remaining 30% of the Indonesian dataset split into the different TB study groups (left panel) and validated using the complete dataset of the South African cohort split into the different TB study groups (right panel). (C) The model trained on 70% of the pooled (South African and Indonesian) dataset was tested in the remaining 30% of the pooled dataset split into the different TB study groups that both cohorts have in common (left panel) and validated using the complete dataset of the South African cohort split into the different TB study groups (middle panel) or the complete dataset of the Indonesian cohort split into the different TB study groups (right panel).

References

    1. Koesoemadinata RC, Mcallister SM, Soetedjo NNM, et al. Latent TB infection and pulmonary TB disease among patients with diabetes mellitus in Bandung, Indonesia. Trans R Soc Trop Med Hyg. 2017;111:81‐89. - PubMed
    1. Al‐Rifai RH, Pearson F, Critchley JA, Abu‐Raddad LJ. Association between diabetes mellitus and active tuberculosis: a systematic review and meta‐analysis. PLoS One. 2017;12:e0187967. - PMC - PubMed
    1. Jeon CY, Murray MB. Diabetes mellitus increases the risk of active tuberculosis: a systematic review of 13 observational studies. PLoS Med. 2008;5:e152. - PMC - PubMed
    1. Noubiap JJ, Nansseu JR, Nyaga UF, et al. Global prevalence of diabetes in active tuberculosis: a systematic review and meta‐analysis of data from 2.3 million patients with tuberculosis. Lancet Glob Health. 2019;7:e448‐e460. - PubMed
    1. Baker MA, Harries AD, Jeon CY, et al. The impact of diabetes on tuberculosis treatment outcomes: a systematic review. BMC Med. 2011;9:81. - PMC - PubMed

Publication types