. 2023 Sep 13;145(36):19611-19621.
doi: 10.1021/jacs.3c03913. Epub 2023 Aug 31.

A Biomimetic C-Terminal Extension Strategy for Photocaging Amidated Neuropeptides

Affiliations

A Biomimetic C-Terminal Extension Strategy for Photocaging Amidated Neuropeptides

Aryanna E Layden et al. J Am Chem Soc. .

Abstract

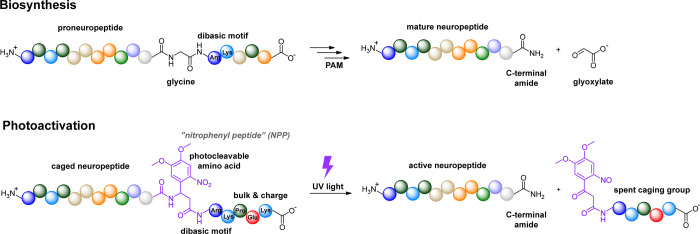
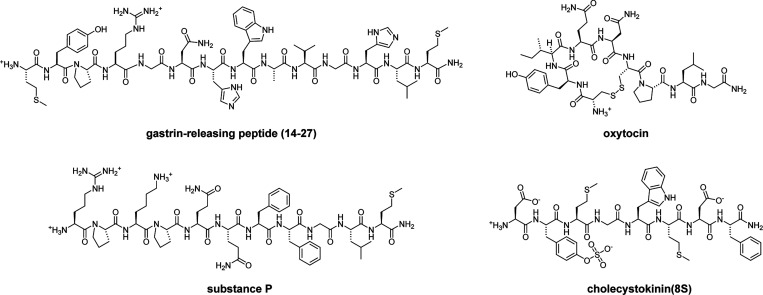
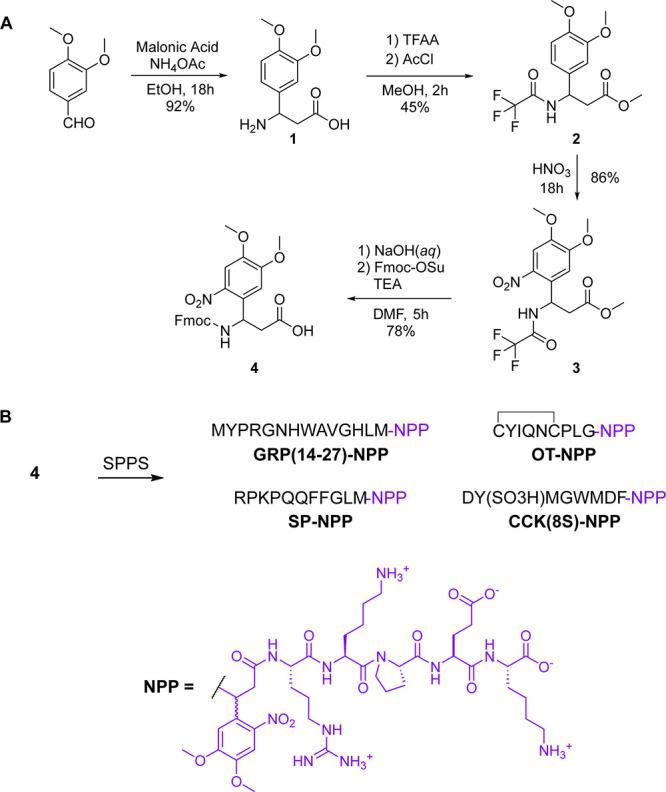
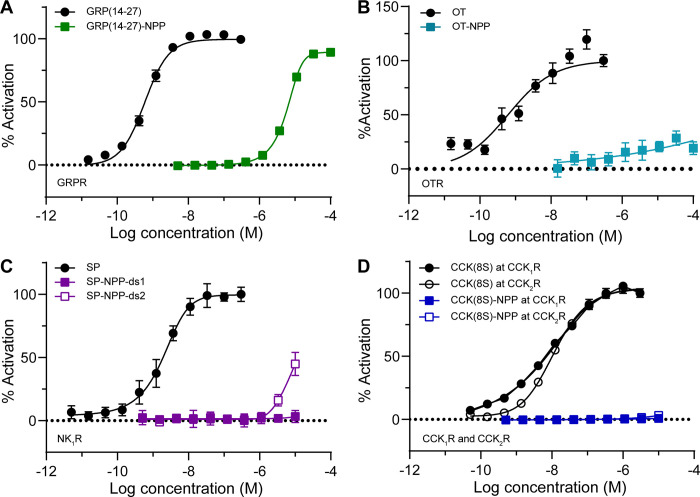
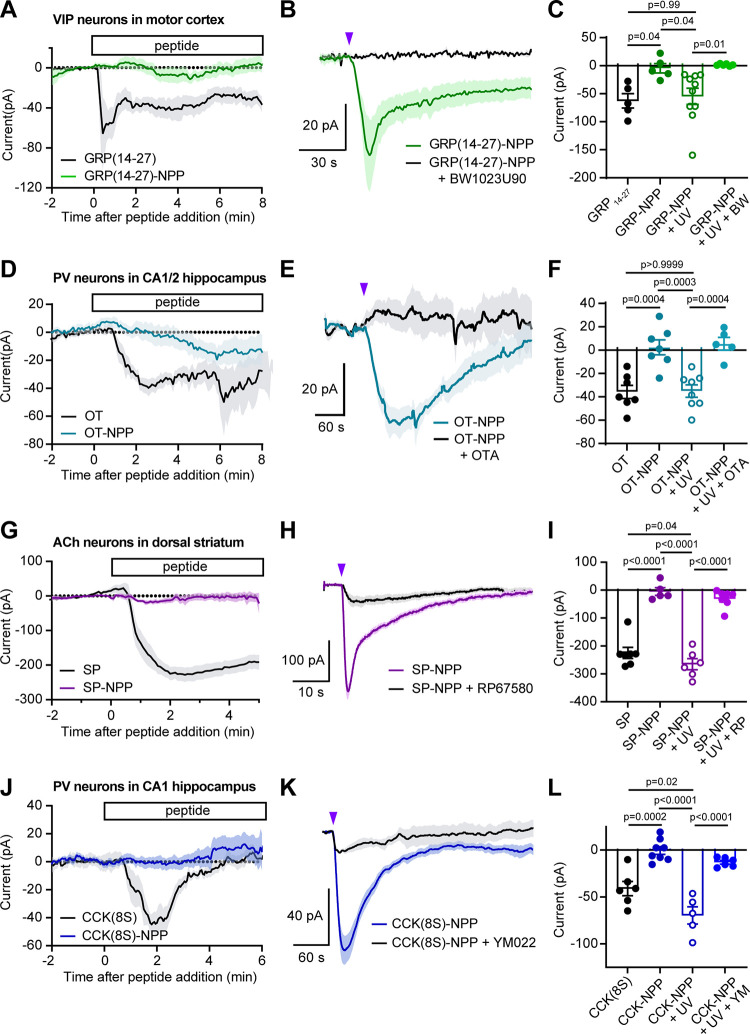
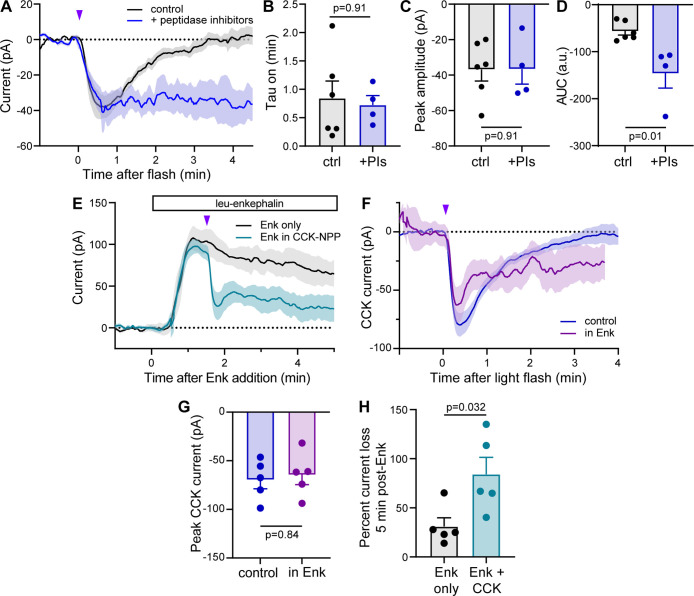
Photoactivatable neuropeptides offer a robust stimulus-response relationship that can drive mechanistic studies into the physiological mechanisms of neuropeptidergic transmission. The majority of neuropeptides contain a C-terminal amide, which offers a potentially general site for installation of a C-terminal caging group. Here, we report a biomimetic caging strategy in which the neuropeptide C-terminus is extended via a photocleavable amino acid to mimic the proneuropeptides found in large dense-core vesicles. We explored this approach with four prominent neuropeptides: gastrin-releasing peptide (GRP), oxytocin (OT), substance P (SP), and cholecystokinin (CCK). C-terminus extension greatly reduced the activity of all four peptides at heterologously expressed receptors. In cell type-specific electrophysiological recordings from acute brain slices, subsecond flashes of ultraviolet light produced rapidly activating membrane currents via activation of endogenous G protein-coupled receptors. Subsequent mechanistic studies with caged CCK revealed a role for extracellular proteases in shaping the temporal dynamics of CCK signaling, and a striking switch-like, cell-autonomous anti-opioid effect of transient CCK signaling in hippocampal parvalbumin interneurons. These results suggest that C-terminus extension with a photocleavable linker may be a general strategy for photocaging amidated neuropeptides and demonstrate how photocaged neuropeptides can provide mechanistic insights into neuropeptide signaling that are inaccessible using conventional approaches.


Conflict of interest statement

The authors declare no competing financial interest.

Figures

Figure 1
Figure 1
Biomimetic approach to photocaging C-terminally amidated neuropeptides. The biosynthesis of amidated neuropeptides involves enzymatic conversion of glycine to glyoxylate by peptidylglycine alpha-amidating monoxygenase (PAM). An adjacent dibasic motif initiates proteolytic processing prior to the oxidative cleavage by PAM to produce the active, C-terminally amidated neuropeptide. To mimic this process, the photocaged neuropeptide is C-terminally extended with a photocleavable amino acid followed by a dibasic motif and several charged, sterically bulky amino acids. Exposure to UV light removes the caging group to release the active, C-terminally amidated neuropeptide.
Figure 2
Figure 2
Chemical structures of gastrin releasing peptide (14-27), oxytocin, substance P, and cholecystokinin (8S). All four peptides contain a C-terminal amide but otherwise exhibit diverse structural features.
Scheme 1
Scheme 1. Synthesis of NPP-Caged Variants of Gastrin-Releasing Peptide (14-27), Oxytocin, Substance P, and Cholecystokinin (8S)
(A) Fmoc-protected 2-(4,5-dimethoxy-2-nitrophenyl) beta-alanine (4) was prepared from 4,5-dimethoxybenzenaldehyde via a Mannich reaction followed by functional group protection and nitration. (B) NPP-caged peptides were prepared from 4 via solid phase peptide synthesis (SPPS).
Figure 3
Figure 3
In vitro characterization of NPP-caged neuropeptides using a functional assay of G protein signaling. (A) Dose–response curves at the gastrin-releasing peptide receptor (GRPR) using a GloSensor assay of cAMP signaling in HEK293T cells (n = 10 wells per data point). Data were normalized to the maximal response to GRP(14-27) (300 nM) and are expressed as the mean ± SEM. (B) Same as panel A, but using the oxytocin receptor (OTR) and oxytocin (OT, 300 nM) for normalization. (C) Same as panel A, but using the neurokinin 1 receptor (NK1R) and substance P (SP, 300 nM) for normalization. (D) Same as panel A, but using the cholecystokinin receptors (CCK1R and CCK2R) and cholecystokinin-8S (CCK(8S), 300 nM) for normalization.
Figure 4
Figure 4
Electrophysiological validation of NPP-caged neuropeptides at endogenous receptors in acute brain slices. (A) Average inward currents over time after bath application of GRP(14-27)-NPP (3 μM, n = 5 cells from 4 mice) or GRP(14-27) (300 nM, n = 5 from 4 mice), recorded from fluorescently labeled VIP interneurons in layer 1 of the motor cortex. Data are expressed as the mean ± SEM. (B) Average inward currents evoked by photoactivation of GRP(14-27)-NPP (3 μM) with an 84 mW light flash in the absence (green, n = 10 cells from 4 mice) and presence of the GRPR antagonist BW1023U90 (1 μM) (black, n = 6 cells from 2 mice). (C) Summary of peak current amplitudes for the data shown in panels A and B. GRP(14-27) −62.8 ± 12.8; GRP(14-27)-NPP −4.8 ± 8.4; GRP(14-27)-NPP + UV −54.6 ± 14.4; GRP(14-27)-NPP + UV + BW1023U90 1.5 ± 0.7. Data are expressed as the mean ± SEM. Ordinary one-way ANOVA F (3, 22) = 6.37, p = 0.0028, p-values determined using Sidak’s multiple comparison’s test. (D) Average inward currents over time after bath application of OT-NPP (3 μM, n = 7 cells from 5 mice) or OT (300 nM, n = 7 from 4 mice), recorded from fluorescently labeled PV interneurons in the CA1 and CA2 regions of hippocampus. (E) Average inward currents evoked by photoactivation of OT-NPP (3 μM) with an 84 mW light flash in the absence (light blue, n = 8 cells from 4 mice) and presence of the OTR antagonist (OTA) (d(CH2)51,Tyr(Me)2,Thr4,Orn8,des-Gly-NH29)-Vasotocin (1 μM) (black, n = 5 cells from 2 mice). (F) Summary of peak current amplitudes for the data shown in panels D and E. OT −35.8 ± 5.7; OT-NPP 2.4 ± 6.5; OT-NPP + UV −35.1 ± 5.3; OT-NPP + UV + OTA 5.5 ± 5.5. Data are expressed as the mean ± SEM. Ordinary one-way ANOVA F (3, 23) = 14.83, p <0.0001, p-values determined using Sidak’s multiple comparison’s test. (G) Average inward currents over time after bath application of SP-NPP (1 μM, n = 6 cells from 5 mice) or SP (500 nM, n = 7 from 2 mice), recorded from fluorescently labeled cholinergic interneurons in the dorsal striatum. (H) Average inward currents evoked by photoactivation of SP-NPP (1 μM) with an 84 mW light flash in the absence (purple, n = 5 cells from 5 mice) and presence of the NK1R antagonist RP67580 (10 μM) (black, n = 6 cells from 3 mice). (I) Summary of peak current amplitudes for the data shown in panels G and H. SP −197.8 ± 20.1; SP-NPP −5.2 ± 13.6; SP-NPP + UV −265.5 ± 19.7; SP-NPP + UV + RP67580 −30. 9 ± 11.7. Data are expressed as the mean ± SEM. Ordinary one-way ANOVA F (3, 21) = 53.13, p <0.0001, p-values determined using Sidak’s multiple comparison’s test. (J) Average inward currents over time after bath application of CCK(8S)-NPP (3 μM, n = 8 cells from 6 mice) or CCK(8S) (500 nM, n = 6 from 3 mice), recorded from fluorescently labeled PV interneurons in the CA1 region of hippocampus. (K) Average inward currents evoked by photoactivation of CCK(8S)-NPP (3 μM) with an 84 mW light flash in the absence (blue, n = 5 cells from 3 mice) and presence of the CCK2R antagonist YM022 (1 μM) (black, n = 6 cells from 2 mice). (L) Summary of peak current amplitudes for the data shown in panels J and K. CCK −41.1 ± 7.6; CCK-NPP −0.4 ± 4.1; CCK-NPP + UV −69.6 ± 9.2; CCK-NPP + UV + 1 uM YM 022 −13.0 ± 2.0. Data are expressed as the mean ± SEM. Ordinary one-way ANOVA F (3, 21) = 26.59, p <0.0001, p-values determined using Sidak’s multiple comparison’s test.
Figure 5
Figure 5
CCK(8S)-NPP photouncaging unmasks temporal features of CCK signaling. (A) Average inward currents evoked by photoactivation of CCK(8S)-NPP (3 μM) with a 20 ms, 84 mW light flash in the absence (black, n = 6 cells from 2 mice) and presence of a cocktail of peptidase inhibitors (phosphoramidon (1 μM), bestatin (20 μM), butabindide ((2 μM)) (blue, n = 4 cells from 2 mice), recorded from fluorescently labeled PV interneurons in the CA1 region of hippocampus. Data are expressed as the mean ± SEM. (B) Summary of current activation time constants for the data shown in panel A. control 0.84 ± 0.30; PIs 0.73 ± 0.17. Data are expressed as the mean ± SEM. Mann–Whitney test. (C) Summary of peak current amplitudes for the data shown in panel A. control −36.8 ± 16.0; PIs −36.6 ± 16.9. Data are expressed as the mean ± SEM. Mann–Whitney test. (D) Summary of the area under the curve (0–4.5 min postflash) for the data shown in panel A. control −56.6 ± 19.9; PIs −146.5 ± 61.7. Data are expressed as the mean ± SEM. Mann–Whitney test. (E) Average outward currents evoked by bath application of leucine-enkephalin (Enk, 1 μM) in the absence (black, n = 5 cells from 2 mice) and presence of subsequent CCK(8S)-NPP (3 μM) uncaging (1 × 200 ms, 84 mW flash, teal, n = 5 cells from two mice). (F) Average inward current evoked by photoactivation of CCK(8S)-NPP in the absence (blue (control), same data as Figure 4K) and presence of Enk (purple, n = 5 cells from 2 mice), subtractively isolated from the data shown in panel E. (G) Summary of peak current amplitudes for the data shown in panel F. Control −69.6 ± 20.6; in Enk −64.5 ± 22.6. Data are expressed as the mean ± SEM. Mann–Whitney test. (H) Summary of percent current loss 5 min after Enk addition for the data shown in panel F. Enk only 31.0 ± 19.8; Enk + CCK photorelease 84.1 ± 38.8. Data are expressed as the mean ± SEM. Mann–Whitney test.

Similar articles

Cited by

References

    1. Smith S. J.; Smbül U.; Graybuck L. T.; Collman F.; Seshamani S.; Gala R.; Gliko O.; Elabbady L.; Miller J. A.; Bakken T. E.; Rossier J.; Yao Z.; Lein E.; Zeng H.; Tasic B.; Hawrylycz M. Single–Cell Transcriptomic Evidence for Dense Intracortical Neuropeptide Networks. Elife 2019, 8, e4788910.7554/eLife.47889. - DOI - PMC - PubMed
    1. Jékely G. The Chemical Brain Hypothesis for the Origin of Nervous Systems. Phil. Trans. R. Soc. B Biol. Sci. 2021, 376, 20190761.10.1098/rstb.2019.0761. - DOI - PMC - PubMed
    1. Banghart M. R.; Sabatini B. L. Photoactivatable Neuropeptides for Spatiotemporally Precise Delivery of Opioids in Neural Tissue. Neuron 2012, 73, 249–259. 10.1016/j.neuron.2011.11.016. - DOI - PMC - PubMed
    1. Banghart M. R.; He X. J.; Sabatini B. L. A Caged Enkephalin Optimized for Simultaneously Probing Mu and Delta Opioid Receptors. ACS Chem. Neurosci. 2018, 9, 684–690. 10.1021/acschemneuro.7b00485. - DOI - PMC - PubMed
    1. Xiong H.; Lacin E.; Ouyang H.; Naik A.; Xu X.; Xie C.; Youn J.; Wilson B. A.; Kumar K.; Kern T.; Aisenberg E.; Kircher D.; Li X.; Zasadzinski J. A.; Mateo C.; Kleinfeld D.; Hrabetova S.; Slesinger P. A.; Qin Z. Probing Neuropeptide Volume Transmission In Vivo by Simultaneous Near–Infrared Light-Triggered Release and Optical Sensing. Angew. Chem., Int. Ed. 2022, 61, e20220612210.1002/anie.202206122. - DOI - PMC - PubMed

Publication types