. 2023 Aug 29;13(36):25579-25598.
doi: 10.1039/d3ra02514d. eCollection 2023 Aug 21.

Mechanoluminescence, thermoluminescence, optically stimulated luminescence and photoluminescence in SrAl2O4:Eu micro- and nanophosphors: effect of particle size and annealing in different atmospheres

Affiliations

Mechanoluminescence, thermoluminescence, optically stimulated luminescence and photoluminescence in SrAl2O4:Eu micro- and nanophosphors: effect of particle size and annealing in different atmospheres

Lucky Sharma et al. RSC Adv. .

Abstract

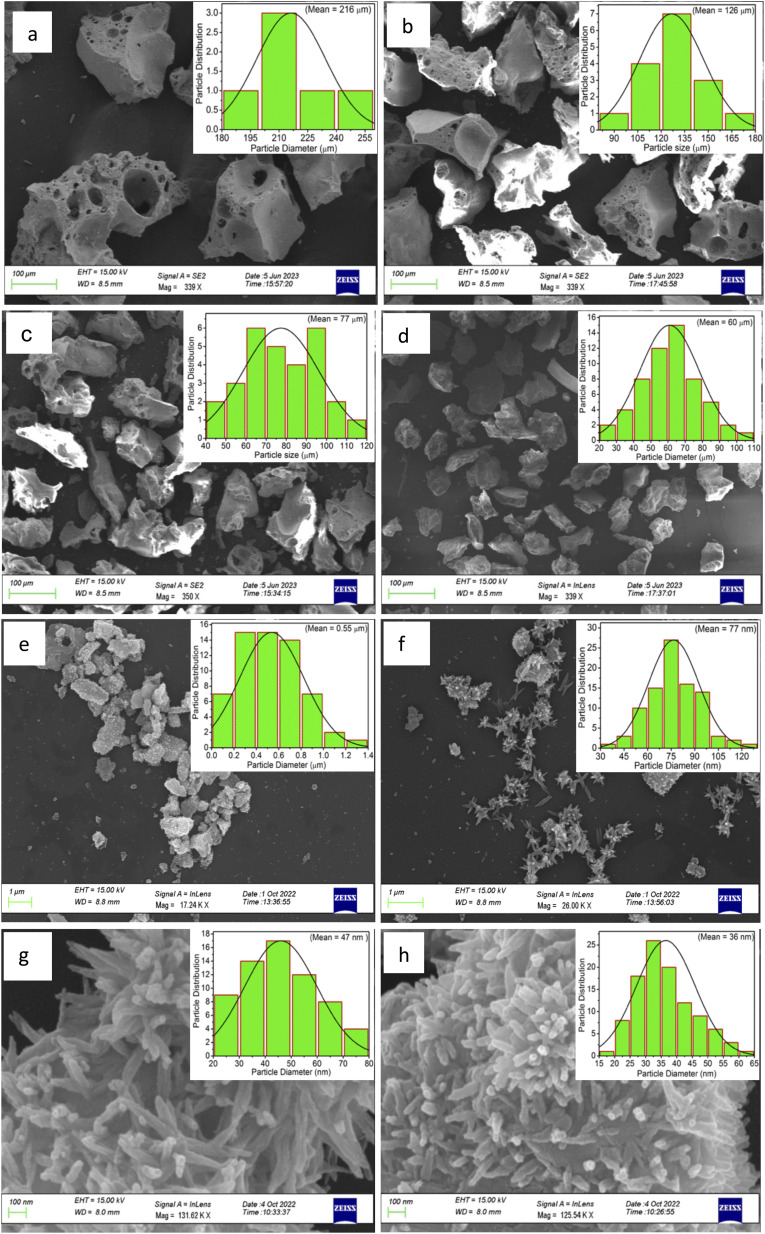
SrAl2O4:Eu in microcrystalline form was prepared by a combustion method. The formation of the material in a single phase was confirmed by XRD analysis. The material was crushed and sieved to get particles with different particle size ranges. It was further ball milled for 1-7 days to get particles in the nanosize ranges. The broadening of the XRD peaks of the phosphor material in nanocrystalline form was used to determine average particle sizes. The shapes and sizes of these particles could also be seen in FESEM images. The materials thus obtained were annealed in reducing (10% H2 in Ar) and oxidizing (in air) atmospheres at different temperatures for 1.0 h. The increase in the mechanoluminescence (ML) intensity on annealing in a reducing atmosphere at different temperatures and decrease on annealing in an oxidizing atmosphere could be attributed to redox reactions. This was further confirmed by PL measurements. Mechanoluminescence (ML), thermoluminescence (TL), and optically stimulated luminescence (OSL) of the materials were studied. In all three cases (i.e., ML, TL, and OSL), the intensities are found to decrease with the particle size. A large shift of approximately 20 °C in the main peak of TL glow curves of micro- and nanocrystalline materials shows a widening of the band gap due to the particle size effect. A decrease in piezoelectric constant (d33) and field (F V m-1) with particle size was also observed. The present systematic study of particle size effect (over a wide range of particle sizes) on ML has great importance from a technological and application point of view for developing stress sensors.


Conflict of interest statement

There is no conflict of interest to declare.

Figures

Fig. 1
Fig. 1. XRD patterns of all the materials in different micro- and nanocrystalline ranges: (1) 250–150 μm, (2) 150–125 μm, (3) 125–106 μm, (4) 106–75 μm, (5) 75–45 μm, (6) 45–38 μm, (7) 38–25 μm, (8) 25–10 μm, (9) sample after 1-day ball milling, (10) sample after 3-days ball milling, (11) sample after 5-days ball milling, (12) sample after 7-days ball milling. The data (XRD stick-pattern) using the data from the JCPDS file # 34-0379 is also given here for ready reference.
Fig. 2
Fig. 2. FESEM of the selected micro- and nanocrystalline materials: (a) 250–150 μm, (b) 125–106 μm, (c) 106–75 μm, (d) 75–45 μm, (e) 0.55 μm, (f) 77 nm, (g) 47 nm and (h) 32 nm. The particle distribution histograms are given for ready reference.
Fig. 3
Fig. 3. Variation of the ML (compressive) intensity with time for different particle size ranges. The variation of the intensity with the average particle size is also shown in the inset. The horizontal bars show the particle size range. The curve (intensity vs. particle size) has also been theoretically fitted and shows an exponential decrease in intensity with particle size decreasing. The equation with different parameters is also given in the inset. There is a very good fit up to the submicron size range. However, at nanoparticle size range as little deviation could be seen. The photograph of the captured ML glow is also shown in the inset.
Fig. 4
Fig. 4. Variation of the TL intensity with temperature (TL glow curves) for different particle size ranges. The material was irradiated to 1.0 kGy dose of γ-rays from 60Co radioactive source. The variation of the intensity with the average particle size is also shown in the inset. The horizontal bars show the particle size range. The curve (intensity vs. particle size) has also been theoretically fitted and shows an exponential decrease in intensity with decreasing particle size. The equation with different parameters is also given in the inset. There is a very good fit up to submicron size range. However, at nanoparticle size range a slight deviation could be seen.
Fig. 5
Fig. 5. Variation of the CW-OSL intensity with time for different particle size ranges. The material was irradiated to 1.0 kGy dose of γ-rays from 60Co radioactive source. The variation of the intensity with the average particle size is also shown in the inset. The horizontal bars show the particle size range. The shape of the curve (intensity vs. particle size) shows an exponential decrease in intensity with decreasing particle size. However, for bigger particles there is decrease in the intensity as in the case of nanoparticles but for different reasons. For microcrystalline particles of bigger sizes, the stimulating light more scattered, decreasing the number of stimulating photons and the resulting CW-OSL output, while in the case of nanoparticles, it is the particle size effect.
Fig. 6
Fig. 6. Variation of piezoelectric constant (d33) with the particle size of the SAOE ML phosphor material. The horizontal bars show different particle size ranges. The data has also been fitted theoretically to see the trend and it is shown in the inset. It is observed that there is a very good correlation between the piezoelectric constant and the particle size. It could be seen that the piezoelectric constant decreases exponentially with the particle size decreasing. The formulation used for fitting is also given in the inset.
Fig. 7
Fig. 7. Variation of piezoelectric field with the particle size of the SAOE ML phosphor material. The data has also been fitted theoretically to see the trend and it is shown in the inset. It is observed that there is a very good correlation between the piezoelectric field and the particle size. It could be seen that the piezoelectric constant decreases exponentially with the particle size decreasing. The formulation used for fitting is also given in the inset.
Fig. 8
Fig. 8. The dielectric constant measurements of the SAOE phosphor of different particle sizes. It could be seen in the figure that the dielectric permittivity of the materials is constant at low frequencies (∼0.7 MHz).
Fig. 9
Fig. 9. Variation of the ML (impulsive) intensity with time for different particle size ranges. The variation of the intensity with the average particle size is also shown in the inset. The horizontal bars show the particle size range. The curve (intensity vs. particle size) has also been theoretically fitted and shows an exponential decrease in intensity with particle size decreasing. The equation with different parameters is also given in the inset. There is a very good fit up to the submicron size range. However, at the nanoparticle size range, a slight deviation could be seen here also.
Fig. 10
Fig. 10. PL excitation and emission spectra of SAOE phosphor annealed in oxidizing (air) and reducing (10% H2 in Ar) atmospheres at different temperatures. The spectra for the pristine (as prepared) sample are also shown in the figure. The average particle size was in the range of (75–106 μm). Approximately the same amount of the sample material was taken every time to record the spectra. PL study was also done for the nanocrystalline materials but not given here due to the paucity of space and similarity in the spectra except for the low intensity and slight shifts in their peak positions.
Fig. 11
Fig. 11. (A) The effect of annealing temperature after annealing in oxidizing (air) and reducing (10% H2 in Ar) atmospheres on the microcrystalline SAOE phosphor. The ML of pristine (as prepared) material is also shown for comparison, (1) as prepared, (2) annealed in air at 200 °C, (3) air at 400 °C, (4) air at 600 °C, (5) air at 800 °C, (6) annealed in reducing (10% H2 in Ar) atmosphere at 200 °C, (7) (10% H2 in Ar) at 400 °C, (8) (10% H2 in Ar) at 600 °C, (9) (10% H2 in Ar) at 800 °C. The variation of the maximum ML intensity with particle size is also shown in the inset. The particle size was in the range of 106–75 μm. (B) The effect of annealing temperature after annealing in oxidizing (air) and reducing (10% H2 in Ar) atmospheres on the nanocrystalline SAOE phosphor. The ML of pristine (as prepared) material is also shown for comparison, (1) as prepared, (2) annealed in air at 200 °C, (3) air at 400 °C, (4) air at 600 °C, (5) air at 800 °C, (6) annealed in reducing (10% H2 in Ar) atmosphere at 200 °C, (7) (10% H2 in Ar) at 400 °C, (8) (10% H2 in Ar) at 600 °C, (9) (10% H2 in Ar) at 800 °C. The variation of the maximum ML intensity with particle size is also shown in the inset. The particle size was 32 nm.
Fig. 12
Fig. 12. Effect of the annealing at the optimized temperatures, i.e., (200 °C) in oxidizing (air) and (800 °C) in reducing (10% H2 in Ar) atmospheres on TL glow curves for different micro- and nanocrystalline particle sizes of the unirradiated SAOE ML phosphor: (A) annealed in air at 200 °C, (B) annealed in 10% H2 in Ar atmosphere. The arrows pointing downwards show a decrease in TL intensity with the particle size decreasing. It could also be noted that the intensity of each particle size increases more than ten times on annealing in reducing (10% H2 in Ar) atmosphere.
Fig. 13
Fig. 13. Deconvolution of a TL glow curve by peak shape method using Kitis’ formula for second order kinetics. The TL glow curves of the pristine (as prepared) and the materials annealed at the optimized temperatures, 200 °C in air and 10% H2 in Ar atmospheres are also shown. Three TL peaks exist in the glow curves and deconvoluted successfully, shown as Peak 1, Peak 2, and Peak 3 in the figure. Trapping parameters, including trap depth have also been determined using these peaks and is given in Table 1.
Fig. 14
Fig. 14. TL glow curves of unirradiated SAOE phosphor materials annealed at different temperatures in air atmosphere, (A) microcrystalline material (106–75 μm) and (B) nanocrystalline material having particle size ∼32 nm. Decrease in the TL intensity with particle size without any change in the glow curve structure of the microcrystalline material could be clearly seen in the figure. However, in the case of nanomaterial a shift in the peak temperature(s) could also be seen with the annealing temperatures. The TL glow curves of the nanocrystalline material annealed in the temperature range of 400–800 °C have been multiplied by the factors near these curves and the ordinate (Y-axis) scale needs to be divided these factors to see the actual intensity of these curves.
Fig. 15
Fig. 15. TL glow curves of SAOE phosphor materials annealed at different temperatures in reducing (10% H2 in Ar) atmosphere, (A) microcrystalline material (106–75 μm) and (B) nanocrystalline material having particle size ∼32 nm. Decrease in the TL intensity with particle size without any change in the glow curve structure of the microcrystalline material could be clearly seen in the figure. However, in case of nanomaterial a shift in the peak temperature(s) could also be seen with the annealing temperatures. The TL glow curves of the nanocrystalline material annealed in the temperatures 400 and 600 °C have been multiplied by the factors near these curves and the ordinate (Y-axis) scale needs to be divided these factors to see the actual intensity of these curves.
Fig. 16
Fig. 16. The ML glow curves of the SAOE phosphor material annealed in air at 200 °C for 1.0 h for repeated ten cycles of the load. However, the variation with seven cycles only is shown for better clarity. The enlarged view of a selected (cycle-2) has also been shown in the inset. It could be clearly seen in the figure that the maximum ML intensity is diminishing with increasing the number of repeated cycles.
Fig. 17
Fig. 17. (A) Regeneration of ML of micro- (106–75 μm) and nanocrystalline (∼32 nm) by UV-irradiation after ten cycles of ML readouts: (a) the ML glow curves of the materials after ten readouts and irradiation for different UV-irradiation time periods are shown in the figure. The ML glow curves of the first cycle and that of the tenth cycle are also shown for comparison, (B) the ML glow curves of the materials after ten readouts and irradiation for different UV-irradiation time periods are shown in the figure. The ML glow curves of the first cycle and that of the tenth cycle are also shown for comparison. No ML residue was observed after the tenth cycle of the ML readout in both the cases. The increase in the ML intensity with the UV-irradiation time periods could also be observed. The only difference in these two cases is that the intensity of the nanocrystalline is low.
Fig. 18
Fig. 18. (A) Regeneration of ML of micro- (106–75 μm) and nanocrystalline (∼32) nm by annealing after ten cycles of ML readouts: (a) the ML glow curve of the material annealed at 200 °C in air for the first cycle of readout, (b) the ML glow curve of the same materials after ten cycles of readouts, (c) ML glow curves of the same material after taking ten cycles of ML readouts and annealing at 200 °C, (d) ML glow curves of the same material after taking TL readouts and annealing at 200 °C, (e) the ML glow curves of the material annealed at 800 oC in reducing (10% H2 in Ar) atmosphere, (f) the ML glow curves of the material firstly annealed at 800 °C in air and later annealing at 400 °C in reducing (10% H2 in Ar) atmosphere, (g) the ML glow curves of the material firstly annealed at 800 °C in air and later annealing at 600 °C in reducing (10% H2 in Ar) atmosphere, (h) the ML glow curves of the material firstly annealed at 800 °C in air and later annealing at 800 °C in reducing (10% H2 in Ar) atmosphere. Applied load variation with time has also been shown here; (B) all the experiments described are also done for nanocrystalline materials also. Typical results, for different temperatures for the material having ∼32 nm particle size, are shown in this figure except for annealing at 400 and 600 °C as not much change in ML intensity was observed earlier.
Fig. 19
Fig. 19. FESEM of the nanomaterial (32 nm) annealed at 800 °C: (A) in air atmosphere and (B) in reducing (10% H2 in Ar) atmosphere for 1.0 h.

Similar articles

Cited by

References

    1. Chandra B. P., Mechanoluminescence, in Luminescence of Solids, ed. D. R. Vij, Plenum Press, New York, 1998, pp. 361-389
    1. Chandra B. P., Mechanoluminescent smart materials and their applications, in Electronic and Catalytic Properties of Advanced Materials, ed. A. Stashans, S. Gonzalez and H. P. Pinto, Transworld Research Network, Trivandrum, Kerala, India, 2011, pp. 1–37
    1. Xin P. Zhuang Y. Mei L. Xie R. J. Chin. Ceram. Soc. 2022;50:3147–3164.
    1. Xu C. N., Encyclopedia of Smart Materials, 2002, 1, pp. 190–201
    1. Feng A. Smet P. F. Materials. 2018;11:484. - PubMed