. 2023 Aug 6;13(13):4449-4468.
doi: 10.7150/thno.84710. eCollection 2023.

Global analysis of HLA-A2 restricted MAGE-A3 tumor antigen epitopes and corresponding TCRs in non-small cell lung cancer

Affiliations

Global analysis of HLA-A2 restricted MAGE-A3 tumor antigen epitopes and corresponding TCRs in non-small cell lung cancer

Bei Zhang et al. Theranostics. .

Abstract

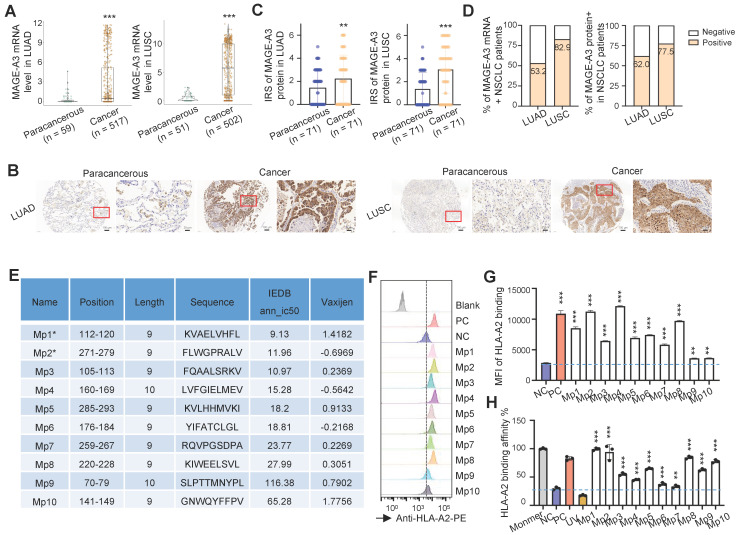
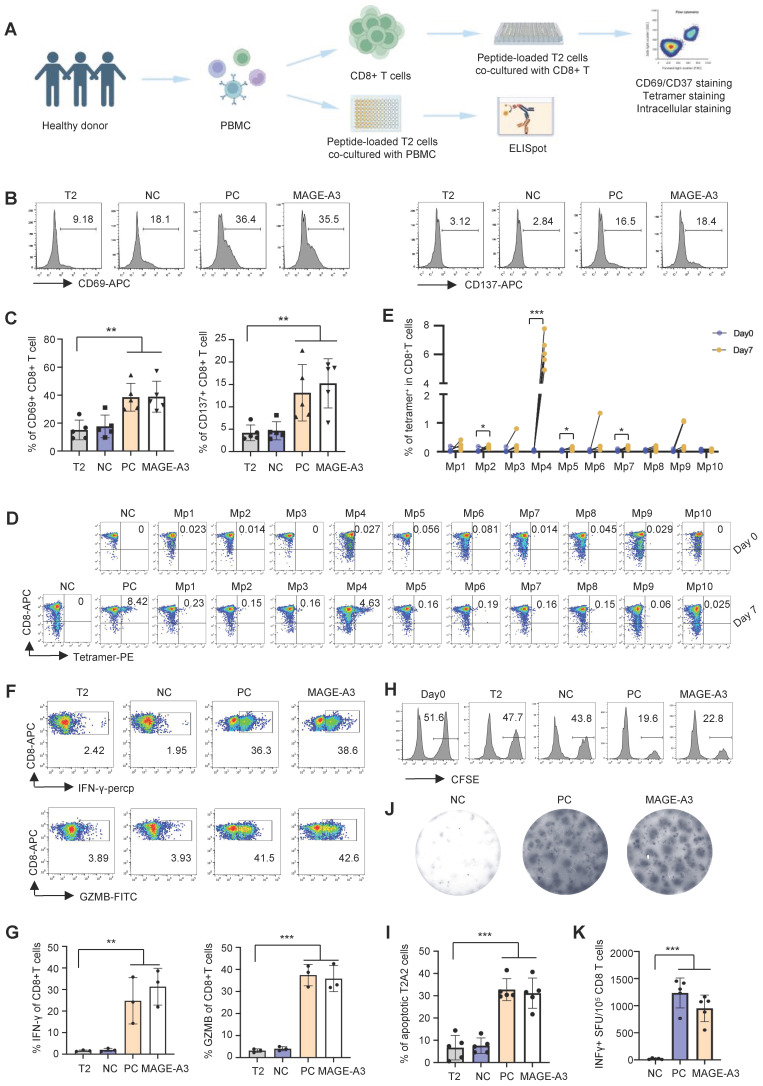
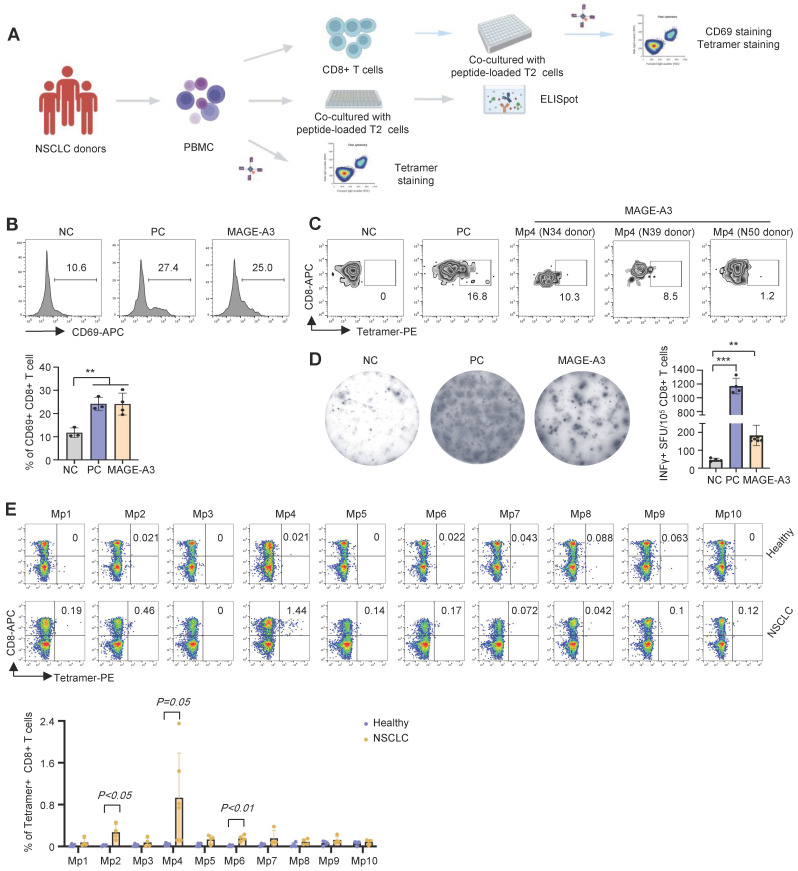
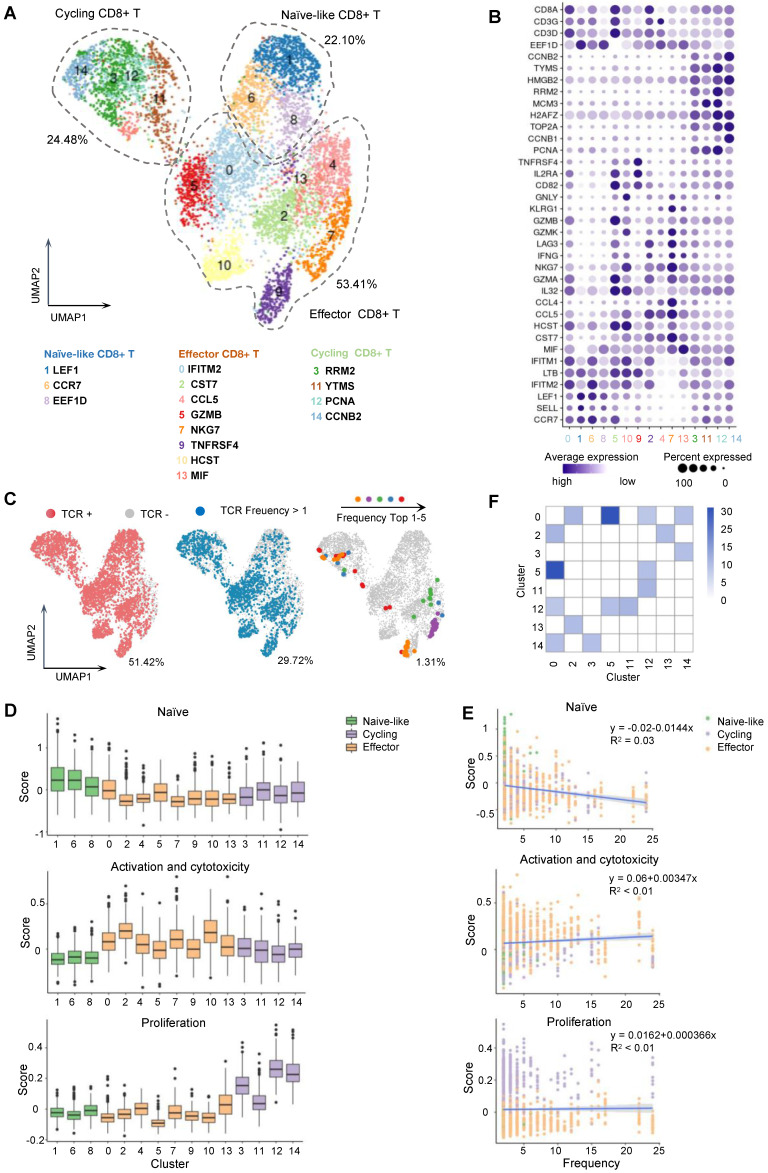
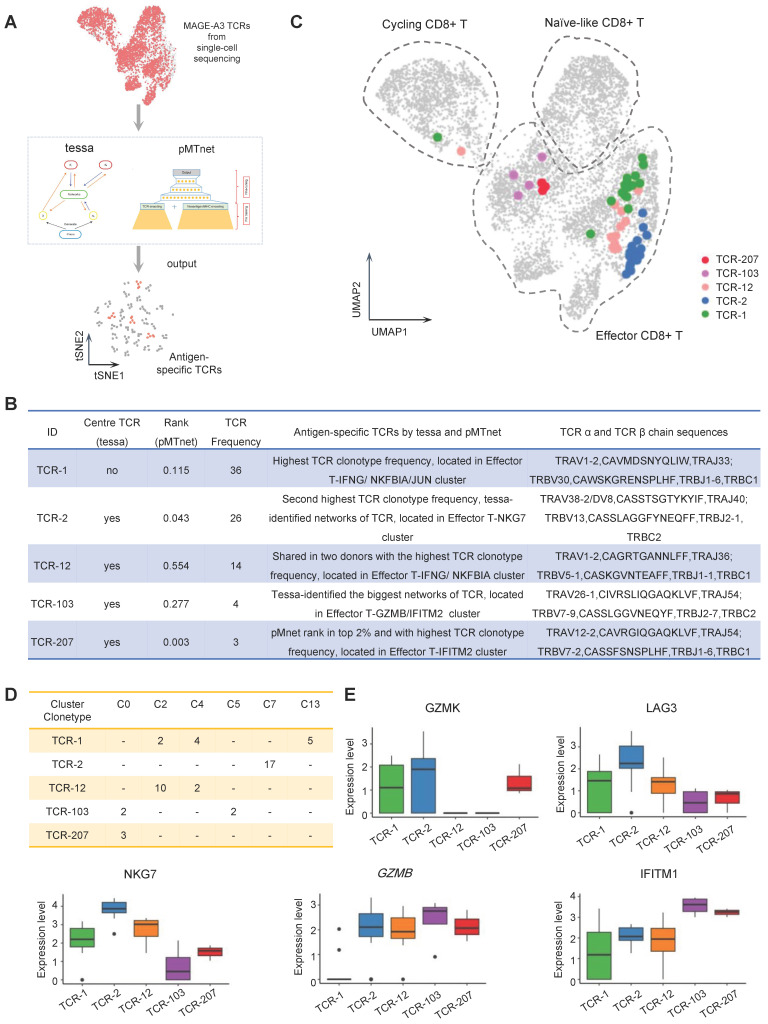
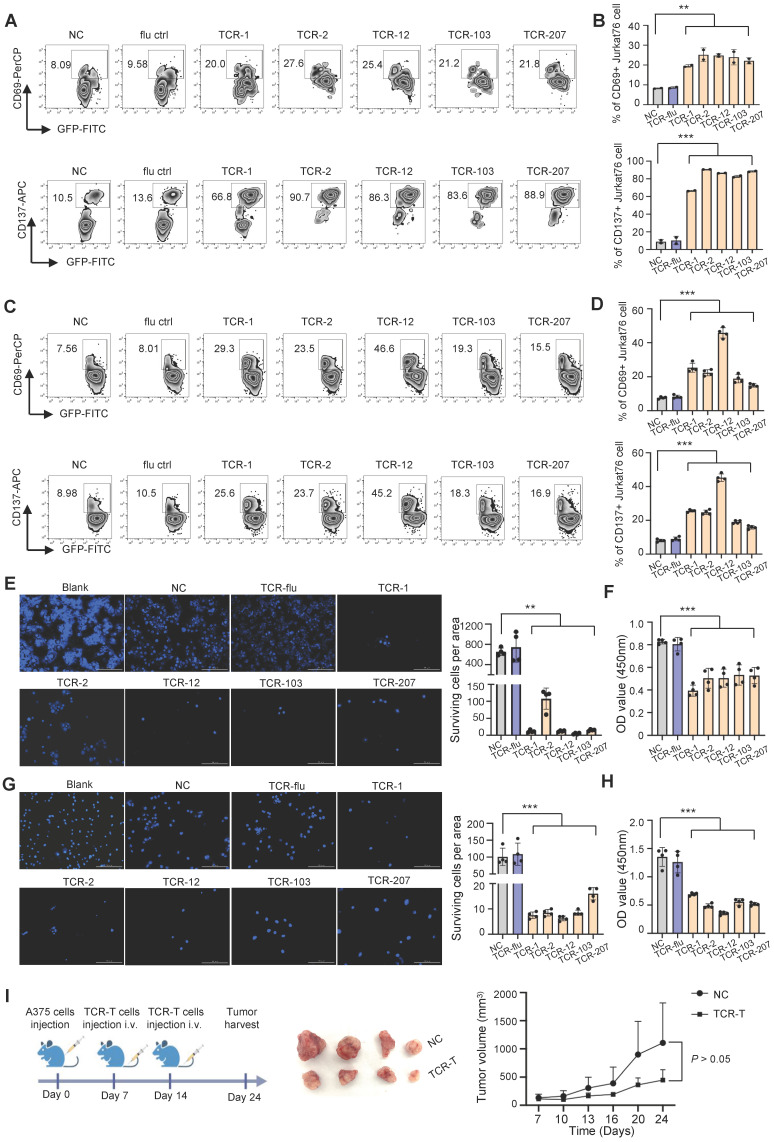
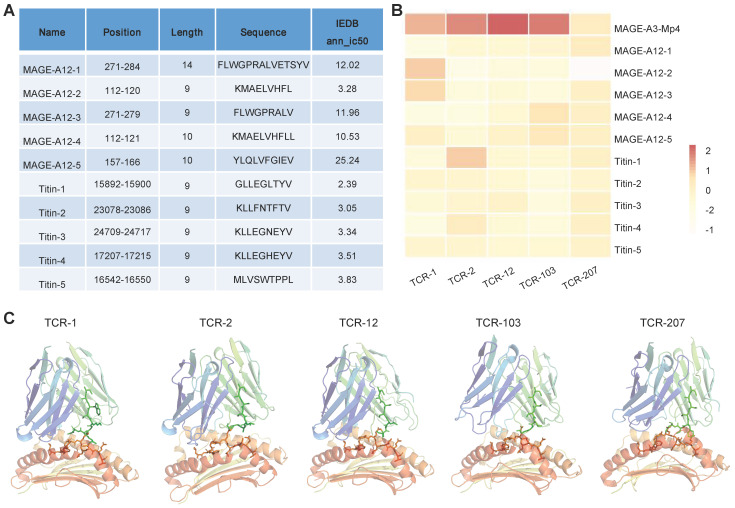
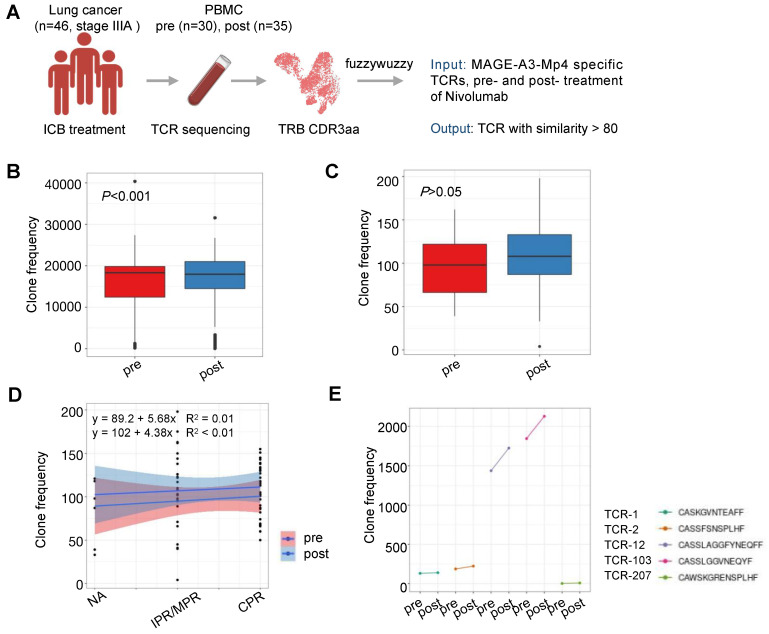
Background: Advanced non-small cell lung cancer (NSCLC) is the most common type of lung cancer with poor prognosis. Adoptive cell therapy using engineered T-cell receptors (TCRs) targeting cancer-testis antigens, such as Melanoma-associated antigen 3 (MAGE-A3), is a potential approach for the treatment of NSCLC. However, systematic analysis of T cell immune responses to MAGE-A3 antigen and corresponding antigen-specific TCR is still lacking. Methods: In this study, we comprehensively screened HLA-A2 restricted MAGE-A3 tumor epitopes and characterized the corresponding TCRs using in vitro artificial antigen presentation cells (APC) system, single-cell transcriptome and TCR V(D)J sequencing, and machine-learning. Furthermore, the tumor-reactive TCRs with killing potency was screened and verified. Results: We identified the HLA-A2 restricted T cell epitopes from MAGE-A3 that could effectively induce the activation and cytotoxicity of CD8+ T cells using artificial APC in vitro. A cohort of HLA-A2+ NSCLC donors demonstrated that the number of epitope specific CD8+ T cells increased in NSCLC than healthy controls when measured with tetramer derived from the candidate MAGE-A3 epitopes, especially epitope Mp4 (MAGE-A3: 160-169, LVFGIELMEV). Statistical and machine-learning based analyses demonstrated that the MAGE-A3-Mp4 epitope-specific CD8+ T cell clones were mostly in effector and proliferating state. Importantly, T cells artificially expressing the MAGE-A3-Mp4 specific TCRs exhibited strong MAGE-A3+ tumor cell recognition and killing effect. Cross-reactivity risk analysis of the candidates TCRs showed high binding stability to MAGE-A3-Mp4 epitope and low risk of cross-reaction. Conclusions: This work identified candidate TCRs potentially suitable for TCR-T design targeting HLA-A2 restricted MAGE-A3 tumor antigen.

Keywords: Cancer immunotherapy; Epitope-specific TCR; MAGE-A3; NSCLC.


Conflict of interest statement

Competing Interests: Patent applications have been filed on aspects of the described candidate TCR sequences for TCR-T design by O.J.L., B.Z., Z.R., G.C., L.G. and H.Z. The other authors declare no competing interests.

Figures

Figure 1
Figure 1
Identification of HLA-A2-restricted T cell epitopes from MAGE-A3. (A) Boxplots of MAGE-A3 mRNA expression level in LUAD (left, n = 59 paracancerous and n = 517 tumor) and LUSC (right, n = 51 paracancerous and n = 502 tumor) from the TCGA database. (B) Representative immunohistochemistry images of MAGE-A3 protein in LUAD (left) and LUSC (right), and the adjacent lung tissue. (C) Overall statistics of MAGE-A3 immunohistochemistry on sections from the LUAD (left) and LUSC (right) tissue microarray (n = 75). Bar charts show the medians with individual data points, **P < 0.01, ***P < 0.001. (D) Bar charts summarizing the percentage of MAGE-A3 mRNA (left) and protein (right) positive NSCLC patients, respectively. (E) Summary of the predicted HLA-A2 restricted T cell epitopes from MAGE-A3. (F-G) Comparison of the predicted MAGE-A3 epitopes binding affinity to HLA-A2 MHC-I on T2 cells. Binding capacity was presented as mean fluorescence intensity (MFI) of HLA-A2 staining, (F) is the representative plot of (G), **P < 0.01, ***P < 0.001; Blank: no peptides; NC: negative control, EBV virus peptide IVTDFSVIK; PC: positive control, flu M1 peptide GILGFVFTL. Data are shown as mean ± SD. Statistical significance was determined by one-way ANOVA. (H) Evaluation of the predicted MAGE-A3 epitopes binding to HLA-A2 by ELISA assay. Threshold for pMHC formation positivity was set as above the average OD value of the negative control. Monomer: control UV-sensitive peptide without UV irradiation. UV: control UV-sensitive peptide with UV irradiation and free from MAGE-A3 peptide exchange. Data are shown as mean ± SD. Each dot represents a single experiment. **P < 0.01; ***P < 0.001. Statistical significance was determined by one-sided t-test or one-way ANOVA.
Figure 2
Figure 2
T cell activation and cytotoxicity induced by epitopes from MAGE-A3. (A) Schematics showing the in vitro screening of MAGE-A3 epitope-specific T cells by artificial APCs. CD8+ T cells from HLA-A2+ healthy donors were co-cultivated with peptide-loaded T2 cells. The T cell activation marker CD69 and CD137 were analyzed at 16h. Tetramer+ CD8+ T cell were detected at day 0 and day 7. Intracellular staining (IFN-γ and GZMB) was used to detect T cell cytotoxicity at day 7. (B-C) Representative FACS results (B) and overall summary statistics (C) of CD8+ T cell activation marker CD69 and CD137 expression after co-cultivation with T2 cells loaded with MAGE-A3 peptides (n = 5). T2: CD8+ T cells co-cultivated with PBS treated T2 cells; NC: CD8+ T cells co-cultivated with EBV peptide loaded T2 cells; PC: CD8+ T cells co-cultivated with flu peptide loaded T2 cells. CD69 and CD137 expression was detected by FACS 16 hours post-cocultivation. (D) Representative FACS plots showing the stimulation of the CD8+ T cells by tetramers. Top row, day 0; bottom row, day 7. CD8+ T cells from healthy donors were co-cultivated with T2 cells loaded with MAGE-A3 peptides for activation. (E) Summary statistics of epitope specific CD8+ T cell (n = 5) before (day 0) and after 7 days stimulation by distinct MAGE-A3 epitopes. (F) Representative FACS plots of IFN-γ (top) and GZMB (bottom) in CD8+ T cells after epitope stimulation for 7 days. Values in each panel indicate the percentage of IFN-γ+CD8+ or GZMB+CD8+ T cells, respectively. (G) Corresponding summary statistics of IFN-γ (left) and GZMB (right) positive CD8+ T cells (n = 3). (H-I) Epitope specific CD8+ T cell mediated cytotoxicity evaluation after 7 days of cell culturing. Representative FACS plots result (H) and corresponding summary statistics (I) of apoptotic cells. CFSE+ T2 cells were counted as survived target cells and the percentage of apoptotic cells was calculated by 50% minus the percentage of survived cells (n = 5), statistical significance was determined by kruskal wallis H test. (J-K) Exemplary microscopy image (J) and summary statistics (K) for anti-IFN-γ ELISpot assay on PBMC cells from HLA-A2+ healthy donors stimulated by distinct epitopes (n = 5). NC: PBMC co-cultivated with EBV peptide loaded T2 cells; PC: PBMC co-cultivated with T2 cells in the existence of anti-CD3 mAb CD3-2; MAGE-A3: PBMC co-cultivated with MAGE-A3 peptides loaded T2 cells. Data are shown as mean ± SD. **P < 0.01; ***P < 0.001. Each dot represents a single experiment. Statistical significance was determined by one-sided t-test or one-way ANOVA.
Figure 3
Figure 3
Characterization of cytotoxic effects of MAGE-A3 epitope-specific T cells. (A) Schematics showing the procedure used to verify immunogenic MAGE-A3 epitopes in HLA-A2+ NSCLC patients. (B) Representative FACS plots (up) and overall summary (down) of CD8+ T cell activation marker CD69 expression after co-cultivation with T2 cells loaded with MAGE-A3 peptides (n = 3). (C) Representative FACS plots showing the stimulation of the CD8+ T cells by tetramer prepared with MAGE-A3-Mp4 epitope (n = 3). CD8+ T cells from NSCLC donors were co-cultivated with T2 cells loaded with MAGE-A3 peptides for 3 days. (D) Representative images (left) and summary statistics (right) for anti-IFN-γ ELISpot assay (n = 7 for mixed; n = 4 for NC and PC). PBMC cells from HLA-A2+ NSCLC donors were co-cultivated with T2 cells loaded with MAGE-A3 peptides for 48 hours. (E) Up: Representative FACS plots of T cell staining with the indicated tetramers from the PBMC of HLA-A2+ healthy donors or HLA-A2+ NSCLC patients. Down: Percentage comparison of tetramer+CD8+ T cells between healthy donors (n = 4) and NSCLC patients (n = 6 for Mp4; n = 4 for the others). Data are shown as mean ± SD. **P < 0.01; ***P < 0.001. Each dot represents a single experiment. Statistical significance was determined by one-sided t-test or one-way ANOVA.
Figure 4
Figure 4
Single-cell transcriptome and TCR landscape of CD8+ T cells specific to MAGE-A3-Mp4 epitopes. (A) Uniform manifold approximation and projection (UMAP) visualization of the scRNA-seq data from 5891 tetramer sorted MAGE-A3-Mp4 epitope-specific CD8+ T cells. The identified cell clusters (n = 15) are depicted with distinct colors. Cluster-specific genes are shown adjacent to each cluster ID, respectively. (B) Dot plot of marker genes for each T cell subtypes. Color-scale shows the average normalized expression of marker genes in each subtype, and dot size indicates the percentage of cells within each cell cluster expressing the marker gene. The cluster IDs on x-axis is the same as (A). (C) UMAP visualization with total TCR sequence detection information (left), the TCR clonotype expansion (clonotype frequency > 1) information (middle) and the top 5 most frequent TCR clonotype information for MAGE-A3-Mp4 epitope. (D) Single-cell transcriptome-derived CD8+ T cell naivety, proliferation and activation, and cytotoxicity score comparison between cell clusters. Gene panels used for naivety, activation and cytotoxicity, and proliferation score calculation are listed in Table S5. (E) Scatter-plot visualization of CD8+ T cell TCR clonotype frequency (x-axis) vs. cell naivety, activation and cytotoxicity, and proliferation score, respectively. Each dot represents a CD8+ T cell, with color corresponds to its annotated subtype. Blue lines are fitted by linear model with grey area indicating the 95% confidence band. Spearman correlations (ρ) are also shown. (F) Heatmap visualization of numbers of TCR clonotypes shared by two CD8+ T cell clusters. Only cell clusters with shared clonotypes > 10 with at least one other cluster are shown. For boxplots, the outlines of the boxes represent the first and third quartiles. The line inside each box represents the median, and boundaries of the whiskers are found within the 1.5×IQR value.
Figure 5
Figure 5
Antigen-specific TCRs screening by machine-learning. (A) Schematic workflow for inferring MAGE-A3 antigen specificity for the CD8+ T cells from health donors using the tessa and pMTnet machine-learning framework, respectively. (B) The detailed information of the selected candidate TCRs. (C) UMAP visualization of the MAGE-A3-Mp4 epitope-specific CD8+ T cells with the 5 selected candidate TCR sequences information projection. (D) The clonotype expansion distribution information of the 5 selected candidate TCRs in the corresponding CD8+ T cell cluster. (E) Boxplot of selected gene expression level of CD8+ T cells with the 5 selected candidate TCRs. For boxplots, the outlines of the boxes represent the first and third quartiles. The line inside each box represents the median, and boundaries of the whiskers are found within the 1.5×IQR value.
Figure 6
Figure 6
T cells expressing the candidate TCRs responds to MAGE-A3 antigen in vitro and in vivo. (A-B) Representative FACS plots (A) and overall summary statistics (B) of J76 cells expressing activation marker CD69 and CD137. J76 cells expressing TCR-1, TCR-2, TCR-12, TCR-103 and TCR-207 were co-cultured with PC9 lung cancer cells. CD69 and CD137 expression was detected by FACS 16 hours post-cocultivation (n = 2). (C-D) Same as (A-B), but for J76 cells expressing TCR-1, TCR-2, TCR-12, TCR-103 and TCR-207 co-cultured with A375 melanoma cells. CD69 and CD137 expression was detected by FACS 16 hours post-cocultivation (n = 4). (E) Representative Hoechst staining of PC9 cells (left) and summary statistics of surviving cell counts (right; n = 4). (F) Bar plots showing the summary statistics of OD value (n = 4). The PC9 cells were co-cultivated with J76 cells expressing the candidate TCRs for 96h. (G) Representative Hoechst staining of A375 cells (left) and summary statistics of surviving cell counts (right; n = 4). (H) Bar plots showing the summary statistics of OD value (n = 4). The A375 cells were co-cultivated with J76 cells expressing the candidate TCRs for 96h. (I) Experiment overview of in vivo anti-tumor assessment (left), visual observation of the tumors (middle) and tumor growth curves of mice grouped by treatment with TCR-T (TCR-2 and TCR-12) cells (1×10⁷) or control-T cells (1×10⁷) (right), mice (n=4). Data are shown as mean ± SD. **P < 0.01; ***P < 0.001. Each dot represents a single experiment. Statistical significance was determined by one-sided t-test or one-way ANOVA.
Figure 7
Figure 7
Evaluation of cross-reaction with peptides from MAGE-A12 and Titin by candidate TCRs. (A) Summary of the predicted top 5 HLA-A2 restricted T cell epitopes from MEGA-12 and Titin protein. (B) Heatmap visualization of the docking prediction results between the 5 candidate TCRs and HLA-A2 presenting distinct epitopes. Color intensity represents different docking stability score, with darker colors indicating higher score and suggesting more stable pMHC-TCR complex. (C) The simulated pMHC-TCR complex docking structure of the 5 candidate TCR with MAGE-A3-Mp4: the top part is the structure of TCR and the bottom is the structure of HLA-A2 presenting the MAGE-A3-Mp4 peptide.
Figure 8
Figure 8
Characterization of MAGE-A3-specific TCR clonotype expansion in lung cancer patients responding to ICB treatment. (A) Schematics of analysis workflow (also see Methods). (B) Boxplot comparison of the number of TCRs from lung cancer patients before and after ICB treatment matching MAGE-A3-Mp4 specific TCRβ CDR3 sequences from our single-cell sequencing data. 80% CDR3 amino acid sequence similarity was considered as a match. For boxplots, the outlines of the boxes represent the first and third quartiles. The line inside each box represents the median, and boundaries of the whiskers are found within the 1.5IQR value. Statistical significance was determined by Wilcoxon. (C) Same as B, but for comparing the TCR repertoires of lung cancer patients pre- and post-treatment to the 5 selected candidate TCR sequences (i.e., TCR-1, TCR-2, TCR-12, TCR-103 and TCR-207). Statistical significance was determined by paired t test. (D) Scatter plot showing the number of TCRs from lung cancer patients pre- and post-treatment in different pathologic response condition matching the 5 candidate TCRs. IPR, minor pathologic response. MPR, major pathologic response. NA, not otherwise specified. CPR, complete pathologic response. (E) Statistics of sum of TCRs from lung cancer patients pre- and post-treatment matching each of the 5 candidate MAGE-A3-Mp4 specific TCRs.

Similar articles

Cited by

References

    1. Sung H, Ferlay J, Siegel RL, Laversanne M, Soerjomataram I, Jemal A. et al. Global Cancer Statistics 2020: GLOBOCAN Estimates of Incidence and Mortality Worldwide for 36 Cancers in 185 Countries. CA Cancer J Clin. 2021;71:209–49. - PubMed
    1. Thai AA, Solomon BJ, Sequist LV, Gainor JF, Heist RS. Lung cancer. Lancet. 2021;398:535–54. - PubMed
    1. Planchard D, Popat S, Kerr K, Novello S, Smit EF, Faivre-Finn C. et al. Metastatic non-small cell lung cancer: ESMO Clinical Practice Guidelines for diagnosis, treatment and follow-up. Ann Oncol. 2018;29:iv192–iv237. - PubMed
    1. Anagnostou V, Smith KN, Forde PM, Niknafs N, Bhattacharya R, White J. et al. Evolution of Neoantigen Landscape during Immune Checkpoint Blockade in Non-Small Cell Lung Cancer. Cancer Discov. 2017;7:264–76. - PMC - PubMed
    1. Jhunjhunwala S, Hammer C, Delamarre L. Antigen presentation in cancer: insights into tumour immunogenicity and immune evasion. Nat Rev Cancer. 2021;21:298–312. - PubMed

Publication types