. 2023 Aug 15;13(13):4482-4496.
doi: 10.7150/thno.84921. eCollection 2023.

Restoration of CPT1A-mediated fatty acid oxidation in mesothelial cells protects against peritoneal fibrosis

Affiliations

Restoration of CPT1A-mediated fatty acid oxidation in mesothelial cells protects against peritoneal fibrosis

Wenyan Su et al. Theranostics. .

Abstract

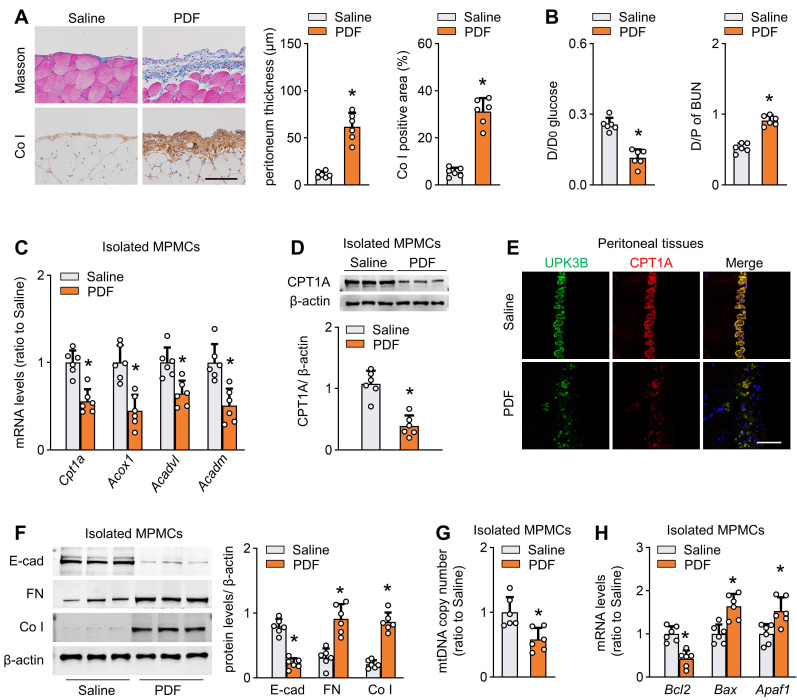
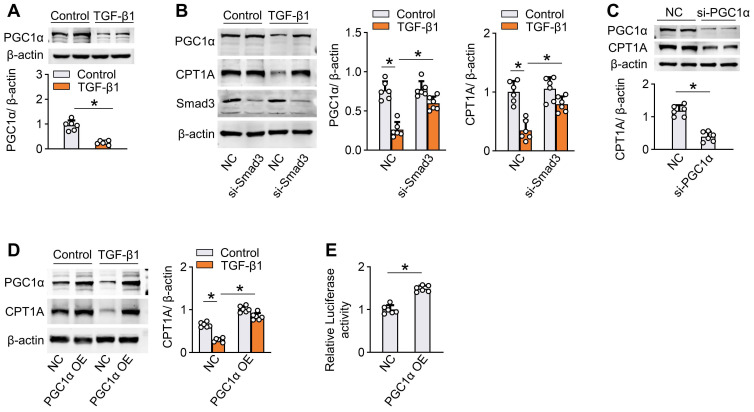
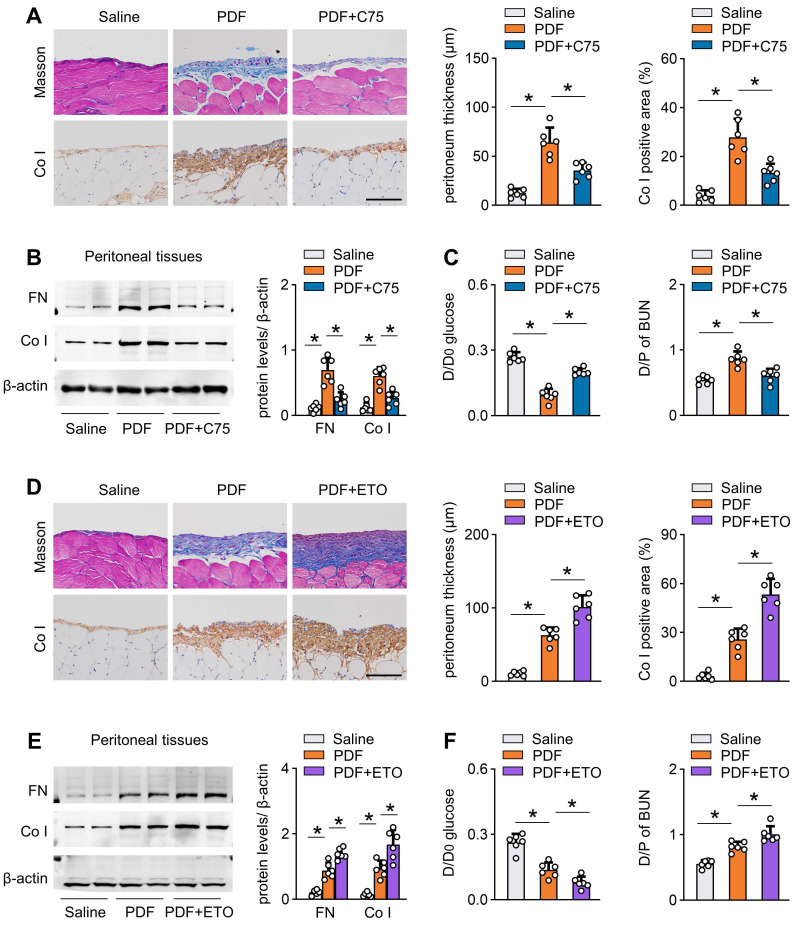
Background: Peritoneal dialysis (PD) is limited by gradual fibrotic remodeling in the peritoneum, a process involving profibrotic response of mesothelial cells. However, the role of fatty acid oxidation (FAO) and carnitine palmitoyltransferase 1A (CPT1A) in this process remains unexplored. Methods: FAO and CPT1A expression were characterized in mesothelial cells from patients on long-term PD and from a mouse model of PD using multiple experimental methods, including single-cell sequencing, seahorse assay, real-time quantitative PCR, Western blot, and immunofluorescence staining. Overexpression of CPT1A was achieved in a human mesothelial cell line and in primary mouse mesothelial cells. Finally, genetic and pharmacological manipulations of CPT1A were performed in a mouse model of PD. Results: Herein, FAO and CPT1A expression were reduced in mesothelial cells from patients on long-term PD, which negatively correlated with expression of fibrogenic markers in these cells. This was corroborated in PD mice, as well as in mouse and human mesothelial cells incubated with transforming growth factor (TGF) β1. CPT1A overexpression in mesothelial cells, which prevented TGFβ1-induced suppression of mitochondrial respiration, restored cellular ATP levels and downregulated the expression of fibrogenic markers. Furthermore, restoration of FAO by overexpressing CPT1A in PD mice reversed profibrotic phenotype in mesothelial cells and reduced fibrotic lesions in the peritoneum. Treatment with the CPT1A activator C75 induced similar therapeutic benefit in PD mice. In contrast, inhibition of FAO with a CPT1 inhibitor caused more severe fibrosis in PD mice. Conclusions: A defective FAO is responsible for the profibrotic response of mesothelial cells and thus the peritoneal fibrogenesis. This aberrant metabolic state could be improved by modulating CPT1A in mesothelial cells, suggesting FAO enhancement in mesothelial cells is a potential treatment of peritoneal fibrosis.

Keywords: carnitine palmitoyltransferase 1A; fatty acid oxidation; mesothelial cell; peritoneal dialysis; peritoneal fibrosis.


Conflict of interest statement

Competing Interests: The authors have declared that no competing interest exists.

Figures

Figure 1
Figure 1
Reduction of FAO in mesothelial cells characterizes patients on long-term PD. (A) Uniform manifold approximation and projection (UMAP) shows overview of the cell clusters in the integrated single-cell transcriptomes derived from the effluent of patients on long-term PD (LT-PD, n = 4) and the normal peritoneum (normal, n = 3) using scRNA-seq data GSE130888. (B) Gene ontology analysis of mesothelial cells from patients on LT-PD and the normal peritoneum. The graph shows adjusted P values for the enrichment of a specific pathway. (C) GSEA plots demonstrating enrichment score (ES) of gene sets in the scRNA-seq data of mesothelial cells. Genes in each gene set are ranked by signal-to-noise ratio according to their differential expression between normal mesothelial cells and the long-term PD group. FDR: false discovery rate. (D) Heat map showing the expression of key FAO enzymes in mesothelial cells of normal and LT-PD groups. (E) Ordering of scRNA-seq expression data of peritoneal mesothelial cells according to the pseudotime produced by Monocle 3 package. Expression of epithelial marker, fibrotic marker, and FAO-related genes demonstrated along the trajectory. (F) Transcript levels of key FAO enzymes in human peritoneal mesothelial cells (HPMCs) isolated from normal and LT-PD group. Unpaired t test, *P < 0.05 versus normal group. (G) Transcript levels of CPT1B and CPT1C in isolated HPMCs. Unpaired t test. *P < 0.05 versus normal group. (H) Protein levels of CPT1A, E-cadherin (E-cad), fibronectin (FN) and collagen I (Co I) in isolated HPMCs. Unpaired t test, *P < 0.05 versus normal group. (I) Correlation analyses between transcript expression of CPT1A and fibrogenic markers in HPMCs. Spearman's correlation. Data expressed as mean ± SD in F-H (n = 6 in normal group and n = 12 in LT-PD group).
Figure 2
Figure 2
Reduction of FAO in mesothelial cells characterizes mice with peritoneal fibrosis. The mouse PD model of peritoneal fibrosis was induced by daily intraperitoneal injection of 4.25% PD fluid (PDF) for 6 weeks. Sham-operated mice were subject to daily intraperitoneal injection of saline for 6 weeks. (A) Peritoneal fibrosis, presented by Masson's trichrome staining and Co I staining: representative images and quantitative data. Scale bar, 100 μm. Unpaired t test. *P < 0.05 versus saline group. (B) Peritoneal permeability of glucose (D/D0) and blood urea nitrogen (BUN) (D/P) examined by modified peritoneal equilibration test. Unpaired t test. *P < 0.05 versus saline group. (C) Transcript levels of key FAO enzymes in isolated mouse peritoneal mesothelial cells (MPMCs). Unpaired t test. *P < 0.05 versus saline group. (D) CPT1A protein levels in isolated MPMCs. Unpaired t test. *P < 0.05 versus saline group. (E) Immunofluorescence staining for uroplakin 3B (UPK3B) and CPT1A in peritoneal tissues. (F) Protein levels of E-cad, FN and Co I in isolated MPMCs. Unpaired t test. *P < 0.05 versus saline group. (G) mtDNA copy number in isolated MPMCs. Unpaired t test. *P < 0.05 versus saline group. (H) Transcript levels of apoptosis markers in isolated MPMCs. Unpaired t test. *P < 0.05 versus saline group. Data expressed as mean ± SD in A-D, F-H (n = 6 in each group).
Figure 3
Figure 3
TGF-β1 decreases FAO and promotes profibrotic phenotype in primary peritoneal mesothelial cells. (A) Protein levels of E-cad, FN and Co I in primary MPMCs treated with or without TGF-β1. Unpaired t test. *P < 0.05 versus control (PBS). (B) Transcript levels of FN and Co I in primary MPMCs treated with or without TGF-β1. Unpaired t test. *P < 0.05 versus control. (C) Transcript levels of key FAO enzymes in primary MPMCs treated with or without TGF-β1. Unpaired t test. *P < 0.05 versus control. (D) CPT1A protein level in primary MPMCs treated with or without TGF-β1. Unpaired t test. *P < 0.05 versus control. (E) Oxygen consumption rate (OCR) measurement of Mito Stress assay in primary MPMCs. Where indicated, cells are pretreated with palmitate-BSA FAO substrate (Palm:BSA, 30 μL) or the CPT1 inhibitor etomoxir (Eto, 4 μM). One-way ANOVA with Bonferroni correction. *P < 0.05. (F) OCR measurement in primary MPMCs treated with or without TGF-β1. Unpaired t test. *P < 0.05 versus control. (G) Quantification of ECAR measurement in F. Unpaired t test. *P < 0.05 versus control. (H) ATP levels in primary MPMCs treated with or without TGF-β1. Unpaired t test. *P < 0.05 versus control. (I) Transcript levels of mitochondrial biogenesis-associated genes in primary MPMCs treated with or without TGF-β1. Unpaired t test. *P < 0.05 versus control. (J) Representative images of MitoSOX staining in primary MPMCs treated with or without TGF-β1. Scale bar, 50 μm. Data expressed as mean ± SD in A-I (n = 6 in each group).
Figure 4
Figure 4
TGF-β1 downregulates CPT1A via a SMAD3/PGC-1α pathway in mesothelial cells. (A) Incubation of Met-5A cells with TGF-β1 for 24 h downregulates the protein level of PGC1α. Unpaired t test, *P < 0.05. (B) Knockdown of Smad3 in Met-5A cells is achieved by transfecting cells with siRNA targeted to Smad3 (si-Smad3). Transfection of Met-5A cells with si-Smad3 (versus negative control, NC) reverses the ability of TGF-β1 to reduce the expression of PGC-1α and CPT1A. One-way ANOVA with Bonferroni correction, *P < 0.05. (C) Knockdown of PGC-1α by si-PGC1α in Met-5A cells downregulates the expression of CPT1A. (D) Overexpression of PGC-1α in Met-5A cells is achieved by transfecting cells with pcDNA3.1-PGC1α plasmids (PGC-1α OE). Transfection of Met-5A cells with PGC-1α OE (versus pcDNA3.1 empty vector, NC) reverses the ability of TGF-β1 to reduce the expression of CPT1A. One-way ANOVA with Bonferroni correction, *P < 0.05. (E) Luciferase activity in Met-5A cells transfected with PGC-1α OE. Unpaired t test, *P < 0.05. Data expressed as mean ± SD in A-E (n = 6 in each group).
Figure 5
Figure 5
Restoration of CPT1A expression reverses TGF-β1-induced FAO suppression and profibrotic phenotype in primary peritoneal mesothelial cells. Primary MPMCs are transfected with either adenovirus carrying CPT1A (Ad-CPT1A) or negative control (Ad-NC). (A) Immunoblots showing upregulation of CPT1A in MPMCs transfected with Ad-CPT1A. Unpaired t test, *P < 0.05. (B and C) Transfection of MPMCs with Ad-CPT1A (versus Ad-NC) increases the FAO-associated OCR (B) and elevates ATP levels (C). One-way ANOVA with Bonferroni correction. *P < 0.05. (D and E) Overexpression of CPT1A in MPMCs does not alter ECAR (D) and glycolysis-related genes expression (E). One-way ANOVA with Bonferroni correction in D and Kruskal-Wallis test in E. *P < 0.05. ns, no significance. (F-I) MPMCs overexpressing CPT1A are protected from TGF-β1-induced detrimental changes, including induction of profibrotic marker expression (F), mitochondrial DNA copy number (G), level of apoptosis-associated genes (H), and mitochondrial superoxide generation (I; Scale bar, 50 μm). One-way ANOVA with Bonferroni correction, *P < 0.05. Data expressed as mean ± SD in A-D, F-H, and median with IQR in E (n = 6 in each group).
Figure 6
Figure 6
Restoration of CPT1A expression improves FAO and protects against fibrosis in mouse peritoneum. (A) Outline of experimental protocol: Restoration of CPT1A in mesothelial cells in PD mice is achieved by injecting AAV-CPT1A-GFP (CPT1A OE) into peritoneal cavity of mice 21 days before daily PDF treatment. (B) Representative images show immunostaining of UPK3B and GFP in peritoneum of mouse treated with AAV-GFP. Scale bar, 100μm. (C) CPT1A protein level and transcript level in isolated MPMCs. Unpaired t test, *P < 0.05. (D) Peritoneal fibrosis, presented by Masson's trichrome staining and Co I staining in mice: representative images and quantitative data. Scale bar, 100 μm. One-way ANOVA with Bonferroni correction. *P < 0.05. (E) Transcript level of Co I in peritoneal tissues. One-way ANOVA with Bonferroni correction. *P < 0.05. (F) Peritoneal permeability of glucose (D/D0) and BUN (D/P) examined by modified peritoneal equilibration test. One-way ANOVA with Bonferroni correction. *P < 0.05. (G) Protein levels of E-cad, FN and Co I in isolated MPMCs. One-way ANOVA with Bonferroni correction. *P < 0.05. (H) Representative images show MitoSOX staining in mouse peritoneal tissues. Scale bar, 50 μm. (I) mtDNA copy number in isolated mouse peritoneal mesothelial cells. One-way ANOVA with Bonferroni correction. *P < 0.05. (J) Transcript levels of mitochondrial biogenesis-associated genes in isolated MPMCs. One-way ANOVA with Bonferroni correction. *P < 0.05. (K) Protein levels of cleaved capase3 (C-casp3) and casp3 in isolated MPMCs. (L) Transcript levels of apoptosis markers in isolated MPMCs. One-way ANOVA with Bonferroni correction. *P < 0.05. Data expressed as mean ± SD in C-G and I-L (n = 6 in each group).
Figure 7
Figure 7
Pharmacological improvement of FAO protects against fibrosis in mouse peritoneum. (A-C) Pharmacological improvement of FAO is achieved by intraperitoneal injection of mice with C75 three times per week starting 1 day after PDF treatment. Peritoneal fibrosis, presented by Masson's trichrome staining and Co I staining in mice: representative images and quantitative data; Scale bar, 100 μm (A). Protein levels of FN and Co I in mouse peritoneal tissues (B). Peritoneal permeability of glucose (D/D0) and BUN (D/P) examined by modified peritoneal equilibration test (C). One-way ANOVA with Bonferroni correction. *P < 0.05. (D-F) Pharmacological inhibition of FAO is achieved by intraperitoneally injecting mice with etomoxir three times per week starting 1 day after PDF treatment. Peritoneal fibrosis, presented by Masson's trichrome staining and Co I staining in mice: representative images and quantitative data; Scale bar, 100 μm (D). Protein levels of FN and Co I in mouse peritoneal tissues (E). Peritoneal permeability of glucose (D/D0) and BUN (D/P) examined by modified peritoneal equilibration test (F). One-way ANOVA with Bonferroni correction. *P < 0.05. Data expressed as mean ± SD in A-F (n = 6 in each group).
Figure 8
Figure 8
Schematic diagram summarizing a novel role for disrupted FAO of mesothelial cells in the development of peritoneal fibrosis during long-term PD. We demonstrate a defective FAO in mesothelial cells from both patients on long-term PD and from experimental PD mice with peritoneal fibrosis. The reduction in FAO induces a profibrotic phenotype in these cells, which contributes to the mitochondrial dysfunction and development of peritoneal fibrosis. Improving FAO by restoration of CPT1A expression in mesothelial cells impairs their transition toward profibrotic phenotype, thereby lessening the peritoneal fibrosis in the experimental PD mice.

Similar articles

Cited by

References

    1. Cho Y, Bello AK, Levin A, Lunney M, Osman MA, Ye F. et al. Peritoneal Dialysis Use and Practice Patterns: An International Survey Study. Am J Kidney Dis. 2021;77:315–25. - PubMed
    1. Teitelbaum I. Peritoneal Dialysis. N Engl J Med. 2021;385:1786–95. - PubMed
    1. Cho Y, Johnson DW. PD Solutions and Peritoneal Health. Clin J Am Soc Nephrol. 2018;13:1455–7. - PMC - PubMed
    1. Brimble KS, Walker M, Margetts PJ, Kundhal KK, Rabbat CG. Meta-analysis: peritoneal membrane transport, mortality, and technique failure in peritoneal dialysis. J Am Soc Nephrol. 2006;17:2591–8. - PubMed
    1. Devuyst O, Margetts PJ, Topley N. The pathophysiology of the peritoneal membrane. J Am Soc Nephrol. 2010;21:1077–85. - PubMed

Publication types

Substances