. 2023 Jul 31;13(13):4316-4332.
doi: 10.7150/thno.82907. eCollection 2023.

Erythroid-transdifferentiated myeloid cells promote portal vein tumor thrombus in hepatocellular carcinoma

Affiliations

Erythroid-transdifferentiated myeloid cells promote portal vein tumor thrombus in hepatocellular carcinoma

Wei-Hang Zhu et al. Theranostics. .

Abstract

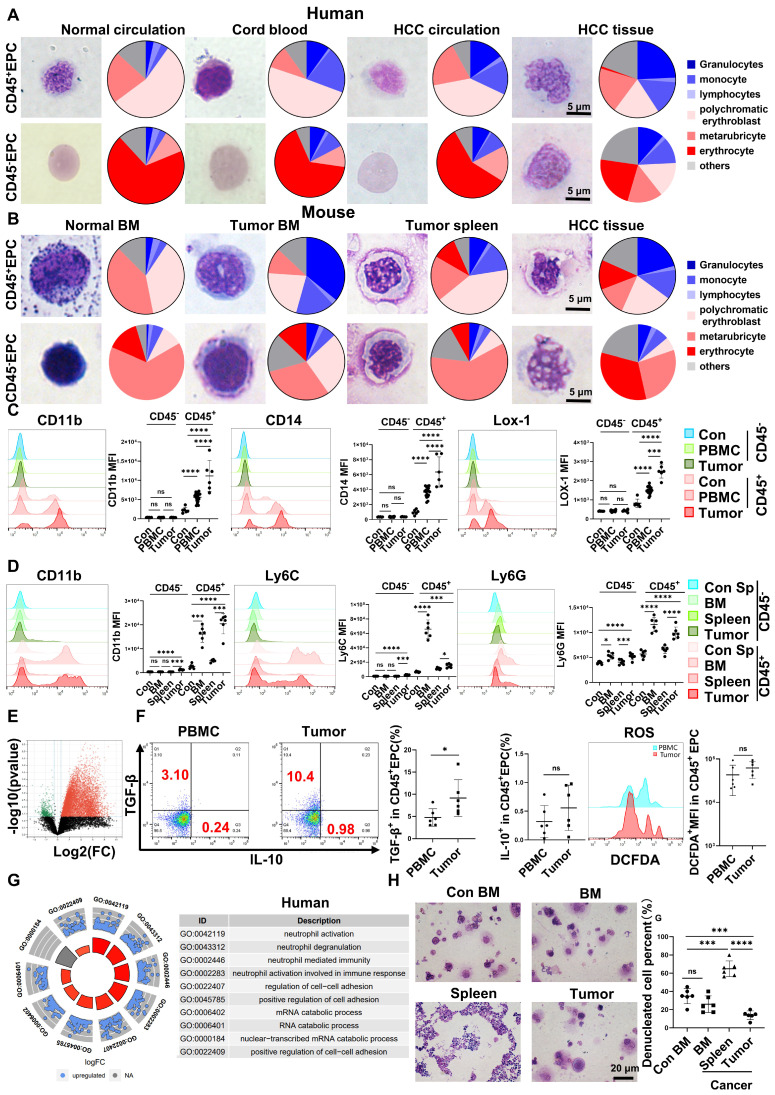
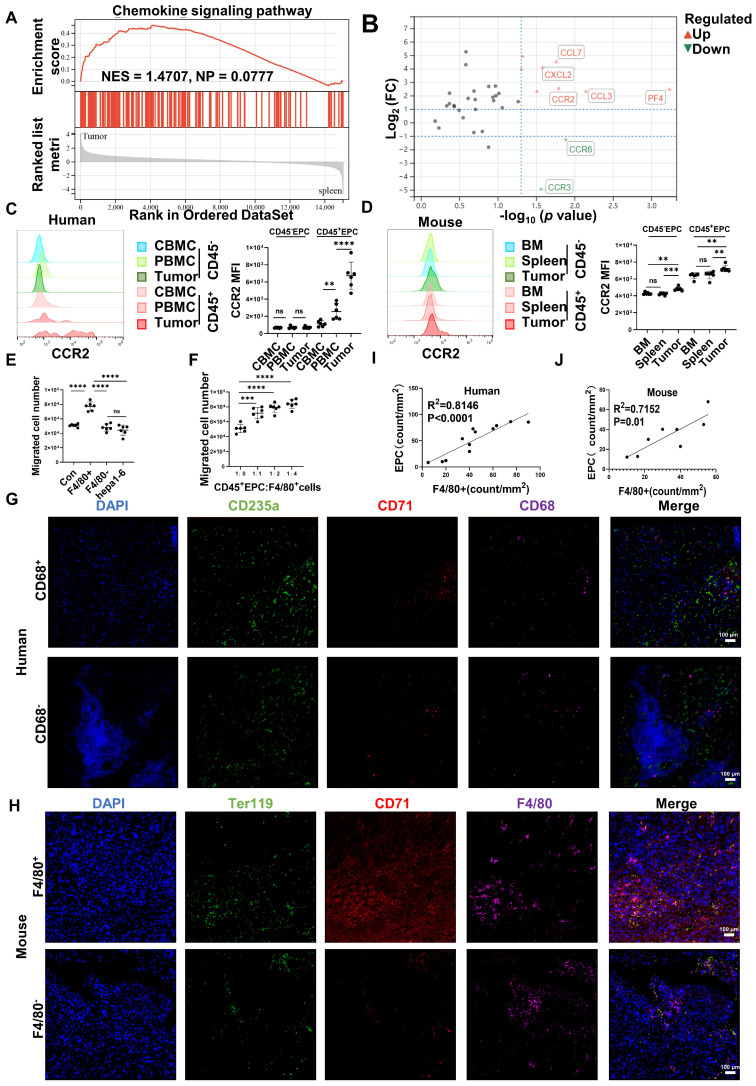
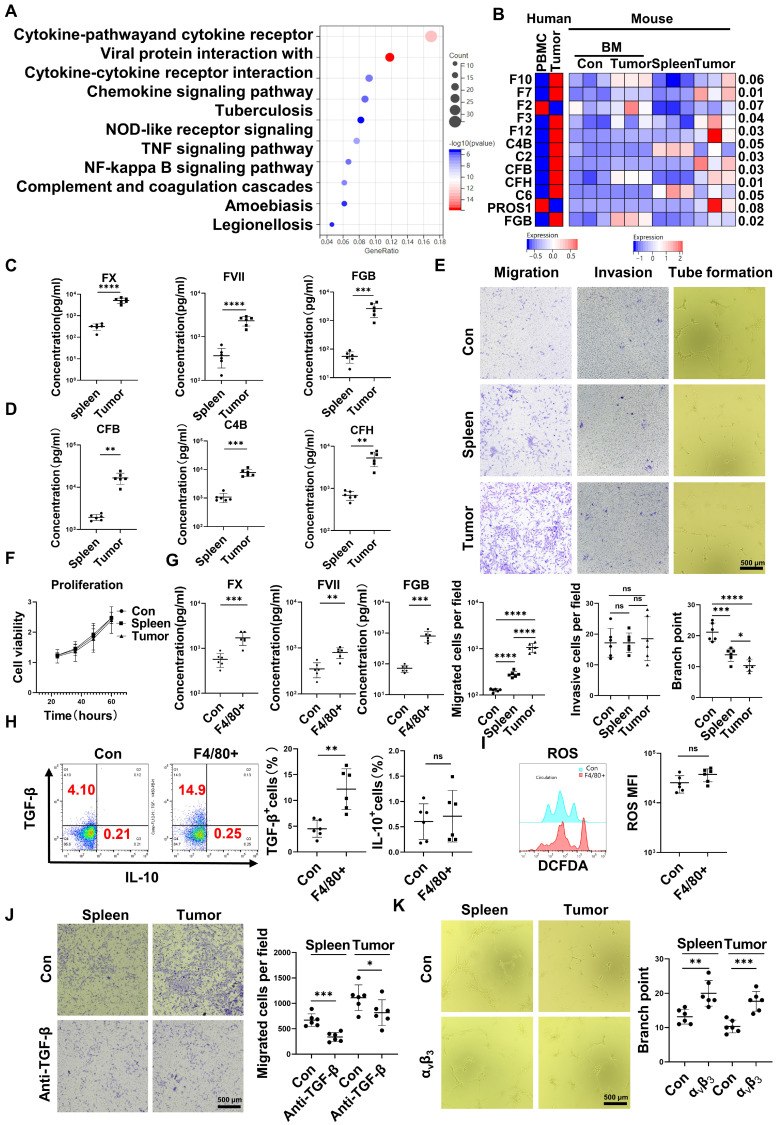
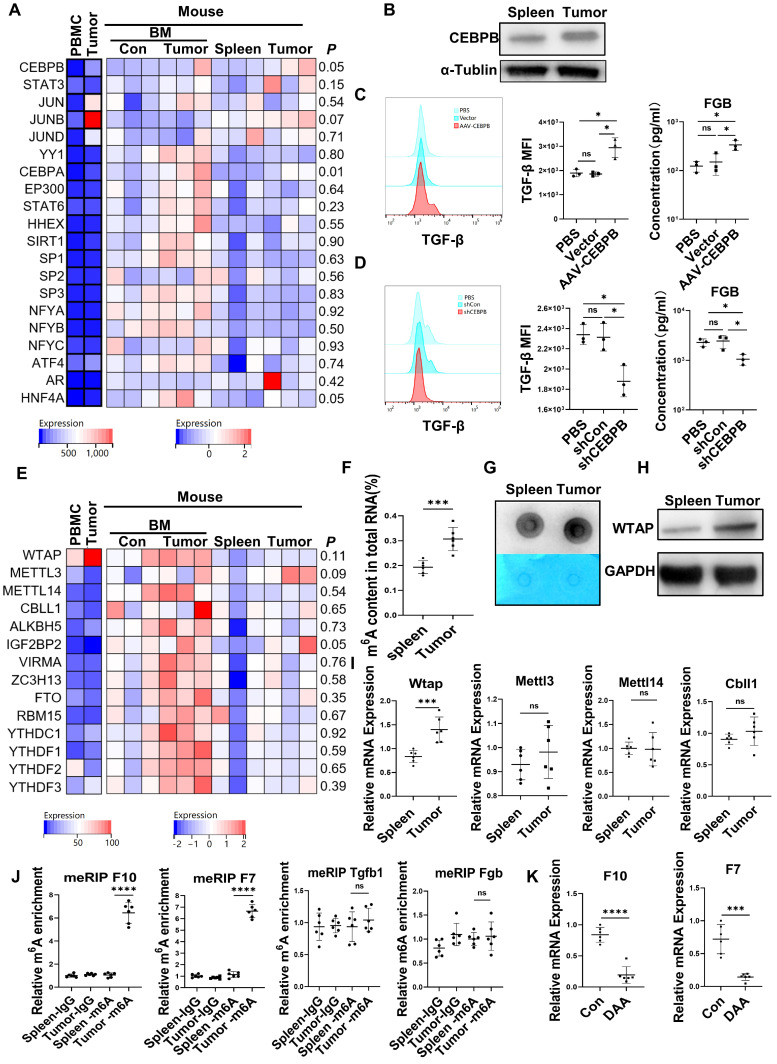
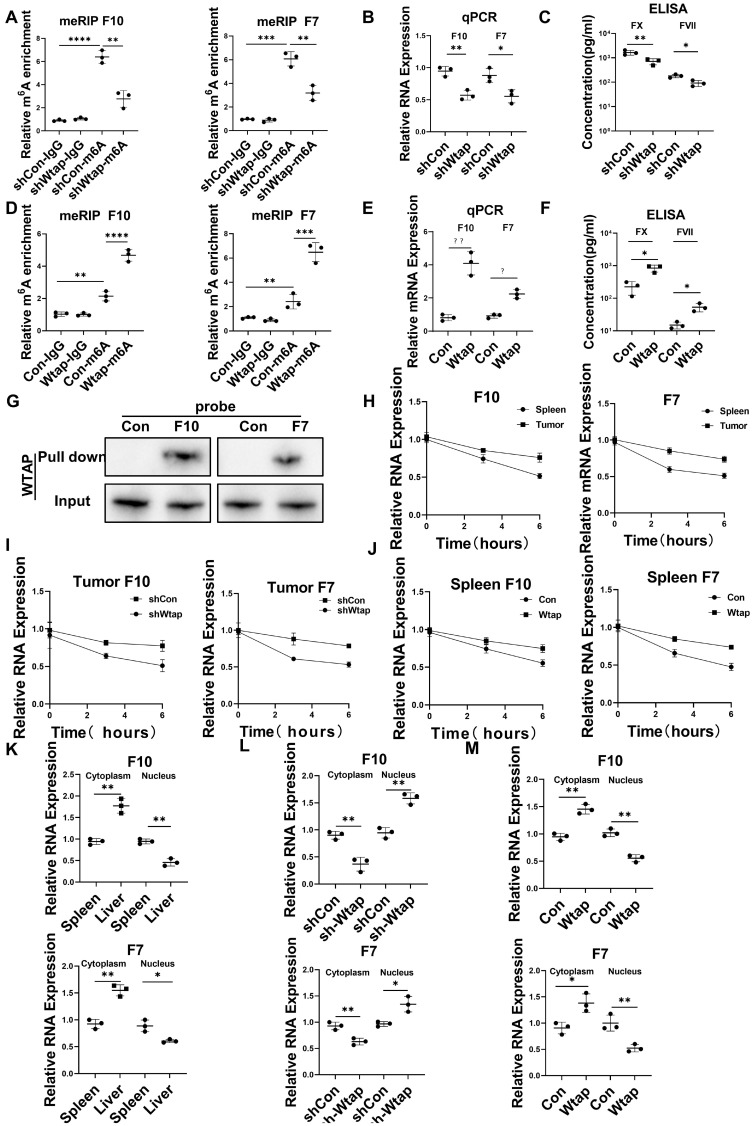
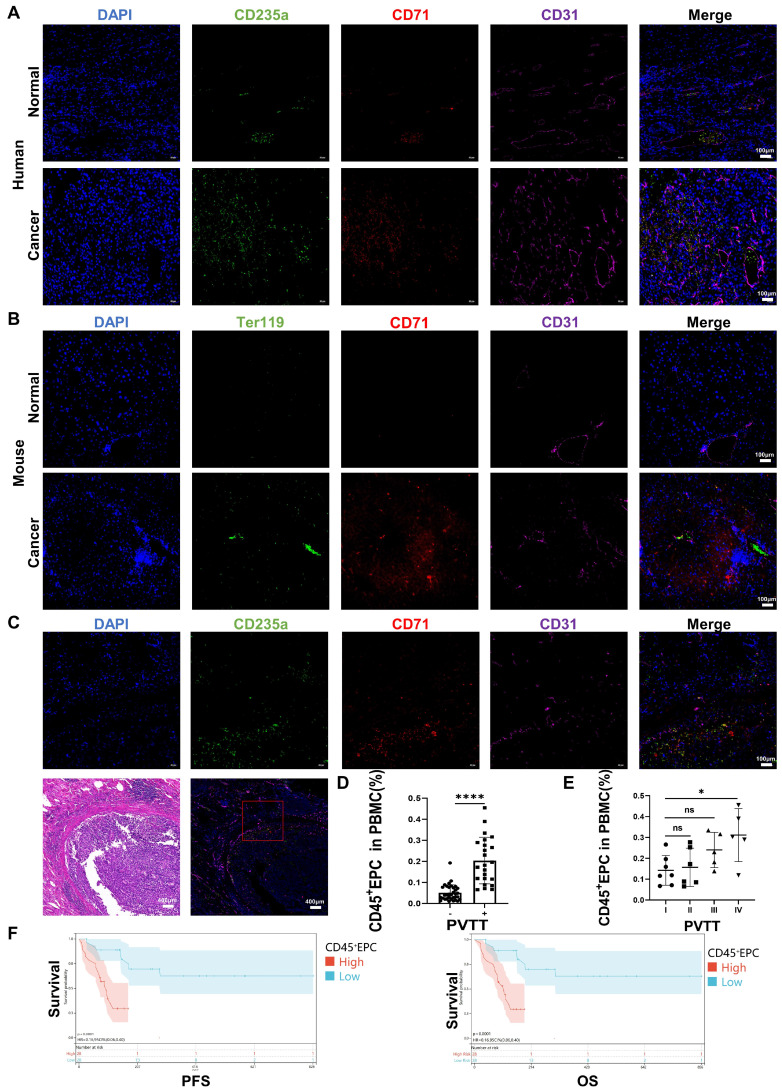
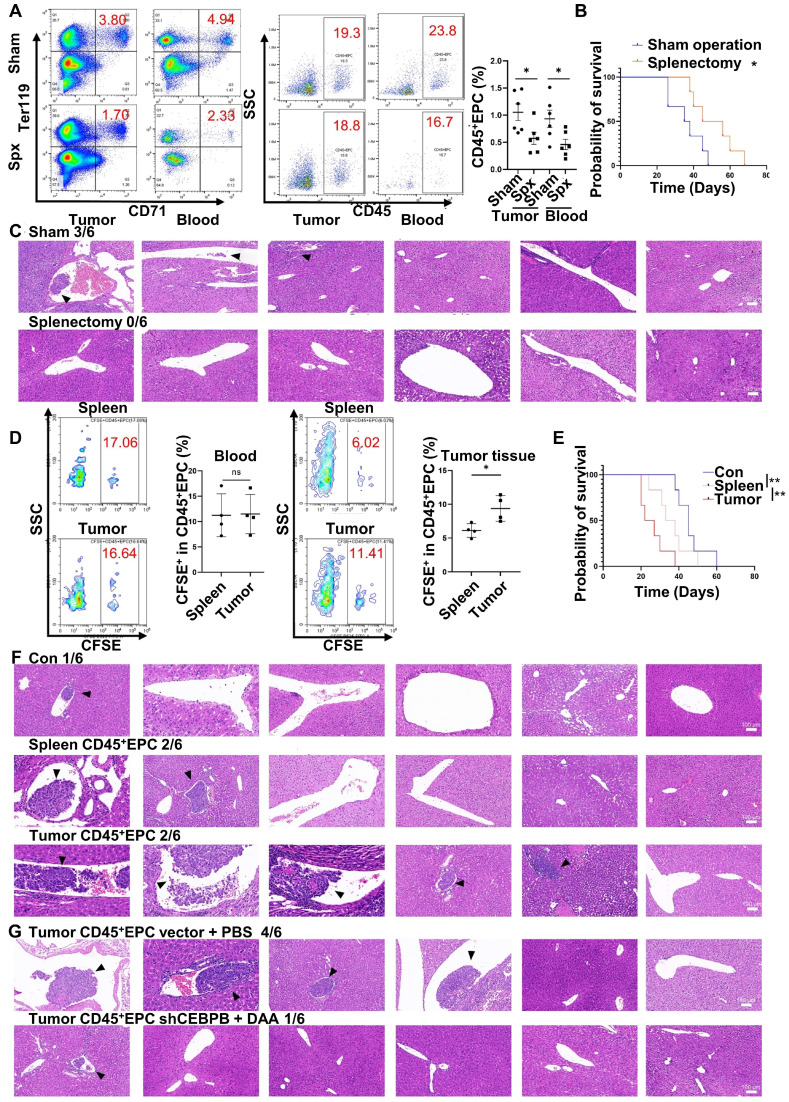
Rationale: Hepatocellular carcinoma (HCC) is primarily characterized by a high incidence of vascular invasion. However, the specific mechanism underlying portal vein tumor thrombus (PVTT) in HCC remains unclear. As a consequence of myeloid cell developmental arrest, CD71+ erythroid progenitor cells (EPCs) and myeloid-derived suppressor cells play important roles in HCC; however, their roles in PVTT remain unclear. Methods: The role of CD71+ EPCs in the HCC tumor microenvironment (TME) was evaluated via morphological, RNA-sequencing, enzyme-linked immunosorbent assay, and flow cytometric analyses. Co-culture techniques were employed to assess the CD45+ EPCs and their vascular compromising effect. Additionally, the PVTT-promoting function of CD45+ EPCs was explored in vivo in a murine model. Results: The CD45+EPCs in HCC tissues exhibited increased myeloid cell features, including morphology, surface markers, transforming growth factor (TGF)-β generation, and gene expression, compared with those in circulation. Hence, a large proportion of CD45+EPCs, particularly those in TMEs, comprise erythroid-transdifferentiated myeloid cells (EDMCs). Additionally, the expression of C-C chemokine receptor type 2 (CCR2) mRNA was upregulated in CD45+EPCs within the TME. Tumor macrophages from HCC tissues induced substantial migration of CD45+EPCs in a dose-dependent manner. Meanwhile, results from immunofluorescence analyses revealed that these two cell types are positively associated in the TME and circulation. That is, EDMCs are chemoattracted by HCC macrophages mainly via CCR2 from CD45+ EPCs in the circulation. Additionally, the expressions of FX, FVII, FGB, C4b, CFB, and CFH were elevated in CD45+EPCs within the TME compared with those in the spleen. The CD45+EPCs from the HCC TME promoted vessel endothelial cell migration and compromised tube formation through TGF-β and FGB, respectively. Additionally, CD45+EPCs from the TME induced HCC cell migration. HCC macrophage-induced CD45+EPCs to exhibit higher levels of FX, FVII, FGB, and TGF-β. Meanwhile, upregulation of CCAAT/enhancer binding protein beta expression induced FGB and TGF-β generation in CD45+EPCs in the TME. WTAP, a major RNA m6A writer, stabilized FX and FVII mRNA and enhanced their nuclear export in CD45+EPCs from the TME. CD45+EPCs from the TME were positively associated with PVTT and poor prognosis. Splenectomy reduced the level of CD45+EPCs in the circulation and TME, as well as the incidence of microvascular invasion. The incidence of microvascular invasion increased following the transfer of HCC tissue CD45+EPCs to splenectomized HCC-bearing mice. Conclusions: The CD45+EPCs enriched in the HCC microenvironment are EDMCs, which are induced by HCC macrophages to migrate from the circulation to the TME. Subsequently, EDMCs promote PVTT by compromising the blood vessel endothelium, aggravating coagulation, and promoting HCC cell migration.

Keywords: CD45+ EPC; Coagulation; Hepatocellular carcinoma; Portal vein tumor thrombus; Vascular endothelial cells.


Conflict of interest statement

Competing Interests: The authors have declared that no competing interest exists.

Figures

Figure 1
Figure 1
Erythroid progenitor cells (EPCs) enriched in the hepatocellular carcinoma (HCC) microenvironment were erythroid-transdifferentiated myeloid cells (EDMCs). (A, B) Wright-Giemsa staining of CD45+EPCs and CD45-EPCs from the circulation of healthy donor, cord blood of healthy infants, and circulation and HCC tissues of HCC patients (A), as well as those in bone marrow (BM) of tumor-free mice and BM, spleen, and HCC tissues of tumor-bearing mice (B). Cells were classified according to their morphology with the proportion of each cell type illustrated in a pie chart. (C) Representative and statistical analysis of cumulative fluorescence intensity (MFI) of human MDSC markers (CD11b, CD14, and LOX-1) on CD45-EPCs and CD45+EPCs from cord blood mononuclear cells (CBMCs) (n = 6), peripheral blood mononuclear cells (PBMCs) (n = 19) and tumor tissues (n = 6) of HCC patients, CBMCs were the control. (D) Representative and statistical analysis of MFI of mouse MDSC markers (CD11b, Ly6C, and Ly6G) on CD45-EPCs and CD45+EPCs from the spleen of tumor-free mice, and BM, spleen and HCC tissues of tumor-bearing mice. Spleens of tumor-free mice were the control. (E) Whole-transcriptome analysis using RNA-seq was conducted on CD45-EPCs and CD45+EPCs from three samples of HCC tissues from tumor-bearing mice. Volcano plots displaying differentially expressed genes with red dots represent the upregulated expressed transcripts (p < 0.05, [log2 fold change] > 1) and green dots represent the transcripts whose expression downregulated (p < 0.05, [log2 fold change] > 1). (F) Representative and statistical analysis of flow cytometer analysis of TGF-β, IL-10, and ROS (tested by DCFDA) on CD45+EPCs from PBMC (n = 6) and tumor tissues (n = 6) of HCC patients. (G) Gene ontology analysis of differentially expressed genes between CD45+EPCs from the circulation and tumor tissue in one patient with HCC. (H) Typical figure illustrated by Wright-Giemsa staining and statistical analysis of denucleated red cells induced by erythropoietin from CD45+EPCs from BM, spleen or tumor tissues of tumor-bearing mice and BM of tumor-free mice in erythroid cell development culture system in vitro. ****p < 0.0001; ***p < 0.001; **p < 0.01; *p < 0.05. con: control; DCFDA: 2′,7′-dichlorofluorescein diacetate; IL: interleukin; ns: non-significant; ROS: reactive oxygen species; TGF: transforming growth factor.
Figure 2
Figure 2
CD45+ erythroid progenitor cells (EPCs) were chemoattracted by hepatocellular carcinoma (HCC) macrophages through C-C chemokine receptor type 2 (CCR2). (A) Gene set enrichment analysis of the chemokine signaling pathway among CD45+EPCs from spleen and tumor tissues of tumor-bearing mice. (B) Volcano plots displaying differentially expressed genes associated with chemokine signals. Red dots represent the upregulated expressed transcripts (p < 0.05, log2 fold change>1), and green dots represent the downregulated expressed transcripts (p < 0.05, log2 fold change>1). (C) Representative and statistical analysis of the cumulative fluorescence intensity (MFI) of CCR2 on CD45-EPCs and CD45+EPCs from cord blood mononuclear cells (CBMCs), peripheral blood mononuclear cells (PBMCs) (n = 6), and tumor tissues (n = 6) from HCC patients. (D) Representative and statistical analysis of MFI of CCR2 on CD45-EPCs and CD45+EPCs from bone marrow, spleen and tumor tissues (n = 6) of orthotopic HCC tumor-bearing mice. (E, F) Cell migration assay. After 24 h of serum starving, CD45+EPCs from spleen of tumor-bearing mice (5×10⁵/mL) were suspended in serum-free medium and seeded in the upper chamber. Media containing 10% FBS (v/v) was placed into the lower chamber, as well as indicated cells in Matrigel matrix glue in indicated ratios. After 24 h, cells that had migrated into the medium of the low chamber were evaluated. Representative of one independent experiment, cumulative data are shown (n = 6). (G-J) Immunofluorescence staining of tumor. Paraffin tissue sections of human (CD71, red; CD235a, green; CD68, purple, DAPI, blue) and mouse (CD71, red; Ter119, green; F4/80, purple, DAPI, blue) HCC samples. Linear regression of the abundance of CD71+CD235a+ cells and macrophages was conducted. ns: non-significant ****p < 0.0001; ***p < 0.001; **p < 0.01.
Figure 3
Figure 3
CD45+ erythroid progenitor cells (EPCs) compromised vascular endothelial cells and promoted local coagulation. (A) Kyoto Encyclopedia of Genes and Genomes pathway analysis of CD45+EPCs from spleen and tumor tissue of hepatocellular carcinoma (HCC) tumor-bearing mice. (B) Expression of complement- and coagulation-related genes in CD45+EPCs from peripheral blood mononuclear cells (PBMCs) and tumor tissue from one large tumor HCC patient, bone marrow from three tumor-free mouse and three tumor-bearing mouse, and spleen and orthotopic HCC tissue from three tumor-bearing mice, illustrated by RNA-seq. (C, D) ELISAs of FX, FVII, fibrinogen β chain (FGB), complement factor B (CFB), C4b, and complement factor H (CFH), in the conditioned media of CD45+EPCs from spleen and HCC tissue of tumor-bearing mice. (E) Cell migration and invasion assay: After 24 h of serum starving, 2×10⁴ endothelial cells (ECs) were suspended in serum-free medium and seeded in the upper chamber. Media containing 20% (v/v) FBS was placed into the lower chamber, as well as CD45+EPCs from the spleen of tumor-free mice, and the spleen and tumor tissue of tumor-bearing mice. After 24 h (migration tests) or 72 h (invasion tests), cells adhered to the lower surface were evaluated. Tube formation assay: 1×10⁵ ECs were cultured with conditioned medium of CD45+EPC from the spleen of tumor-free mice and the spleen and tumor tissue of tumor-bearing mice for 12 h. Representative of one independent experiment, cumulative data are shown (n = 6). (F) Cell counting kit-8 (CCK8) analysis: ECs were cocultured with CD45+EPCs from above sources; 24, 36, 48, and 60 h post seeding, CD45+EPCs were washed and CCK8 analysis was conducted. Representative of one independent experiment, cumulative data are shown (n = 6). (G) ELISAs of FX, FVII, and FGB of the conditioned media of macrophage chemoattracted CD45+EPCs and CD45+EPC not being chemoattracted by macrophage. (H, I) Representative and statistical analysis of flow cytometric analysis of TGF-β, IL-10, and ROS on macrophage chemoattracted CD45+EPCs and CD45+EPCs not being chemoattracted by macrophage. (J) Neutralizing antibody of TGF-β (10 μg/mL) and CD45+EPCs from spleen or tumor tissue of tumor-bearing mice were administered into the lower chamber with ECs in the upper chamber. Migration of ECs was evaluated. (K) 1×10⁵ ECs were cultured with conditioned medium of CD45+EPC from the spleen and tumor tissue of tumor-bearing mice for 12 h. αvβ3 (10 μg/mL) was added, and tube formation assay conducted. Representative of one independent experiment, cumulative data are shown (n = 6). ****p < 0.0001; ***p < 0.001; **p < 0.01; *p < 0.05. con: control; DCFDA: 2′,7′-dichlorofluorescein diacetate; IL: interleukin; ns: non-significant; ROS: reactive oxygen species; TNF: tumor necrosis factor; TGF: transforming growth factor.
Figure 4
Figure 4
Upregulation of CCAAT/enhancer binding protein beta (C/EBPβ) and m6A induced the generation of FX, FVII, fibrinogen β chain (FGB), and TGF-β of CD45+ erythroid progenitor cells (EPCs) in the tumor microenvironment. (A) The expression of transcription factors of FX, FVII, FGB and TGF-β in CD45+EPCs from peripheral blood mononuclear cell (PBMC) and tumor tissue of one large tumor hepatocellular carcinoma (HCC) patient, bone marrow (BM) of three tumor-free mouse and three tumor-bearing mouse, and spleen and orthotopic HCC tissue of three tumor-bearing mice illustrated by RNA-seq. (B) Western blot of C/EBPβ in CD45+EPCs from spleen and HCC tissue of tumor-bearing mice. (C) AAV-CEBPB overexpression or AAV empty vectors were administered CD45+EPCs from the spleen of tumor-bearing mice. Intracellular TGF-β abundance was assessed using flow cytometry, while supernatant fibrinogen β chain (FGB) was quantified using ELISA. (D) Cebpb shRNA was administered to CD45+EPCs from tumor tissues and the abundances of TGF-β and FGB were evaluated. (E) Expression of m6A methylation-related genes in CD45+EPCs from PBMC and tumor tissue of one HCC patient, BM of three tumor-free mouse and three tumor-bearing mouse, and spleen and orthotopic HCC tissue of three tumor-bearing mice illustrated by RNA-seq. (F, G) m6A RNA methylation quantification (F) and m6A dot blot test (G) of CD45+EPCs from spleen and HCC tissue of tumor-bearing mice. (H) Western blot of Wtap of CD45+EPCs from spleen and HCC tissue of tumor-bearing mice. (I) qRT-PCR test of Wtap, Mettl3, Mettl14 and Cbll1 of CD45+EPCs from spleen and HCC tissue of tumor-bearing mice. (J) qRT-PCR of FX, FVII, Fgb, and Tgfb1 after MeRIP of CD45+EPCs from spleen and HCC tissue of tumor-bearing mice. (K) qRT-PCR of FX, FVII, Fgb, and Tgfb1 of CD45+EPCs from HCC tissues from tumor-bearing mice with or without 3-deazaadenosine (DAA) treatment. ns = non-significant. ****p < 0.0001; ***p < 0.001; *p < 0.05. con: control; Ig: immunoglobulin; ns: non-significant; PBS: phosphate buffered saline; TGF: transforming growth factor.
Figure 5
Figure 5
Wtap stabilized the mRNA of F10 and F7 and enhanced their nuclear export in CD45+ erythroid progenitor cells (EPCs) from the tumor microenvironment. (A) qRT-PCR of F10 and F7 after methylated RNA immune precipitation (MeRIP) in CD45+EPCs from mouse hepatocellular carcinoma (HCC) tissues pretreated with shRNA of Wtap. (B, C) qRT-PCR (B) and ELISA (C) of FX and FVII in CD45+EPCs from mouse HCC tissue pretreated with shRNA of Wtap. (D) qRT-PCR of FX and FVII after MeRIP in CD45+EPCs from the spleen of tumor-bearing mice overexpressed Wtap. (E, F) qRT-PCR (E) and ELISA (F) of FX and FVII in CD45+EPCs of tumor-bearing mice overexpressed Wtap. (G) Validation of FX and FVII mRNA interaction with Wtap protein. (H) qRT-PCR of F10 and F7 in CD45+EPCs from spleen and HCC tissue of tumor-bearing mice under the treatment of actinomycin D at different times. (I) qRT-PCR test of F10 and F7 in CD45+EPCs from tumor tissue pretreated with shRNA of Wtap under the treatment of actinomycin D at different times. (J) qRT-PCR of FX and FVII in CD45+EPCs from spleen of tumor-bearing mice pretreated with shRNA of Wtap under the treatment of actinomycin D at different times. (K) qRT-PCR of FX and FVII in the nucleus and cytoplasm of CD45+EPCs from spleen and HCC tissue of tumor-bearing mice. (L) qRT-PCR of FX and FVII in the nucleus and cytoplasm of the CD45+EPCs from tumor tissue pretreated with shRNA of Wtap. (M) qRT-PCR test of FX and FVII in the nucleus and cytoplasm of the CD45+EPCs from spleen of tumor-bearing mice pretreated with AAV of Wtap. ns = non-significant. ****p < 0.0001; ***p < 0.001; **p < 0.01; *p < 0.05. Con: control; ELISA: enzyme-linked immunosorbent assay; Ig: immunoglobulin; ns: non-significant; qPCR: quantitative polymerase chain reaction.
Figure 6
Figure 6
CD45+ erythroid progenitor cells (EPCs) from the tumor microenvironment were positively associated with portal vein tumor thrombus (PVTT) and a worse prognosis. (A, B) Immunofluorescence staining of CD71 (red), CD235a or Ter119 (green), CD31 (purple), and DAPI (blue) of paraffin-embedded human (A) and mouse (B) tissue sections. (C) Immunofluorescence staining of CD71 (red), CD235a (green), CD31 (purple), and DAPI (blue) of paraffin-embedded tissue sections of hepatocellular carcinoma (HCC) patients with PVTT. (D) CD45+EPCs in the circulation of HCC patients with or without PVTT. (E) CD45+EPCs in the circulation of HCC patients with different types of PVTT. (F) Progression-free survival (PFS) and overall survival (OS) of advanced HCC patients with high and low CD45+EPCs in circulation. ****p < 0.0001; *p < 0.05. ns: non-significant; PBMC: peripheral blood mononuclear cell.
Figure 7
Figure 7
CD45+ erythroid progenitor cells (EPCs) in the tumor microenvironment promoted microvascular invasion (MVI) through C/EBPβ and m6A methylation. (A-C) Splenectomy or sham operation was conducted before construction of the orthotopic hepatocellular carcinoma (HCC) mouse model. The proportion of CD45+EPCs was assessed in tumor tissues and circulation (A). Survival curves were calculated with a humane endpoint, i.e., 10% body weight loss (B). MVI in peritumor areas (C). (D-F) CFSE-labeled CD45+EPCs were intravenously transferred from HCC tissues or the spleen to HCC-bearing splenectomized mice. (D) Analysis of CFSE+ cells in CD45+EPCs in circulation and HCC tissues. (E) Survival curves. (F) MVI analysis. (G) MVI analysis following the transfer of Cebpb shRNA and 3-deazaadenosine (DAA)-treated CD45+EPCs from HCC tissues to tumor-bearing splenectomized mice. shRNA-vector and PBS-treated CD45+EPCs from HCC tissues were used as the control. **p < 0.01; *p < 0.05. CFSE: Carboxyfluorescein Succinimidyl Ester; con: control; ns: non-significant; SSC: side scatter.

Similar articles

Cited by

References

    1. Chan SL, Chong CC, Chan AW, Poon DM, Chok KS. Management of hepatocellular carcinoma with portal vein tumor thrombosis: Review and update at 2016. World J Gastroenterol. 2016;22:7289–300. - PMC - PubMed
    1. Abdol Razak NB, Jones G, Bhandari M, Berndt MC, Metharom P. Cancer-Associated Thrombosis: An Overview of Mechanisms, Risk Factors, and Treatment. Cancers (Basel) 2018. 10. - PMC - PubMed
    1. Mukai M, Oka T. Mechanism and management of cancer-associated thrombosis. J Cardiol. 2018;72:89–93. - PubMed
    1. Zhang C, Gao Y, Du C, Markowitz GJ, Fu J, Zhang Z. et al. Hepatitis B-Induced IL8 Promotes Hepatocellular Carcinoma Venous Metastasis and Intrahepatic Treg Accumulation. Cancer Res. 2021;81:2386–98. - PubMed
    1. Kim AS, Khorana AA, McCrae KR. Mechanisms and biomarkers of cancer-associated thrombosis. Transl Res. 2020;225:33–53. - PMC - PubMed

Publication types