. 2023 Aug 21;13(13):4636-4649.
doi: 10.7150/thno.86623. eCollection 2023.

Functional mass spectrometry imaging maps phospholipase-A2 enzyme activity during osteoarthritis progression

Affiliations

Functional mass spectrometry imaging maps phospholipase-A2 enzyme activity during osteoarthritis progression

Xiwei Fan et al. Theranostics. .

Abstract

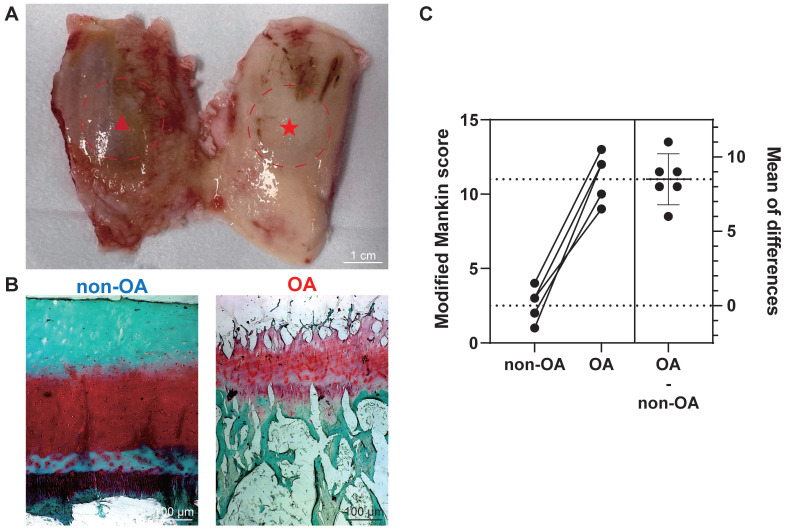
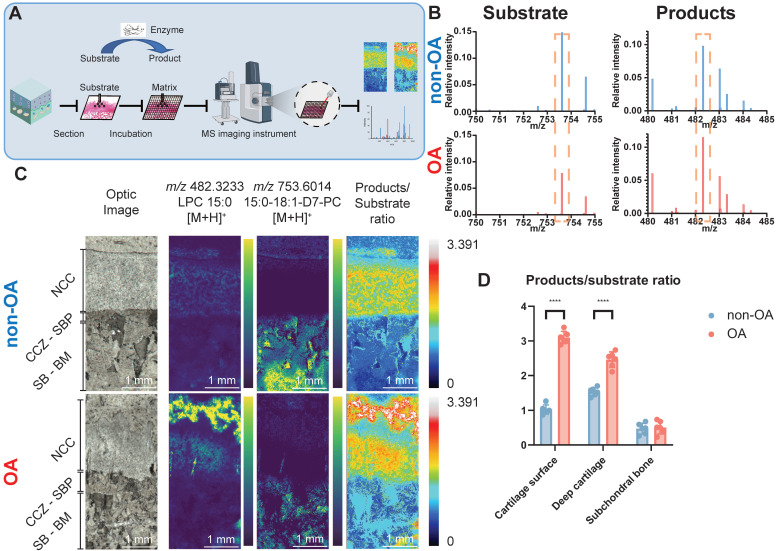
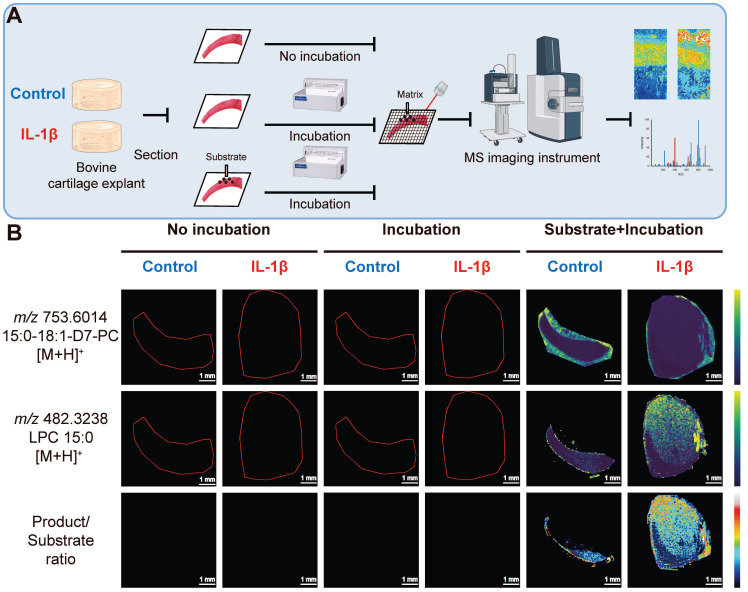
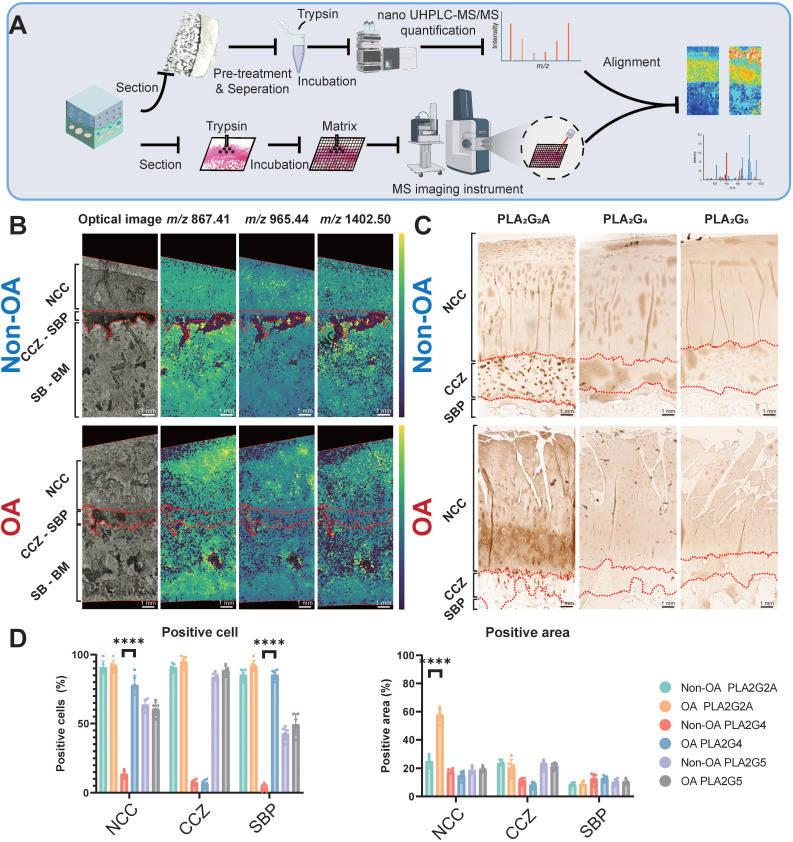
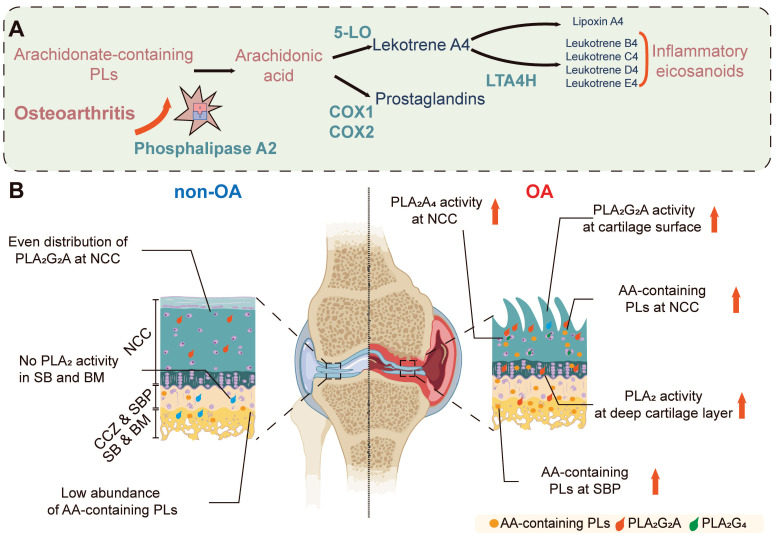
Background: Enzymes are central components of many physiological processes, and changes in enzyme activity are linked to numerous disease states, including osteoarthritis (OA). Assessing changes in enzyme function can be challenging because of difficulties in separating affected tissue areas that result in the homogenisation of healthy and diseased cells. Direct correlation between spatially-resolved enzyme distribution(s) and diseased cells/tissues can thus lead to advances in our understanding of OA pathophysiology. Herein, we present a method that uses mass spectrometry imaging (MSI) to visualise the distribution of lipase enzymes and their downstream lipid products in fresh bone and cartilage tissue sections. Immunohistostaining of adjacent tissue sections was then used to identify OA cells/tissues, which were then statistically correlated with molecular-level images. Methods: MSI was used to image lipase enzymes, their substrates, and their metabolic products to validate enzymatic activity and correlate to OA regions determined by immunohistochemistry (IHC). Based on the modified Mankin score, six non-OA and OA patient-matched osteochondral samples were analysed by matrix-assisted laser desorption/ionisation mass spectrometry imaging (MALDI-MSI). Due to the involvement of phospholipase A2 (PLA2) in inflammatory pathways, explant tissues were treated with IL-1β to mimic inflammation observed in OA. Bovine explant tissues were then subject to MSI methods to observe the spatial distribution of PLA2. Results: Compared with non-OA samples, OA samples showed an elevated level of multiple arachidonic acid (AA)-containing phospholipids (P < 0.001), in which the elevation in the surface and deep layer cartilage of OA tissues is correlated to elevated PLA2 activity (P < 0.001). Bovine explant tissues treated with IL-1β to mimic OA pathophysiology validated these results and displayed elevated PLA2 levels in OA mimic samples relative to the controls (P < 0.001). It was established that the PLA2G2A isoform specifically was responsible for PLA2 enzyme activity changes in OA tissues (P < 0.001). Conclusion: Our results present a reliable method for imaging enzyme dynamics in OA cartilage, which sets up the foundation for future spatial enzyme dynamics in the OA field. We demonstrated that OA patients exhibit increased expression of PLA2G2A at the superficial and deep cartilage zone that degrades cartilage differently at the spatial level. A tissue-specific PLA2G2A precision inhibition may be the potential target for OA.

Keywords: MALDI-MSI; enzyme dynamics; lipidomics; microenvironment; osteoarthritis.


Conflict of interest statement

Competing Interests: The authors have declared that no competing interest exists.

Figures

Figure 1
Figure 1
Histopathological assessment for the section grouping based on modified Mankin score. (A) Depiction of a femur from a total knee replacement patient, showcasing non-OA cartilage (non-OA, ★) and OA cartilage (OA, ▴). Scale bar: 1 cm. (B) Exemplary Safranin-O/Fast green staining utilised in histopathological evaluation. Scale bar: 100 µm. (C) Graphic illustrations of modified Mankin score (0-14) for histopathological examination. Data are presented as means ± standard deviation (SD) for n = 6. P < 0.05 was considered significant. *P < 0.05, **P < 0.01, ***P < 0.001.
Figure 2
Figure 2
Multiple AA-containing phospholipids change in the osteochondral unit during OA progression. (A) Matrix-assisted laser desorption/ionisation mass spectrometry imaging (MALDI-MSI) workflow and MS2 alignment of AA-containing phospholipids in tissue sections. (B) MALDI-MSI analysis of AA-containing lipids in the human osteochondral unit. One non-OA and OA section from six different subjects were imaged, and one representative lesion of each type was shown. The leftmost images are representative of optical images of the tissues. (C) The quantification of arachidonic acid-containing phospholipids between non-OA and OA osteochondral units using MALDI-MSI divided according to stratigraphy. NCC: non-calcified cartilage; CCZ: calcified cartilage zone; SBP: subchondral bone plate; SB: subchondral bone; BM: bone marrow. Data are presented as means ± standard deviation (SD) for n = 6. Scale bar: 2 mm. P < 0.05 was considered significant. *P < 0.05, **P < 0.01, ***P < 0.001. The figure was created with BioRender.com.
Figure 3
Figure 3
Functional mass spectrometry (fMSI) of human non-OA and OA knee osteochondral unit. (A) fMSI workflow. (B) Averaged MALDI mass spectrum of PC 15:0/18:1-D7 (enzyme-substrate) and LPC 15:0 (enzyme-products) in the absence of tissue. (C) MALDI-MSI ion abundance map of LPC 15:0, PC 15:0/18:1-D7 and LPC 15:0-to-PC 15:0/18:1-D7 ratio from human osteochondral tissue. One non-OA and OA section from six different subjects were imaged, and one representative lesion of each type was shown. (D) The relative intensity ratio of LPC 15:0-to-PC 15:0/18:1-D7 between non-OA and OA osteochondral units using MALDI-MSI divided according to stratigraphy. NCC: non-calcified cartilage; CCZ: calcified cartilage zone; SBP: subchondral bone plate; SB: subchondral bone; BM: bone marrow. Data are presented as means ± standard deviation (SD) for n = 6. Scale bar: 1 mm. P < 0.05 was considered significant. *P < 0.05, **P < 0.01, ***P < 0.001. The figure was created with BioRender.com.
Figure 4
Figure 4
Functional mass spectrometry (fMSI) of non-OA and OA bovine cartilage explant. (A) Bovine explant fMSI workflow. (B) MALDI-MSI ion abundance maps of PC 15:0/18:1-D7 (top), LPC 15:0 (mid), and the ratio between LPC 15:0 and PC 15:0/18:1-D7 (bottom) for the negative control and interleukin-1 beta (IL-1β) OA mimic bovine explants. Three non-OA and OA sections from two groups in three experimental settings were imaged, and one representative lesion of each type was shown. Data are presented as sample mean ± standard deviation (SD) for n = 3. Scale bar: 1 mm. The figure was created with BioRender.com.
Figure 5
Figure 5
Validation of functional mass spectrometry imaging (fMSI) by spatially resolved proteomics and immunohistochemistry (IHC). (A) Peptide mass fingerprinting and immunohistochemistry workflow. (B) MALDI-MSI abundance maps displaying nanoscale high-performance liquid chromatography coupled to mass spectrometry (nano UHPLC-MS) ion channels aligned to the PLA2G2A MSI in a comparison between non-OA and OA osteochondral units. (C) Representative IHC analysis for non-OA and OA osteochondral units using human knee samples. One non-OA and OA section from six subjects were imaged, and one representative lesion of each type was shown. (D) NCC: non-calcified cartilage; CCZ: calcified cartilage zone; SBP: subchondral bone plate; SB: subchondral bone; BM: bone marrow. Data are presented as means ± standard deviation (SD) for n = 6. Scale bar: 1 mm. P < 0.05 was considered significant. *P < 0.05, **P < 0.01, ***P < 0.001. The figure was created with BioRender.com.
Figure 6
Figure 6
Spatial PLA2 activity change and spatial AA metabolism change during OA progression. (A) OA leads to increased PLA2G2A in the osteochondral unit, which goes on to release stored AA from phospholipids which would subsequently cause the increased excitation of downstream proinflammatory signalling pathways. (B) In the normal osteochondral unit, minimal PLA2 activity is observed in the cartilage layer, and a relatively low abundance of AA-containing phospholipids locate in the BM. However, during OA progression, PLA2G2A increases in the superficial and deep layer cartilage, and PLA2G4 increases in the chondrocytes. The AA-containing phospholipids increase in the BM and cartilage. AA: arachidonic acid; NCC: non-calcified cartilage; CCZ: calcified cartilage zone; SBP: subchondral bone plate; BM: bone marrow; PLs: Phospholipids; 5-LO: 5-Lipoxygenase; COX-1: cyclooxygenase-1; COX-2: cyclooxygenase-2; LTA4H: leukotriene A4 hydrolase. The figure was created with BioRender.com.

Similar articles

Cited by

References

    1. Hamilton BR, Marshall DL, Casewell NR, Harrison RA, Blanksby SJ, Undheim EAB. Mapping Enzyme Activity on Tissue by Functional Mass Spectrometry Imaging. Angew Chem Int Ed Engl. 2020;59:3855–8. - PMC - PubMed
    1. Paine MRL, Poad BLJ, Eijkel GB, Marshall DL, Blanksby SJ, Heeren RMA. et al. Mass Spectrometry Imaging with Isomeric Resolution Enabled by Ozone-Induced Dissociation. Angew Chem Int Ed Engl. 2018;57:10530–4. - PMC - PubMed
    1. Mellinger AL, Muddiman DC, Gamcsik MP. Highlighting Functional Mass Spectrometry Imaging Methods in Bioanalysis. J Proteome Res. 2022;21:1800–7. - PubMed
    1. Leistad L, Feuerherm AJ, Faxvaag A, Johansen B. Multiple phospholipase A2 enzymes participate in the inflammatory process in osteoarthritic cartilage. Scand J Rheumatol. 2011;40:308–16. - PubMed
    1. Dennis EA. Diversity of group types, regulation, and function of phospholipase A2. J Biol Chem. 1994;269:13057–60. - PubMed

Publication types