. 2023 Aug 21;13(13):4650-4666.
doi: 10.7150/thno.85855. eCollection 2023.

Oleic acid-induced metastasis of KRAS/p53-mutant colorectal cancer relies on concurrent KRAS activation and IL-8 expression bypassing EGFR activation

Affiliations

Oleic acid-induced metastasis of KRAS/p53-mutant colorectal cancer relies on concurrent KRAS activation and IL-8 expression bypassing EGFR activation

Chih-Jie Shen et al. Theranostics. .

Abstract

Background: Multigene mutations in colorectal cancer (CRC), including KRAS, BRAF, and p53, afford high metastatic ability and resistance to EGFR-targeting therapy. Understanding the molecular mechanisms regulating anti-EGFR-resistant CRC metastasis can improve CRC therapy. This study aimed to investigate the effects of IL-8 and the activation of KRAS on reactive oxygen species (ROS) production and metastasis of hyperlipidemia-associated CRC harboring mutations of KRAS and p53. Methods: The cytokine array analysis determined the up-expression of secreted factors, including IL-8. The clinical relevance of the relationship between IL-8 and angiopoietin-like 4 (ANGPTL4) was examined in CRC patients from National Cheng Kung University Hospital and TCGA dataset. Expressions of IL-8, ANGPTL4, NADPH oxidase 4 (NOX4), and epithelial-mesenchymal transition (EMT) markers in free fatty acids (FFAs)-treated KRAS/p53 mutant CRC cells were determined. The hyperlipidemia-triggered metastatic ability of CRC cells under treatments of antioxidants, statin, and cetuximab or knockdown of IL-8, KRAS, and EGFR was evaluated in vitro and in vivo. In addition, the effects of antioxidants and depletion of IL-8 and KRAS on the correlation between ROS production and hyperlipidemia-promoted CRC metastasis were also clarified. Results: In this study, we found that free fatty acids promoted KRAS/p53-mutant but not single-mutant or non-mutant CRC cell metastasis. IL-8, the most abundant secreted factor in KRAS/p53-mutant cells, was correlated with the upregulation of NOX4 expression and ROS production under oleic acid (OA)-treated conditions. In addition, the metastasis of KRAS/p53-mutant CRC relies on the ANGPTL4/IL-8/NOX4 axis and the activation of KRAS. The antioxidants and inactivation of KRAS also inhibited OA-induced EMT and metastasis. Although KRAS mediated EGF- and OA-promoted CRC cell invasion, the inhibition of EGFR did not affect OA-induced ANGPTL4/IL-8/NOX4 axis and CRC metastasis. The high-fat diet mice fed with vitamin E and statin or in IL-8-depleted cells significantly inhibited tumor extravasation and metastatic lung growth of CRC. Conclusion: The antioxidants, statins, and targeting IL-8 may provide better outcomes for treating metastatic CRC that harbors multigene mutations and anti-EGFR resistance.

Keywords: IL-8; KRAS activation; metastasis; multigene mutant CRC; oleic acid.


Conflict of interest statement

Competing Interests: The authors have declared that no competing interest exists.

Figures

Figure 1
Figure 1
Oleic acid induces IL-8 expression concurrently with ANGPTL4 expression in CRC tissues. (A) The cytokine levels of conditioned medium harvested from oleic acid (OA)-treated SW480 cells were examined using the human cytokine array (R&D). The table shows the numerical values of dot blots indicating cytokine protein levels. (B) Real-time quantitative PCR analysis and ELISAs were performed to detect IL-8 mRNA levels and IL-8 secretion in SW480 cells treated with 200 μM OA for the indicated period. (C-D) Comparing of IL-8 and ANGPTL4 mRNA levels in 23 paired CRC tissues (T) and adjacent normal tissues (N) samples from National Cheng Kung University Hospital (IRB No. ER-112-111) (n = 23). The samples were analyzed by real-time quantitative PCR (C). Fisher's exact test was used for analyzing the correlation between ANGPTL4 (T/N ratio) and IL-8 (T/N ratio) (D). (E) Concurrent expression of ANGPTL4 and IL-8 in tumor tissues of CRC patients from the TCGA database (n = 597) was quantified (Pearson's correlation coefficient is shown in the figures; Ref: Genes Chromosomes Cancer. 2010, 49:1024-34).
Figure 2
Figure 2
OA-induced IL-8 expression relies on the ANGPTL4/integrin axis in CRC cells. (A-B) Real-time quantitative PCR analysis and ELISAs were performed to examine ANGPTL4 (A) and IL-8 (B) mRNA levels and protein levels (ELISA) in SW480 cells transfected with 5 nM IL-8 siRNA, ANGPTL4 siRNA or scrambled oligonucleotides (SC) and then treated with 200 μM OA for the indicated periods or 16 h. Cells were also transfected with 0.5 μg the full-length ANGPTL4 expression vector (flANG) or treated with 100 ng/mL recombinant human ANGPTL4 (rh-ANG) for 24 h, followed by the analysis of IL-8 mRNA expression by real-time quantitative PCR (B). (C) Western blotting (i), real-time quantitative PCR analysis (ii), and ELISAs (iii) were performed to examine the phosphorylation of FAK and ERK; mRNA levels of ANGPTL4 and IL-8 and IL-8 protein in cells treated with 5 nM ANGPTL4 siRNA or 100 μM RGD peptide, followed by treatment with 200 μM OA for 30 min (i) and 16 h (ii and iii).
Figure 3
Figure 3
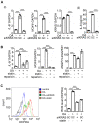
OA-induced IL-8 regulates ROS production and NOX4 expression. (A) SW480 cells were treated with 200 μM OA, 100 ng/mL IL-8 antibodies, and 10 mM NAC for 16 h. ROS levels (i) and IL-8 expression (ii) were detected by flow cytometry analysis with 200 nM DCFDA staining and real-time quantitative PCR analysis, respectively. BG indicates background. (B) Real-time quantitative PCR analysis and western blotting were performed to examine the mRNA and protein levels of IL-8 and NOX4 in SW480 cells transfected with 5 nM IL-8 siRNA or scrambled oligonucleotides (SC) and treated with 200 μM OA for 16 h (i) or 20 ng/mL recombinant human IL-8 (rh-IL-8) for various periods (ii). (C) Cells were also treated with 200 μM OA and 100 μM RGD for 16 h. The mRNA (i) and protein levels (ii) of NOX4 were examined using real-time quantitative PCR analysis and western blotting.
Figure 4
Figure 4
OA-induced IL-8 enhances EMT markers and invasion and migration of CRC cells. (A) Real-time quantitative PCR analysis was performed to examine IL-8, MMP-1, MMP-9, and MMP-3 mRNA levels in SW480 cells transfected with 5 nM IL-8 siRNA and treated with 200 μM OA for 16 h. (B-C) Invasion and migration assays were performed in SW480 cells transfected with 5 nM IL-8 siRNA or scrambled oligonucleotides (SC) and then treated with 200 μM OA and 20 ng/mL recombinant human IL-8 (rh-IL8) (B) or with conditioned medium harvested from OA-treated cells and anti-IL-8 and anti-ANGPTL4 antibodies (C). The penetrating cells were stained with crystal violet, imaged under a microscope, and then solubilized with 10% acetic acid. The absorbance was measured at a wavelength of 595 nm.
Figure 5
Figure 5
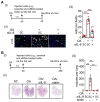
OA-induced IL-8 is essential for the metastasis of CRC cells in mice. (A-B) In vivo extravasation assay (A) and pulmonary metastasis assay (B) determined tumor cells penetrating pulmonary blood vessels and metastatic growth of tumor cells in the lungs, respectively. SW480 cells were transfected with 5 nM IL-8 siRNA, treated with 10 μM statin, labeled with Dil, and then injected into the tail vein of SCID-NOD male mice that had been preinjected with oleic acid (OA) (2 mg/kg). At 2 days (d2) or 58 days (d58) after injection of tumor cells, the mice were sacrificed, and metastatic tumor cells surrounding the lung tissue were examined as described in 'Materials and Methods.' (i). Tumor cell penetration was imaged using a microscope, and CRC pulmonary metastasis was examined using H&E staining. Arrows indicate extravasated cells. Original magnification, ×100; Dil-labeled tumor cells (red); CD31-labeled blood vessels (green); DAPI-labeled nuclei (blue) (ii). The amount of tumor cell extravasation was calculated by analyzing at least four sections and six fields. The number of micronodules per lung of each mouse was counted under a microscope. Dots indicate the number of mice (n = 6) (iii).
Figure 6
Figure 6
Inhibition of KRAS and CXCR1/2 blocks the OA-induced IL-8/NOX4 axis and ROS production. (A-B) Real-time quantitative PCR analysis was performed to examine IL-8, NOX4, KRAS, and ANGPTL4 mRNA levels in SW480 cells transfected with 5 nM KRAS siRNA or scrambled oligonucleotides (SC) (i), followed by treatment with 200 μM OA, 10 μM stain, and 10 μM reparixin for 16 h. ELISAs were performed to detect IL-8 secretion, as shown in (ii) of (A). (C) ROS levels were examined by flow cytometry analysis with 200 nM DCFDA staining in SW480 cells transfected with 5 nM KRAS siRNA, followed by treatment with 200 μM OA and 10 μM statin for 16 h. BG indicates background.
Figure 7
Figure 7
The depletion of KRAS inhibits OA-induced EMT in CRC cells. (A) Real-time quantitative PCR analysis was performed to examine MMP-1, MMP-2, MMP-3, MMP-9, and vimentin mRNA levels in SW480 cells transfected with 5 nM KRAS siRNA, followed by treatment with 200 μM OA for 16 h. (B) Invasion assays were performed using SW480 cells transfected with 5 nM KRAS siRNA and then treated with 200 μM OA and 10 mM NAC for 72 h. Invasive cells were stained with crystal violet, imaged under a microscope (lower panel), and then solubilized with 10% acetic acid. The absorbance was measured at a wavelength of 595 nm (upper panel).
Figure 8
Figure 8
Statin treatment, vitamin E treatment, and IL-8 depletion inhibit metastasis of CRC in high-fat diet mice. (A-B) Tumor cells penetrate pulmonary blood vessels, which was determined by an in vivo extravasation assay. Dil-labeled SW480 cells were transfected with 5 nM IL-8 siRNA and then injected into the tail vein of high-fat diet-fed mice. As indicated, the mice were fed vitamin E (100 mg/kg) and statins (10 mg/kg). Two days after injecting tumor cells, the mice were sacrificed to examine metastatic tumor cells surrounding the lung tissue as described in 'Materials and Methods.' (A). Tumor cell penetration was imaged using a microscope (B, left panel). Arrows indicate extravasated cells. Original magnification, ×100; Dil-labeled tumor cells (red); CD31-labeled blood vessels (green); DAPI-labeled nuclei (blue). The amount of tumor cell extravasation was calculated by analyzing at least four sections and six fields (B, right panel). Dots indicate the number of mice (n = 6). (C-D) CRC pulmonary metastasis was assessed using SW480-Luc2 cells with or without IL-8 depletion. Cells were injected into the tail vein of high-fat diet-fed mice. As indicated, the mice were fed vitamin E (100 mg/kg) and statin (10 mg/kg) (C). After 1-12 weeks, the growth of the metastatic CRC tumor was detected using the IVIS imaging system, and then the mice were sacrificed. CRC pulmonary metastasis was examined using H&E staining (D, left panel). The luminance intensity and the number of micronodules per mouse lung were counted (D, right panel). Dots indicate the number of mice (n = 5). *: p < 0.05 HFD vs. CD; #: p < 0.05 HFD vs. HFD+S or HFD vs. HFD+ S+ V or HFD vs. HFD+ siIL-8. CD: chow diet; S: statin; V: vitE.
Figure 9
Figure 9
EGF but not OA enhances invasive ability through the EGFR/KRAS pathway, not the EGFR/ERK pathway. (A-C) Invasion assays were performed using SW480 cells transfected with 5 nM siRNA (EGFR and KRAS), followed by treatment with 200 μM OA, 50 ng/mL EGF, 30 nM cetuximab (Cet), 15 μM vitamin E (VitE), 10 mM NAC, 10 μM stain, and 10 μM U0126 for 72 h. Invading cells were stained with crystal violet, imaged under a microscope (lower panel), and then solubilized with 10% acetic acid. The absorbance was measured at a wavelength of 595 nm (upper panel). (D) Tumor cells penetrated pulmonary blood vessels as determined by an in vivo extravasation assay. Dil-labeled SW480 cells were transfected with 5 nM EGFR siRNA and then injected into the tail vein of high-fat diet-fed mice (HFD). Two days after injecting tumor cells, the mice were sacrificed to examine metastatic tumor cells surrounding the lung tissue as described in 'Materials and Methods' (i). Tumor cell penetration was imaged using a microscope (ii). Arrows indicate extravasated cells. Original magnification, ×100; Dil-labeled tumor cells (red); CD31-labeled blood vessels (green); DAPI-labeled nuclei (blue). The amount of tumor cell extravasation was calculated by analyzing at least four sections and six fields. Dots indicate the number of mice (n = 6) (iii).
Figure 10
Figure 10
Schematic diagram of molecular mechanisms regulating EGF- and OA-induced metastasis in KRAS/p53-mutant CRC. Environmental EGF and fatty acids promote the metastatic properties of KRAS/p53 mutant CRC cells. The OA-induced IL-8/NOX4 axis relies on activation of the ANGPTL4/COX-2/CHOP and ANGPTL4/KRAS/ERK pathways. However, EGF-triggered cell metastasis depends on the EGFR/KRAS but not the EGFR/ERK pathway.

References

    1. Haggar FA, Boushey RP. Colorectal cancer epidemiology: incidence, mortality, survival, and risk factors. Clin Colon Rectal Surg. 2009;22:191–7. - PMC - PubMed
    1. Zacharakis M, Xynos ID, Lazaris A, Smaro T, Kosmas C, Dokou A. et al. Predictors of survival in stage IV metastatic colorectal cancer. Anticancer Res. 2010;30:653–60. - PubMed
    1. Dueland S, Guren TK, Hagness M, Glimelius B, Line P-D, Pfeiffer P. et al. Chemotherapy or liver transplantation for nonresectable liver metastases from colorectal cancer? Ann Surg. 2015;261:956–60. - PubMed
    1. Koveitypour Z, Panahi F, Vakilian M, Peymani M, Forootan FS, Esfahani MHN. et al. Signaling pathways involved in colorectal cancer progression. Cell Biosci. 2019;9:1–14. - PMC - PubMed
    1. Kawaguchi Y, Kopetz S, Newhook TE, De Bellis M, Chun YS, Tzeng CD. et al. Mutation status of RAS, TP53, and SMAD4 is superior to mutation status of RAS alone for predicting prognosis after resection of colorectal liver metastases. Clin Cancer Res. 2019;25:5843–51. - PMC - PubMed

Publication types