. 2023 Jul 31;13(13):4333-4355.
doi: 10.7150/thno.85421. eCollection 2023.

Kindlin-2 enhances c-Myc translation through association with DDX3X to promote pancreatic ductal adenocarcinoma progression

Affiliations

Kindlin-2 enhances c-Myc translation through association with DDX3X to promote pancreatic ductal adenocarcinoma progression

Chengmin Liu et al. Theranostics. .

Abstract

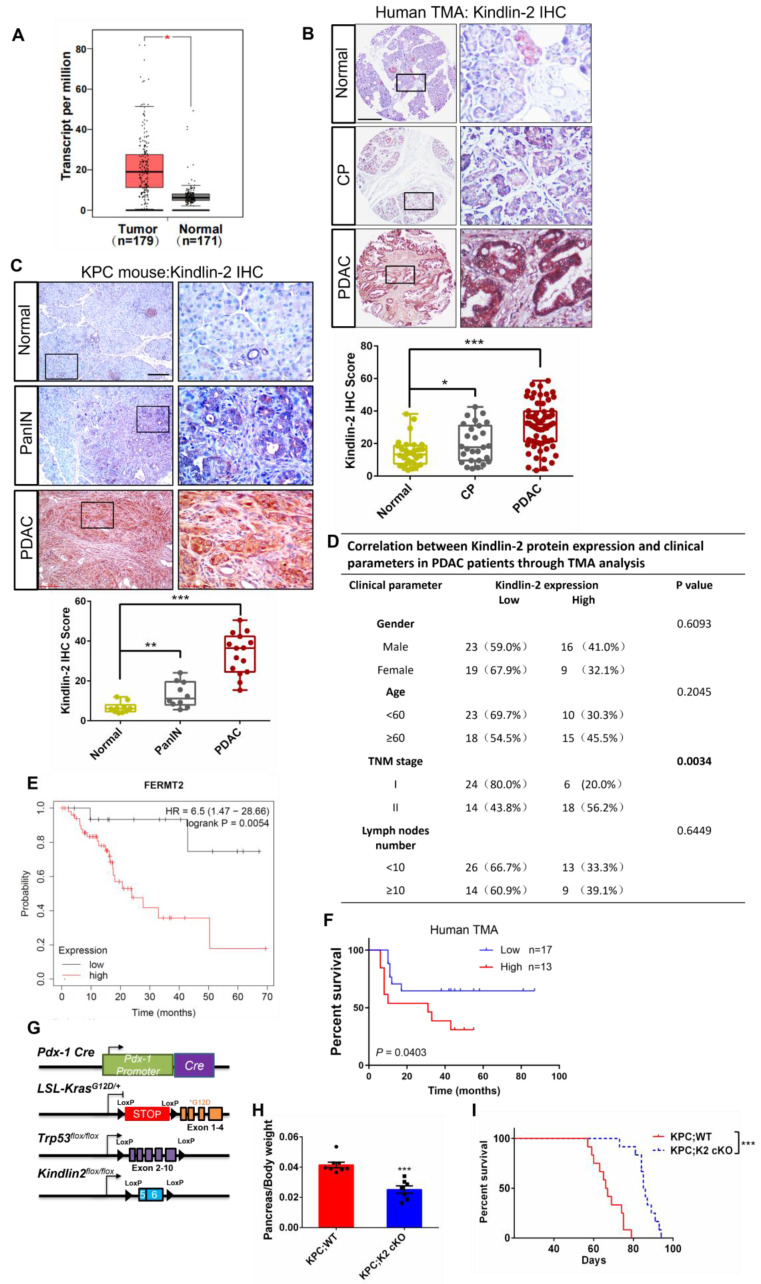
Rationale: Pancreatic ductal adenocarcinoma (PDAC) is an aggressive solid tumor, with extremely low survival rates. Identifying key signaling pathways driving PDAC progression is crucial for the development of therapies to improve patient response rates. Kindlin-2, a multi-functional protein, is involved in numerous biological processes including cell proliferation, apoptosis and migration. However, little is known about the functions of Kindlin-2 in pancreatic cancer progression in vivo. Methods: In this study, we employ an in vivo PDAC mouse model to directly investigate the role of Kindlin-2 in PDAC progression. Then, we utilized RNA-sequencing, the molecular and cellular assays to determine the molecular mechanisms by which Kindlin-2 promotes PDAC progression. Results: We show that loss of Kindlin-2 markedly inhibits KrasG12D-driven pancreatic cancer progression in vivo as well as in vitro. Furthermore, we provide new mechanistic insight into how Kindlin-2 functions in this process, A fraction of Kindlin-2 was localized to the endoplasmic reticulum and associated with the RNA helicase DDX3X, a key regulator of mRNA translation. Loss of Kindlin-2 blocked DDX3X from binding to the 5'-untranslated region of c-Myc and inhibited DDX3X-mediated c-Myc translation, leading to reduced c-Myc-mediated glucose metabolism and tumor growth. Importantly, restoration of the expression of either the full-length Kindlin-2 or c-Myc, but not that of a DDX3X-binding-defective mutant of Kindlin-2, in Kindlin-2 deficient PDAC cells, reversed the inhibition of glycolysis and pancreatic cancer progression induced by the loss of Kindlin-2. Conclusion: Our studies reveal a novel Kindlin-2-DDX3X-c-Myc signaling axis in PDAC progression and suggest that inhibition of this signaling axis may provide a promising therapeutic approach to alleviate PDAC progression.

Keywords: DDX3X; Kindlin-2; Pancreatic ductal adenocarcinoma; c-Myc; translation.


Conflict of interest statement

Competing Interests: The authors have declared that no competing interest exists.

Figures

Figure 1
Figure 1
Kindlin-2 is overexpressed in human and mouse PDAC. (A) Analysis of Kindlin-2 mRNA level in human PDAC (Tumor) and matched adjacent normal tissue (Normal) by GEPIA webserver (http://gepia.cancer-pku.cn/). *P < 0.05 vs. Normal. (B) Representative immunohistochemical staining for Kindlin-2 in TMA containing PDAC (n = 68) and chronic pancreatitis (CP) (n = 30) or normal tissues (Normal) (n = 33). Scale bar, 200 µm. Quantitative scoring was shown in the lower panel. *P < 0.05, ***P < 0.001 vs. Normal. (C) Immunohistochemical staining of Kindlin-2 in mouse normal pancreas, pancreatic intraepithelial neoplasia (PanIN) and PDAC. Scale bar, 100 µm. Quantitative scoring was shown in the lower panel. **P < 0.01, ***P < 0.001 vs. Normal. n = 3 mice for each group. For each mouse, the quantification was performed from at least three images. (D) Correlation between Kindlin-2 protein expression and clinicopathologic parameters in PDAC patients using TMA analysis. (E) Kaplan-Meier plot showing Kindlin-2 (FERMT2) expression in relation to PDAC patients' disease-free survival rates. (F) Kaplan-Meier plot showing Kindlin-2 protein expression in relation to PDAC patients' survival rates using TMA analysis. (G) The diagram depicts the strategy for the generation of KPC; Kindlin-2 cKO mice (KPC; K2 cKO). (H) Scatter plot showing the ratio of pancreas weight to body weight of 7-week-age KPC;WT and KPC;K2 cKO mice. ***P < 0.001 vs. KPC;WT. n = 8 for KPC;WT; n = 7 for KPC;K2 cKO. (I) Kaplan-Meier survival analysis of KPC;WT and KPC;K2 cKO mice. ***P < 0.001 vs. KPC;WT. n = 12 for each group mice. TMA, tissue microarray.
Figure 2
Figure 2
Kindlin-2 deletion inhibits pancreatic cancer progression and reduces pancreatic tumor cell proliferation. (A) Representative histologic images of H&E staining in the pancreatic tumors. Scale bar: 2.5 mm (upper panel); 250 µm (lower panel). Quantification analysis was shown in the right panel. n = 3 for KPC;WT; n = 4 for KPC;K2 cKO. (B) Representative histologic images of CK19 staining in the pancreatic tumors. Scale bar: 2.5 mm (upper panel); 250 µm (lower panel). Quantification analysis was shown in the right panel. ***P < 0.001 vs. KPC;WT. n = 3 for KPC;WT; n = 4 for KPC;K2 cKO. (C) Representative histologic images of Masson's trichrome staining and α-SMA staining in the pancreatic tumors. Scale bar: 500 µm (upper panel);100 µm (lower panel). Quantification analysis was shown in the right panel. ***P < 0.001 vs. KPC;WT. n = 3 for KPC;WT; n = 4 for KPC;K2 cKO. (D) Representative histologic images of collagen I staining in the pancreatic tumors. Scale bar: 250 µm (upper panel); 50 µm (lower panel). Quantification analysis was shown in the right panel. ***P < 0.001 vs. KPC;WT. n = 3 for each group. (E) Representative histologic images of CD3 staining in the pancreatic tumors. Scale bar: 100 µm (upper panel); 50 µm (lower panel). Quantification analysis was shown in the right panel. ***P < 0.001 vs. KPC;WT. n = 3 for each group. (F) Representative histologic images of F4/80 staining in the pancreatic tumors. Scale bar: 250 µm (upper panel); 100 µm (lower panel). Quantification analysis was shown in the right panel. ***P < 0.001 vs. KPC;WT. n = 3 for each group. (G) Representative histologic images of Ki-67 staining in the pancreatic tumors. Scale bar: 50 µm. Quantification analysis was shown in the right panel. **P < 0.01 vs. KPC;WT. n = 4 for KPC;WT; n = 4 for KPC;K2 cKO. (H) Knockout of Kindlin-2 in mouse primary PCCs led to a significant decrease in cell viability, as measured by cell number counting at the indicated time points. ***P < 0.001 vs. KPC;WT. n = 3 independent experiments. (I) Knockout of Kindlin-2 in mouse primary PCCs led to a significant decrease in anchorage-dependent colony-forming abilities. ***P < 0.001, vs. KPC;WT#1. n = 5 independent experiments. (J) Knockdown of Kindlin-2 in human MIA PaCa-2 cells led to a significant decrease in cell viability, as measured by cell number counting at the indicated time points. ***P < 0.001 vs. MIA PaCa-2. n = 3 independent experiments. (K) Knockdown of Kindlin-2 in human MIA PaCa-2 cells led to a significant decrease in anchorage-dependent colony-forming abilities. ***P < 0.001, vs. MIA PaCa-2. n = 4 independent experiments. (L-N) Tumor growth from the orthotopic inoculation of control or Kindlin-2 knockdown MIA PaCa-2 cells in the pancreas of nude mice. Representative images of tumors (L), quantification of tumor weight (M) and tumor volume (N) at day 14 after inoculation were shown. ***P < 0.001 vs. Ctrl siRNA. n = 7 mice for each group.
Figure 3
Figure 3
RNA-seq analysis of primary PCCs isolated from KPC;WT and KPC; K2 cKO mice. (A) Volcano plot of gene expression (KPC;K2 cKO vs. KPC;WT mice). (B) KEGG pathway enrichment analysis of differentially expressed genes in primary PCCs from KPC;K2 cKO and KPC;WT mice. (C) GSEA analysis of enriched gene sets in the comparison of primary PCCs from KPC;K2 cKO vs. KPC;WT mice. (D) GSEA analysis showing c-Myc targets-V1 and targets-V2 gene sets enriched in KPC;WT PCCs. KEGG, Kyoto Encyclopedia of Genes and Genomes; GSEA, Gene Set Enrichment Analysis.
Figure 4
Figure 4
Kindlin-2 promotes pancreatic cancer cell proliferation through regulation of the translation of c-Myc. (A) Immunoblotting analysis of a subset of protein expression (as specified in the figure) in isolated primary PCCs; Quantification analysis was shown in the lower panel. ***P < 0.001 vs. KPC;WT. n = 3 independent experiments. (B) Representative images of immunofluorescence staining for Kindlin-2 (green) and c-Myc (red) in mouse primary PCCs. Scale bar: 20 µm. Quantification analysis was shown in the lower panel. At least 15 images in each group were analyzed. ***P < 0.001 vs. KPC;WT. n = 4 independent experiments. (C) Immunoblotting analysis of c-Myc protein expression in control (Ctrl siRNA) and Kindlin-2 knockdown (K2 siRNA#1 and K2 siRNA#2) MIA PaCa-2 cells. Quantification analysis was shown in the lower panel. ***P < 0.001 vs. MIA PaCa-2. n = 3 independent experiments. (D) qPCR analysis of c-Myc mRNA expression in PCCs. n = 6 independent experiments. (E) Immunoblotting analysis of c-Myc protein level in PCCs treated with cycloheximide (CHX) for different time points as indicated (upper panel). Quantification analysis was shown in the lower panel. n = 4 independent experiments. SE, short exposure; LE, long exposure. (F) Immunoblotting analysis of c-Myc protein level in PCCs treated with proteasomal inhibitor MG132 for 6 h (upper panel). Vehicle, DMSO; MG132, 10 µM. Quantification analysis was shown in the lower panel. ***P < 0.001 vs. KPC;WT. n = 5 independent experiments. (G) Representative polysome profiles from PCCs. Absorbance (Abs) at 260 nm was shown as a function of sedimentation. (H) The fractions of polysomes were mixed together and the RNA of the mixture was isolated and subjected to qPCR analysis to determine the polysomal mRNA level of c-Myc. ***P < 0.001 vs. KPC;WT. n = 3 independent experiments. (I) Upper panel: schematic of c-Myc 5'UTR-mediated translation (Firefly luciferase as a reporter gene). Lower panel: luciferase assay of c-Myc 5'UTR-mediated translational activity in primary PCCs. ***P < 0.001 vs. KPC;WT. n = 6 independent experiments. FL, firefly; RL, Renilla.
Figure 5
Figure 5
Kindlin-2 associates with DDX3X and regulates DDX3X binding to c-Myc mRNA. (A)Volcano plot showing Kindlin-2 interacting proteins identified using Kindlin-2 immunoprecipitation followed by Mass Spectrometry (MS) in PCCs isolated from KPC;WT mice. The positions of Kindlin-2 and DDX3X are indicated. (B) Primary mouse PCCs (left panel) or Human MIA PaCa-2 (right panel) cell lysates were immunoprecipitated with anti-Kindlin-2 antibody or mouse control IgG (mIgG) followed by immunoblotting with antibodies as indicated. SE, short exposure; LE, long exposure. (C) Primary mouse PCCs (left panel) or Human MIA PaCa-2 (right panel) cell lysates were immunoprecipitated with anti-DDX3X antibody or rabbit control IgG (rIgG) followed by immunoblotting with antibodies as indicated. (D and E) Primary PCCs isolated from KPC;WT mice (D) or Human MIA PaCa-2 cells (E) were co-stained with mouse anti-Kindlin-2 and rabbit anti-DDX3X antibodies. Scale bar: 10 µm. (F) The cytosolic fraction (Cyto, lane 2), endoplasmic reticulum (ER) fraction (ER, lane 3), mitochondrial fraction (Mito, lane 4) and total cell lysates (Total, lane 1) from PCCs isolated from KPC;WT were analyzed by immunoblotting with antibodies as indicated. (G) Primary PCCs isolated from KPC;WT were co-stained with anti-Kindlin-2 and anti-ERP57 (ER marker) antibodies. Scale bar: 10 µm. (H) Mapping the subdomains of Kindlin-2 that mediated the association with DDX3X. Upper panel: schematic illustration of various Kindlin-2 fragments that were used in the GST pull-down assay. Lower panel: GST-fusion proteins containing various fragments of Kindlin-2 were used to pull-down endogenous DDX3X from PCCs isolated from KPC;WT mice. (I) The cytosolic fraction, ER fraction, mitochondrial fraction and total cell lysates from PCCs were analyzed by immunoblotting with antibodies as indicated. (J) Left panel: RNA-immunoprecipitation (RIP) strategy used to investigate DDX3X binding to c-Myc mRNA in PCCs. Right panel: c-Myc mRNA, but not cyclin D1 mRNA, was significantly enriched in DDX3X immunoprecipitated from PCCs isolated from KPC;WT compared to that from KPC;K2 cKO littermates. ***P < 0.001 vs. KPC;WT. n = 3 independent experiments. (K) Pull-down assay using the biotinylated c-Myc 5'-UTR RNA with cell lysates of mouse primary PCCs, followed by immunoblotting analysis with antibodies as indicated. (L) Left panel: RNA-immunoprecipitation (RIP) strategy used to investigate Kindlin-2 binding to c-Myc mRNA in PCCs. Right panel: c-Myc mRNA was significantly enriched in Kindlin-2 immunoprecipitants, but not in control IgG (mIgG) immunoprecipitants. *P < 0.05 vs. mIgG. n = 4 independent experiments. (M) Pull-down assay using the biotinylated c-Myc 5' UTR RNA or control RNA with cell lysates of mouse primary PCCs, followed by immunoblotting analysis with antibodies as indicated. FT, flow through. (N) Pull-down assay using the biotinylated c-Myc 3' UTR RNA or control RNA with cell lysates of mouse primary PCCs, followed by immunoblotting analysis with antibodies as indicated. FT, flow through. (O) Pull-down assay using the biotinylated c-Myc 5'UTR RNA or control RNA with purified GST-Kindlin-2 (GST-K2)/GST or GST-K2/GST-DDX3X, followed by immunoblotting analysis with anti-Kindlin-2 antibodies.
Figure 6
Figure 6
Kindlin-2 deletion reduces c-Myc downstream targets GLUT1 and HK2 expression and inhibits glycolysis in pancreatic cancer cells. (A) qPCR analysis of Glucose transporter 1 (GLUT1) and hexokinase 2 (HK2) mRNA expression in PCCs. ***P < 0.001 vs. KPC;WT. n = 4 independent experiments. (B) Immunoblotting analysis of GLUT1 and HK2 protein levels in PCCs (left panel). Quantification data were shown in the right panel. ***P < 0.001 vs. KPC;WT. n = 3 independent experiments. (C) Immunoblotting analysis of GLUT1 and HK2 protein levels in control (Ctrl siRNA) and Kindlin-2 knockdown (K2 siRNA#1 and K2 siRNA#2) MIA PaCa-2 cells. Quantification analysis was shown in the right panel. *** P < 0.001 vs. MIA PaCa-2. n = 3 independent experiments. (D) Representative images of pancreatic tumor sections stained with antibodies as indicated in the figure. Scale bar: 100 µm. (E) Quantification of staining intensity of GLUT1 and HK2 levels in pancreatic tumor sections. ***P < 0.001 vs. KPC;WT. n = 4 mice. For each mouse, the quantification was performed from at least ten images. (F) The relative glucose uptake was measured in PCCs or Human MIA PaCa-2 cells. ***P < 0.001 vs. KPC;WT, n = 7 independent experiments for PCCs (left panel); ***P < 0.001 vs. Ctrl siRNA, n = 5 for MIA PaCa-2 cells (right panel). (G) Lactate production in PCCs or Human MIA PaCa-2 cells. Levels of lactate in the culture medium were measured and normalized to the cell number. ***P < 0.001 vs. KPC;WT, n = 8 independent experiments for PCCs (left panel); ***P < 0.001 vs. Ctrl siRNA, n = 5 for MIA PaCa-2 cells (right panel). (H and I) Glycolysis flux was examined by measuring the extracellular acidification rate (ECAR) using the Seahorse analyzer in PCCs (H) or in Human MIA PaCa-2 cells (I). Glucose (10 mM), ATP synthase inhibitor oligomycin (1 µM), and glycolysis inhibitor 2-Deoxy-D-glucose (2-DG, 50 mM) were added to the cells at the indicated time points. The values of glycolysis and glycolytic capacity were calculated by the Seahorse XFe96 software and shown in the right panel. ***P < 0.001 vs. KPC;WT, n = 11 independent experiments for PCCs (H); ***P < 0.001, **P < 0.01 vs. Ctrl siRNA, n = 5 for MIA PaCa-2 cells (I).
Figure 7
Figure 7
Overexpression of GLUT1/HK2 rescues Kindlin-2-deficency-induced inhibition of glycolysis and pancreatic cancer cell proliferation. Mouse primary PCCs isolated from KPC;K2 WT or KPC;K2 cKO mice were infected with lentiviral vectors encoding full-length GLUT1 and HK2 (GLUT1/HK2) or empty vector pLVX-IRES-Hyg. (A) Immunoblotting analysis of GLUT1 and HK2 protein levels in PCCs (different groups as specified in the figure). (B) The relative glucose uptake was measured in PCCs (different groups as specified in the figure). ***P < 0.001 vs. KPC;WT. n = 4 independent experiments. (C) Lactate production in PCCs as specified in the figure. Levels of lactate in the culture medium were measured and normalized to the cell number. **P < 0.01 vs. KPC;WT. n = 4 independent experiments. (D) Glycolysis flux was examined by measuring the extracellular acidification rate (ECAR) using the Seahorse analyzer. Glucose (10 mM), ATP synthase inhibitor oligomycin (1 µM), and glycolysis inhibitor 2-DG (50 mM) were added to the cells as indicated in the figure at the indicated time points. (E) The values of glycolysis and glycolytic capacity were calculated by the Seahorse XFe96 software. ***P < 0.001 vs. KPC;WT. n = 4 independent experiments. (F) Overexpression of GLUT1 and HK2 in Kindlin-2-deficient PCCs led to a significant increase in anchorage-dependent colony-forming ability. Representative images (left panel) and quantification analysis (right panel) were shown. ***P < 0.001, **P < 0.01 vs. KPC;WT. n = 3 independent experiments.
Figure 8
Figure 8
c-Myc expression is crucial for Kindlin-2-mediated regulation of glycolysis and pancreatic cancer cell proliferation. Mouse primary PCCs isolated from KPC;K2 WT or KPC;K2 cKO mice were infected with lentiviral vectors encoding full-length c-Myc (c-Myc-GFP) or empty vector GFP-tagged pLVX-IRES-Hyg (GFP). (A) Immunoblotting analysis of GLUT1 and HK2 protein levels in PCCs as specified in the figure. (B) The relative glucose uptake was measured in PCCs as specified in the figure. ***P < 0.001 vs. KPC;WT. n = 6 independent experiments. (C) Lactate production in PCCs as specified in the figure. Levels of lactate in the culture medium were measured and normalized to the cell number. ***P < 0.001 vs. KPC;WT. n = 5 independent experiments. (D) Glycolysis flux was examined by measuring the extracellular acidification rate (ECAR) using the Seahorse analyzer. Glucose (10 mM), ATP synthase inhibitor oligomycin (1 µM), and glycolysis inhibitor 2-DG (50 mM) were added to the cells as indicated in the figure at the indicated time points. (E)The values of glycolysis and glycolytic capacity were calculated by the Seahorse XFe96 software. ***P < 0.001 vs. KPC;WT. n = 5 independent experiments. (F) Overexpression of c-Myc in Kindlin-2-deficient PCCs led to a significant increase in anchorage-dependent colony-forming ability. Representative images (left panel) and quantification analysis (right panel) were shown. ***P < 0.001, **P < 0.01 vs. KPC;WT. n = 6 independent experiments.
Figure 9
Figure 9
Kindlin-2 association with DDX3X is crucial for the regulation of c-Myc translation and its downstream events. Primary PCCs isolated from KPC;K2 WT or KPC;K2 cKO mice were infected with lentiviral vectors encoding wild-type Kindlin-2 (K2 WT) or F1-domain-deleted mutant of Kindlin-2 (K2 ΔF1) or empty vector pLVX-IRES-Hyg. (A) Cell lysates were immunoprecipitated with anti-Kindlin-2 antibody followed by immunoblotting with antibodies as indicated. (B) Immunoblotting analysis of c-Myc, GLUT1 and HK2 protein levels in PCCs as specified in the figure. (C) Pull-down assay using the biotinylated c-Myc 5'-UTR RNA with lysates of PCCs as specified in the figure, followed by immunoblotting analysis with antibodies as indicated. (D) Luciferase assay of c-Myc 5'-UTR-mediated translational activity in PCCs as specified in the figure. ***P < 0.001 vs. KPC;WT. n = 8 independent experiments. (E) The relative glucose uptake was measured in PCCs as specified in the figure. ***P < 0.001 vs. KPC;WT. n = 6 independent experiments. (F) Lactate production in PCCs as specified in the figure. Levels of lactate in the culture medium were measured and normalized to the cell number. ***P < 0.001 vs. KPC;WT. n = 4. (G) Glycolysis flux was examined by measuring the extracellular acidification rate (ECAR) using the Seahorse analyzer. Glucose (10 mM), ATP synthase inhibitor oligomycin (1 µM), and glycolysis inhibitor 2-DG (50 mM) were added to the cells as indicated in the figure at the indicated time points. (H) The values of glycolysis and glycolytic capacity were calculated by the Seahorse XFe96 software. **P < 0.01 vs. KPC;WT. n = 6 independent experiments. (I) Overexpression of K2 WT, but not K2 ΔF1, in Kindlin-2-deficient PCCs led to a significant increase in anchorage-dependent colony-forming ability. Representative images (left panel) and quantification analysis (right panel) were shown. ***P < 0.001 vs. KPC;WT. n = 6 independent experiments. (J) Schematic illustration of the mechanism of Kindlin-2 regulation of pancreatic cancer progression.

Similar articles

Cited by

References

    1. Siegel RL, Miller KD, Fuchs HE, Jemal A. Cancer Statistics, 2021. CA Cancer J Clin. 2021;71:7–33. - PubMed
    1. Park W, Chawla A, O'Reilly EM. Pancreatic Cancer: A Review. JAMA. 2021;326:851–62. - PMC - PubMed
    1. Heeg S, Das KK, Reichert M, Bakir B, Takano S, Caspers J. et al. ETS-Transcription Factor ETV1 Regulates Stromal Expansion and Metastasis in Pancreatic Cancer. Gastroenterology. 2016;151:540–53. e14. - PMC - PubMed
    1. Qian W, Li J, Chen K, Jiang Z, Cheng L, Zhou C. et al. Metformin suppresses tumor angiogenesis and enhances the chemosensitivity of gemcitabine in a genetically engineered mouse model of pancreatic cancer. Life Sci. 2018;208:253–61. - PubMed
    1. Krebs AM, Mitschke J, Lasierra Losada M, Schmalhofer O, Boerries M, Busch H. et al. The EMT-activator Zeb1 is a key factor for cell plasticity and promotes metastasis in pancreatic cancer. Nat Cell Biol. 2017;19:518–29. - PubMed

Substances