

SARS-CoV-2 Prediction Strategy Based on Classification Algorithms from a Full Blood Examination
- PMID: 37649715
- PMCID: PMC10465262
- DOI: 10.1155/2023/3248192
SARS-CoV-2 Prediction Strategy Based on Classification Algorithms from a Full Blood Examination
Abstract
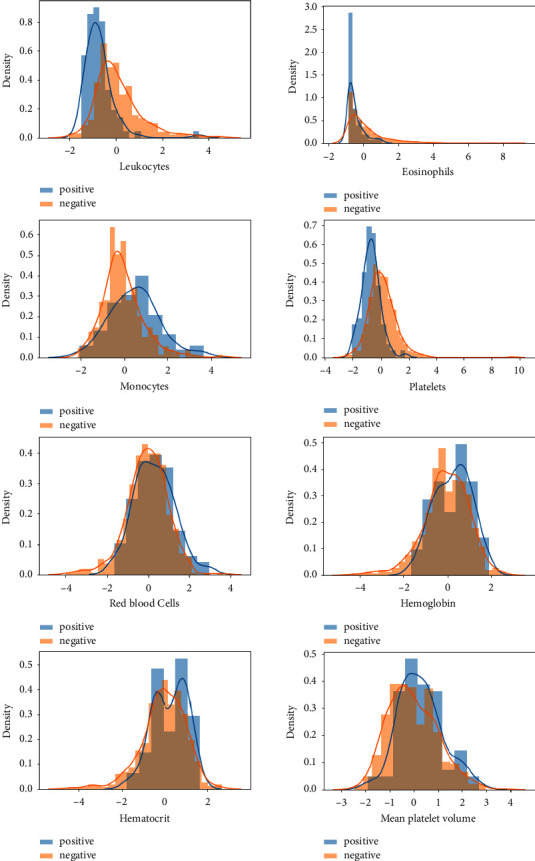
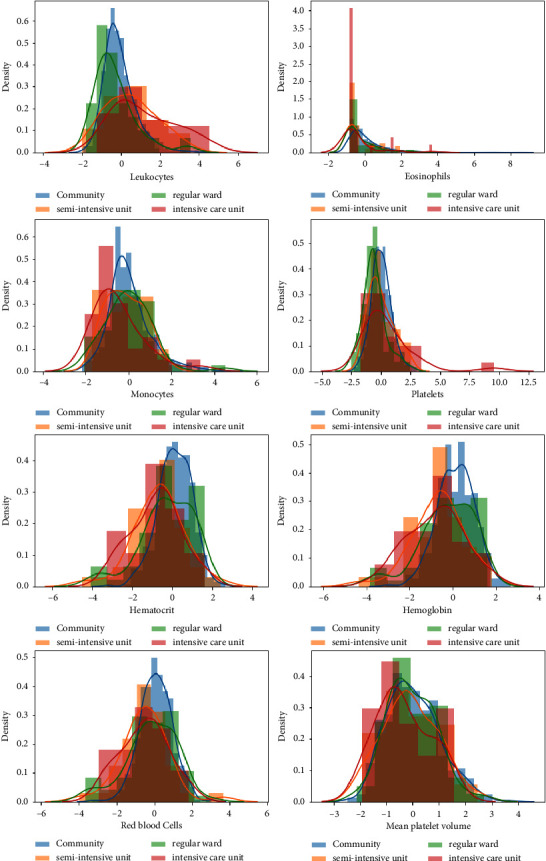
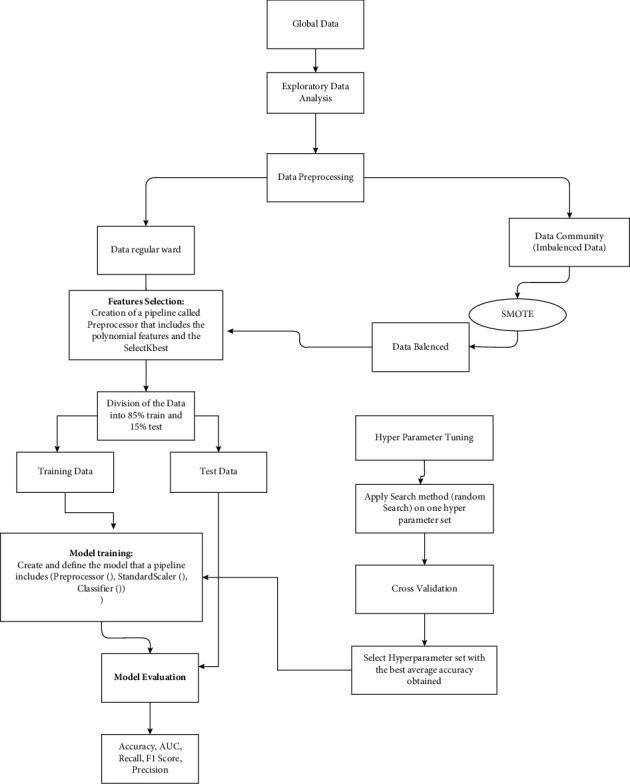
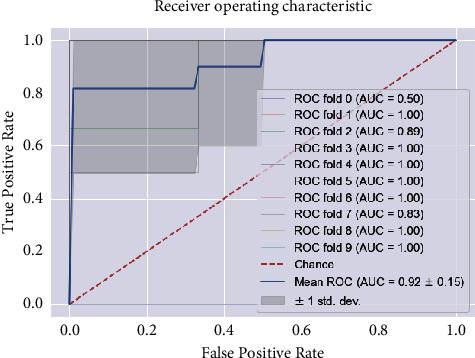
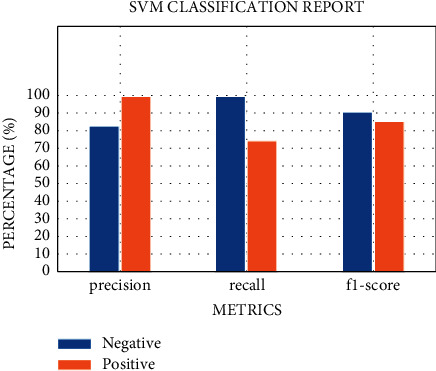
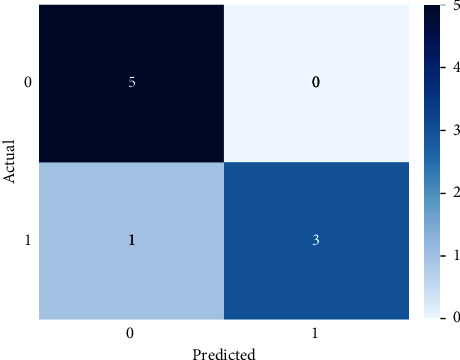
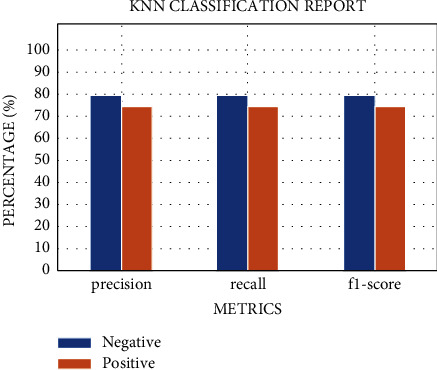
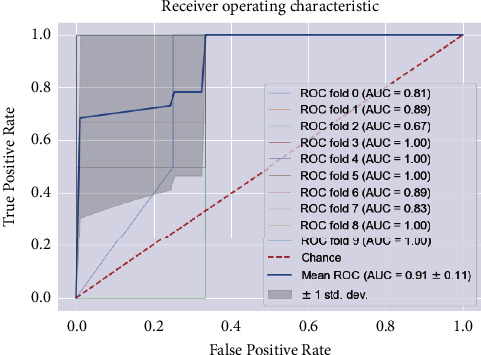
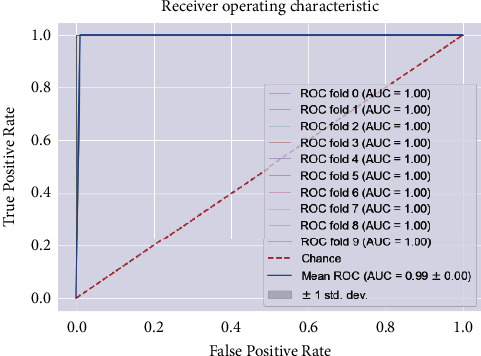
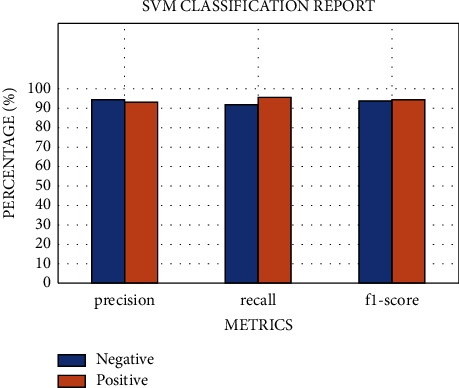
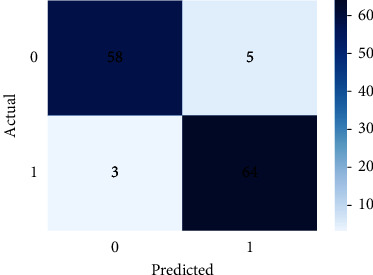
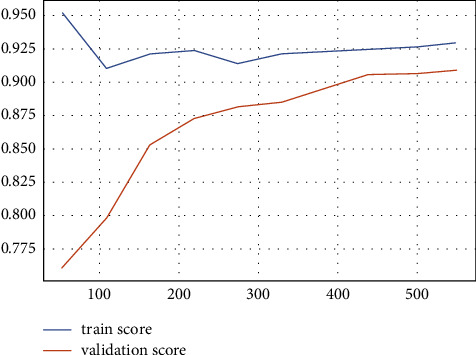
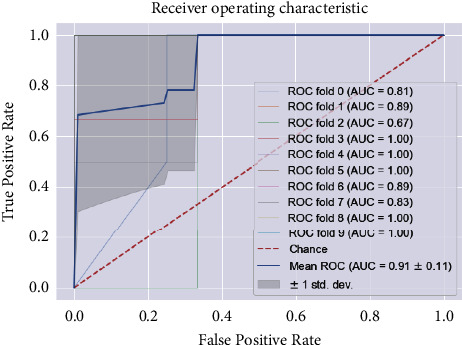
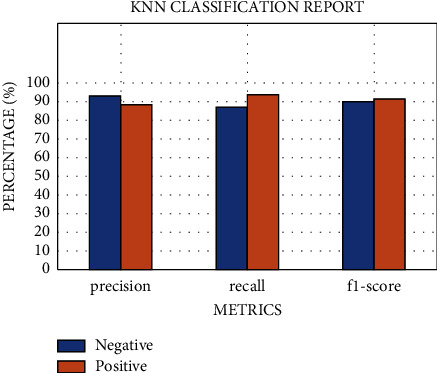
A fast and efficient diagnosis of serious infectious diseases, such as the recent SARS-CoV-2, is necessary in order to curb both the spread of existing variants and the emergence of new ones. In this regard and recognizing the shortcomings of the reverse transcription-polymerase chain reaction (RT-PCR) and rapid diagnostic test (RDT), strategic planning in the public health system is required. In particular, helping researchers develop a more accurate diagnosis means to distinguish patients with symptoms with COVID-19 from other common infections is what is needed. The aim of this study was to train and optimize the support vector machine (SVM) and K-nearest neighbors (KNN) classifiers to rapidly identify SARS-CoV-2 (positive/negative) patients through a simple complete blood test without any prior knowledge of the patient's health state or symptoms. After applying both models to a sample of patients at Israelita Albert Einstein at São Paulo, Brazil (solely for two examined groups of patients' data: "regular ward" and "not admitted to the hospital"), it was found that both provided early and accurate detection, based only on a selected blood profile via the statistical test of dependence (ANOVA test). The best performance was achieved by the improved SVM technique on nonhospitalized patients, with precision, recall, accuracy, and AUC values reaching 94%, 96%, 95%, and 99%, respectively, which supports the potential of this innovative strategy to significantly improve initial screening.
Copyright © 2023 C. F. Choukhan et al.
Conflict of interest statement
The authors declare that they have no conflicts of interest.
Figures
Similar articles
-
Effectiveness and cost-effectiveness of four different strategies for SARS-CoV-2 surveillance in the general population (CoV-Surv Study): a structured summary of a study protocol for a cluster-randomised, two-factorial controlled trial.Trials. 2021 Jan 8;22(1):39. doi: 10.1186/s13063-020-04982-z. Trials. 2021. PMID: 33419461 Free PMC article.
-
An Overview of Supervised Machine Learning Methods and Data Analysis for COVID-19 Detection.J Healthc Eng. 2021 Nov 22;2021:4733167. doi: 10.1155/2021/4733167. eCollection 2021. J Healthc Eng. 2021. PMID: 34853669 Free PMC article. Review.
-
Bean Extract-Based Gargle for Efficient Diagnosis of Active COVID-19 Infection Using Rapid Antigen Tests.Microbiol Spectr. 2022 Feb 23;10(1):e0161421. doi: 10.1128/spectrum.01614-21. Epub 2022 Feb 16. Microbiol Spectr. 2022. PMID: 35171037 Free PMC article.
-
Rapid Triage of Children with Suspected COVID-19 Using Laboratory-Based Machine-Learning Algorithms.Viruses. 2023 Jul 8;15(7):1522. doi: 10.3390/v15071522. Viruses. 2023. PMID: 37515208 Free PMC article.
-
COVID-19 diagnosis: A comprehensive review of pre-trained deep learning models based on feature extraction algorithm.Results Eng. 2023 Jun;18:101020. doi: 10.1016/j.rineng.2023.101020. Epub 2023 Mar 16. Results Eng. 2023. PMID: 36945336 Free PMC article. Review.
References
-
- World Health Organization (WHO) Virtual press conference on COVID-19. 2020. https://www.who.int/docs/default-source/coronaviruse/transcripts/who-aud... .
-
- Worldometers. 2020. https://www.worldometers.info/coronavirus/
-
- World Health Organization (WHO) WHO covid-19 strategy update. 2020. https://www.who.int/docs/default-source/coronaviruse/covid-strategy-upda... .
MeSH terms
LinkOut - more resources
Full Text Sources
Medical
Miscellaneous
