Bioinformatics analysis of potential common pathogenic mechanism for carotid atherosclerosis and Parkinson's disease
- PMID: 37649719
- PMCID: PMC10464527
- DOI: 10.3389/fnagi.2023.1202952
Bioinformatics analysis of potential common pathogenic mechanism for carotid atherosclerosis and Parkinson's disease
Abstract
Background: Cerebrovascular disease (CVD) related to atherosclerosis and Parkinson's disease (PD) are two prevalent neurological disorders. They share common risk factors and frequently occur together. The aim of this study is to investigate the association between atherosclerosis and PD using genetic databases to gain a comprehensive understanding of underlying biological mechanisms.
Methods: The gene expression profiles of atherosclerosis (GSE28829 and GSE100927) and PD (GSE7621 and GSE49036) were downloaded from the Gene Expression Omnibus (GEO) database. After identifying the common differentially expressed genes (DEGs) for these two disorders, we constructed protein-protein interaction (PPI) networks and functional modules, and further identified hub genes using Least Absolute Shrinkage and Selection Operator (LASSO) regression. The diagnostic effectiveness of these hub genes was evaluated using Receiver Operator Characteristic Curve (ROC) analysis. Furthermore, we used single sample gene set enrichment analysis (ssGSEA) to analyze immune cell infiltration and explored the association of the identified hub genes with infiltrating immune cells through Spearman's rank correlation analysis in R software.
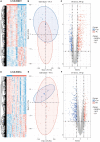
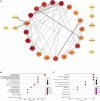
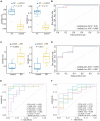
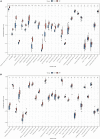
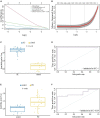
Results: A total of 50 shared DEGs, with 36 up-regulated and 14 down-regulated genes, were identified through the intersection of DEGs of atherosclerosis and PD. Using LASSO regression, we identified six hub genes, namely C1QB, CD53, LY96, P2RX7, C3, and TNFSF13B, in the lambda.min model, and CD14, C1QB, CD53, P2RX7, C3, and TNFSF13B in the lambda.1se model. ROC analysis confirmed that both models had good diagnostic efficiency for atherosclerosis datasets GSE28829 (lambda.min AUC = 0.99, lambda.1se AUC = 0.986) and GSE100927 (lambda.min AUC = 0.922, lambda.1se AUC = 0.933), as well as for PD datasets GSE7621 (lambda.min AUC = 0.924, lambda.1se AUC = 0.944) and GSE49036 (lambda.min AUC = 0.894, lambda.1se AUC = 0.881). Furthermore, we found that activated B cells, effector memory CD8 + T cells, and macrophages were the shared correlated types of immune cells in both atherosclerosis and PD.
Conclusion: This study provided new sights into shared molecular mechanisms between these two disorders. These common hub genes and infiltrating immune cells offer promising clues for further experimental studies to explore the common pathogenesis of these disorders.
Keywords: Parkinson’s disease; atherosclerosis; bioinformatics analysis; hub genes; immune cells infiltration.
Copyright © 2023 Wang and Xue.
Conflict of interest statement
The authors declare that the research was conducted in the absence of any commercial or financial relationships that could be construed as a potential conflict of interest.
Figures




Similar articles
-
Integrated analysis and exploration of potential shared gene signatures between carotid atherosclerosis and periodontitis.BMC Med Genomics. 2022 Oct 31;15(1):227. doi: 10.1186/s12920-022-01373-y. BMC Med Genomics. 2022. PMID: 36316672 Free PMC article.
-
Identification and Validation of Oxidative Stress-Related Hub Genes in Parkinson's Disease.Mol Neurobiol. 2025 May;62(5):5466-5483. doi: 10.1007/s12035-024-04622-6. Epub 2024 Nov 18. Mol Neurobiol. 2025. PMID: 39556279
-
Identifying the hub gene and immune infiltration of Parkinson's disease using bioinformatical methods.Brain Res. 2022 Jun 15;1785:147879. doi: 10.1016/j.brainres.2022.147879. Epub 2022 Mar 10. Brain Res. 2022. PMID: 35278479
-
Identification of potential immune-related hub genes in Parkinson's disease based on machine learning and development and validation of a diagnostic classification model.PLoS One. 2023 Dec 5;18(12):e0294984. doi: 10.1371/journal.pone.0294984. eCollection 2023. PLoS One. 2023. PMID: 38051734 Free PMC article.
-
Novel diagnostic biomarkers related to immune infiltration in Parkinson's disease by bioinformatics analysis.Front Neurosci. 2023 Jan 26;17:1083928. doi: 10.3389/fnins.2023.1083928. eCollection 2023. Front Neurosci. 2023. PMID: 36777638 Free PMC article.
References
LinkOut - more resources
Full Text Sources
Research Materials
Miscellaneous

